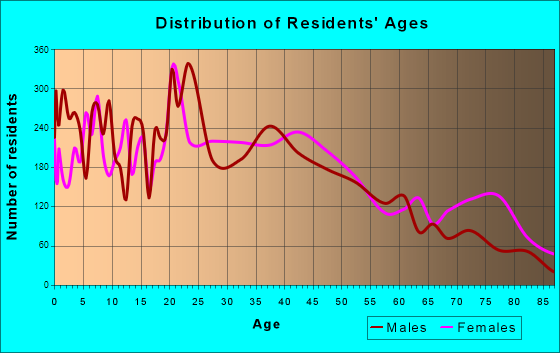
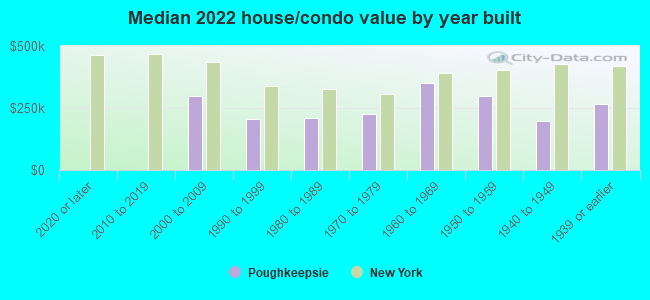
Poughkeepsie, NY (New York) Houses and Residents
| Poughkeepsie: | $263,446 |
| New York: | $400,400 |
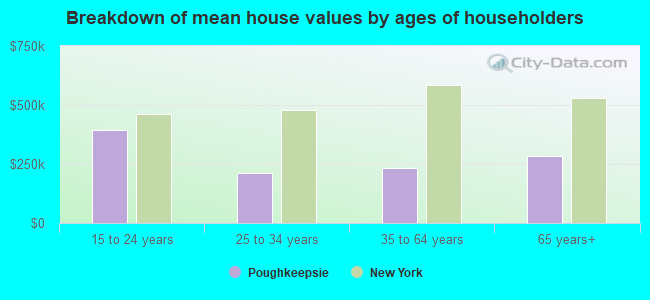
Mean price in 2022:
Detached houses: $322,339
Here: $322,339 State: $476,719 Townhouses or other attached units: $388,488
Here: $388,488 State: $699,270 In 2-unit structures: $344,634
Here: $344,634 State: $713,077 In 3-to-4-unit structures: $470,385
Here: $470,385 State: $764,568 In 5-or-more-unit structures: $366,950
Here: $366,950 State: $912,009
Total population: 30,513 (Urban population: 29,871, Rural population: 0)
Houses: 14,654 (13,700 occupied: 5,225 owner occupied, 8,729 renter occupied)
| % of renters here: | 63% |
| State: | 46% |
Housing density: 2,848 houses/condos per square mile
Median price asked for vacant for-sale houses and condos in 2022: $1,545,625.
Median contract rent in 2022: $1,118 (lower quartile is $842, upper quartile is $1,419)
Median rent asked for vacant for-rent units in 2022: $1,476
Median gross rent in Poughkeepsie, NY in 2022: $1,358
Housing units in Poughkeepsie with a mortgage: 3,345 (316 second mortgage, 31 home equity loan, 245 both second mortgage and home equity loan)
Houses without a mortgage: 159
Median household income for houses/condos with a mortgage: $99,282
Median household income for apartments without a mortgage: $84,407
Median monthly housing costs: $1,385
Compare current foreclosures in Poughkeepsie, NY:
| Photo | Address | Area | Beds / Baths | Price | Details |
|---|---|---|---|---|---|

|
#1
Church St
Poughkeepsie, NY 12601
|
1,521 sq. feet
|
1 baths 4 beds |
$25,000
|
show details |

|
#2
Gray St
Poughkeepsie, NY 12603
|
2,880 sq. feet
|
2 baths 4 beds |
show details | |

|
#3
Cardinal Dr
Poughkeepsie, NY 12601
|
1,080 sq. feet
|
1 baths 3 beds |
show details | |

|
#4
Parker Ave
Poughkeepsie, NY 12601
|
3,648 sq. feet
|
2 baths 9 beds |
show details | |

|
#5
Edgewood Dr
Poughkeepsie, NY 12603
|
1,056 sq. feet
|
1 baths 3 beds |
show details | |

|
#6
Violet Ave
Poughkeepsie, NY 12601
|
868 sq. feet
|
1 baths 3 beds |
show details | |

|
#7
N Bridge St
Poughkeepsie, NY 12601
|
1,613 sq. feet
|
2 baths 2 beds |
show details | |

|
#8
Marshall St
Poughkeepsie, NY 12601
|
2,656 sq. feet
|
2 baths 5 beds |
show details | |

|
#9
Kimball Dr
Poughkeepsie, NY 12603
|
1,944 sq. feet
|
2 baths 5 beds |
show details | |

|
#10
Birch Hill Dr
Poughkeepsie, NY 12603
|
2,210 sq. feet
|
2 baths 4 beds |
show details |
| Photo | Address | Area | Beds / Baths | Price | Details |
|---|---|---|---|---|---|

|
#11
Marie Ct
Poughkeepsie, NY 12601
|
2,900 sq. feet
|
3 baths 4 beds |
show details | |

|
#12
Horseshoe Dr
Poughkeepsie, NY 12603
|
2,157 sq. feet
|
1 baths 4 beds |
show details | |

|
#13
Pond St
Poughkeepsie, NY 12603
|
1,856 sq. feet
|
2 baths 3 beds |
show details | |

|
#14
N Grand Ave
Poughkeepsie, NY 12603
|
1,962 sq. feet
|
1 baths 3 beds |
show details | |

|
#15
Catskill Ave
Poughkeepsie, NY 12603
|
1,540 sq. feet
|
1 baths 4 beds |
show details | |

|
#16
Marshall St
Poughkeepsie, NY 12601
|
1,899 sq. feet
|
1 baths 3 beds |
show details | |

|
#17
Mockingbird Ln
Poughkeepsie, NY 12601
|
1,696 sq. feet
|
1 baths 3 beds |
show details | |

|
#18
Forbus St
Poughkeepsie, NY 12601
|
2,699 sq. feet
|
1 baths 4 beds |
show details | |

|
#19
Tall Tree Ln
Poughkeepsie, NY 12601
|
1,210 sq. feet
|
1 baths 2 beds |
show details | |

|
#20
Cobey Ter
Poughkeepsie, NY 12601
|
1,209 sq. feet
|
1 baths 3 beds |
show details |
| Photo | Address | Area | Beds / Baths | Price | Details |
|---|---|---|---|---|---|

|
#21
Kinry Rd
Poughkeepsie, NY 12603
|
1,824 sq. feet
|
1 baths 4 beds |
show details | |

|
#22
Mountain View Rd
Poughkeepsie, NY 12603
|
1,883 sq. feet
|
1 baths 3 beds |
show details | |

|
#23
Horizon Hill Dr
Poughkeepsie, NY 12603
|
1,493 sq. feet
|
1 baths 3 beds |
show details | |

|
#24
Hoffman Ave
Poughkeepsie, NY 12603
|
2,184 sq. feet
|
2 baths 6 beds |
show details | |

|
#25
Hammersley Ave
Poughkeepsie, NY 12601
|
2,880 sq. feet
|
2 baths 4 beds |
show details | |

|
#26
Van Wagner Rd
Poughkeepsie, NY 12603
|
1,841 sq. feet
|
1 baths 2 beds |
show details | |

|
#27
Marwood Dr
Poughkeepsie, NY 12601
|
1,408 sq. feet
|
1 baths 4 beds |
show details | |

|
#28
Jay Rd
Poughkeepsie, NY 12603
|
1,900 sq. feet
|
2 baths 3 beds |
show details | |

|
#29
Hillis Ter
Poughkeepsie, NY 12603
|
1,892 sq. feet
|
1 baths 4 beds |
show details | |

|
#30
Columbia St
Poughkeepsie, NY 12601
|
1,344 sq. feet
|
1 baths 2 beds |
show details |
| Photo | Address | Area | Beds / Baths | Price | Details |
|---|---|---|---|---|---|

|
#31
Winnie Ln
Poughkeepsie, NY 12603
|
1,600 sq. feet
|
1 baths 3 beds |
show details | |

|
#32
Violet Ave
Poughkeepsie, NY 12601
|
1,560 sq. feet
|
1 baths 3 beds |
show details | |

|
#33
Rothenburgh Rd
Poughkeepsie, NY 12603
|
1,896 sq. feet
|
2 baths 4 beds |
show details | |

|
#34
Marwood Dr
Poughkeepsie, NY 12601
|
1,408 sq. feet
|
1 baths 4 beds |
show details | |

|
#35
Seaman Rd
Poughkeepsie, NY 12601
|
3,574 sq. feet
|
2 baths 5 beds |
show details | |

|
#36
Wayne Dr
Poughkeepsie, NY 12601
|
2,480 sq. feet
|
2 baths 4 beds |
show details | |

|
#37
Lyons Dr
Poughkeepsie, NY 12601
|
1,204 sq. feet
|
1 baths 2 beds |
show details | |

|
#38
Freedom Plains Rd
Poughkeepsie, NY 12603
|
1,605 sq. feet
|
1 baths 3 beds |
show details | |

|
#39
Baker St
Poughkeepsie, NY 12603
|
2,269 sq. feet
|
2 baths 3 beds |
show details | |

|
#40
Marino Rd
Poughkeepsie, NY 12601
|
1,512 sq. feet
|
1 baths 4 beds |
show details |
| Photo | Address | Area | Beds / Baths | Price | Details |
|---|---|---|---|---|---|

|
#41
Corlies Ave
Poughkeepsie, NY 12601
|
1,210 sq. feet
|
1 baths 3 beds |
show details | |

|
#42
Hillis Ter
Poughkeepsie, NY 12603
|
1,760 sq. feet
|
1 baths 2 beds |
show details | |

|
#43
Briarcliff Ave
Poughkeepsie, NY 12603
|
1,856 sq. feet
|
2 baths 3 beds |
show details | |

|
#44
Falcon Ct
Poughkeepsie, NY 12603
|
1,576 sq. feet
|
2 baths 2 beds |
show details | |

|
#45
N Grand Ave
Poughkeepsie, NY 12603
|
1,152 sq. feet
|
1 baths 3 beds |
show details | |

|
#46
Oriole Dr
Poughkeepsie, NY 12601
|
1,432 sq. feet
|
1 baths 3 beds |
show details | |

|
#47
S Grand Ave
Poughkeepsie, NY 12603
|
1,680 sq. feet
|
1 baths 4 beds |
show details | |

|
#48
Lindbergh Pl
Poughkeepsie, NY 12603
|
1,198 sq. feet
|
1 baths 3 beds |
show details | |

|
#49
Bedell Rd
Poughkeepsie, NY 12603
|
2,772 sq. feet
|
2 baths 3 beds |
show details | |

|
Check over 1 million property listings on Foreclosure.com!
|
browse all offers | |||

Latest news about housing in Poughkeepsie, NY collected exclusively by city-data.com from local newspapers, TV, and radio stations


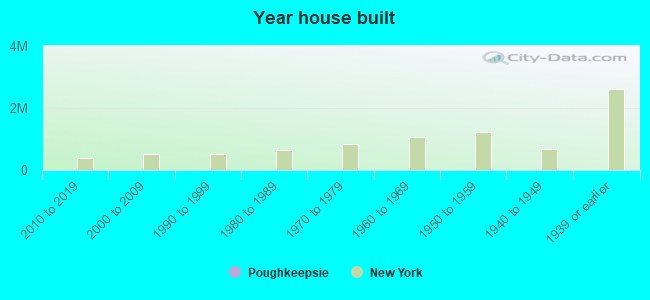
Median year apartment built: 1950
Household type by relationship:
Households: 31,832- Male householders: 5,418 (2,364 living alone), Female householders: 8,221 (3,370 living alone)
3,610 spouses (3,332 opposite-sex spouses), 1,100 unmarried partners, (1,048 opposite-sex unmarried partners), 8,854 children (8,456 natural, 209 adopted, 187 stepchildren), 966 grandchildren, 350 brothers or sisters, 213 parents, 29 foster children, 997 other relatives, 1,154 non-relatives
- In group quarters: 915
Size of family households: 2,927 2-persons, 1,718 3-persons, 1,241 4-persons, 684 5-persons, 119 6-persons, 18 7-or-more-persons.
Size of nonfamily households: 6,056 1-person, 1,009 2-persons, 164 3-persons, 132 4-persons, 14 5-persons.
2,118 married couples with children.
2,847 single-parent households (174 men, 2,673 women).
82.4% of residents of Poughkeepsie speak English at home.
12.6% of residents speak Spanish at home (47% speak English very well, 13% speak English well, 33% speak English not well, 8% don't speak English at all).
2.8% of residents speak other Indo-European language at home (64% speak English very well, 30% speak English well, 6% speak English not well).
1.1% of residents speak Asian or Pacific Island language at home (71% speak English very well, 23% speak English well, 6% speak English not well).
1.0% of residents speak other language at home (83% speak English very well, 16% speak English well, 1% speak English not well).
Foreign born population: 5,456 (17.1%)
(50.7% of them are naturalized citizens)
| Here: | 6.3 |
| State: | 6.3 |
| Here: | 4.0 |
| State: | 3.8 |
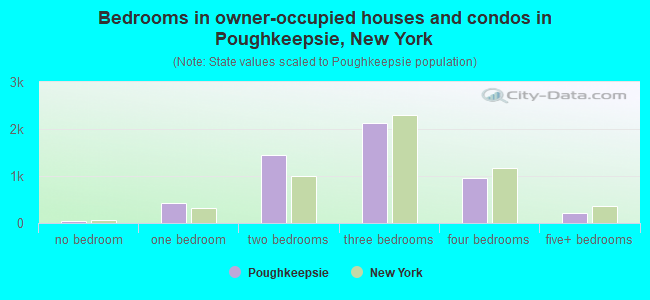
- Bedrooms in owner-occupied houses and condos in Poughkeepsie, New York
- 45no bedroom
- 4311 bedroom
- 1,4542 bedrooms
- 2,1283 bedrooms
- 9594 bedrooms
- 2085+ bedrooms
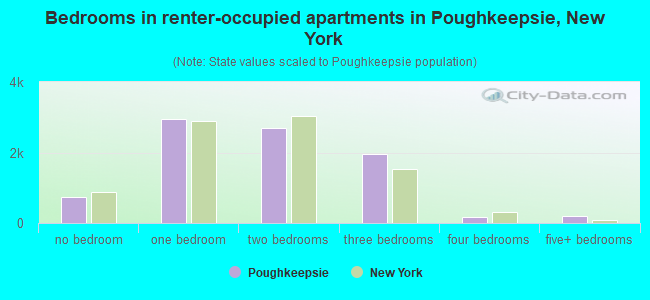
- Bedrooms in renter-occupied apartments in Poughkeepsie, New York
- 741no bedroom
- 2,9481 bedroom
- 2,6832 bedrooms
- 1,9713 bedrooms
- 1784 bedrooms
- 2085+ bedrooms
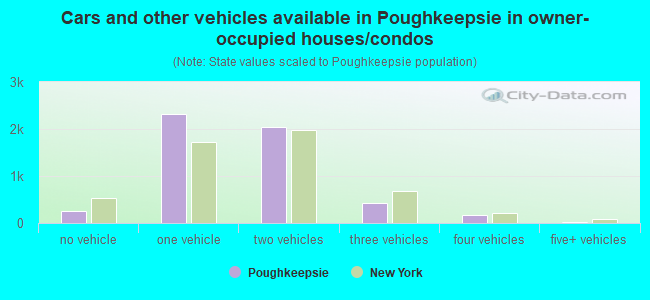
- Cars and other vehicles available in Poughkeepsie in owner-occupied houses/condos
- 253no vehicle
- 2,3221 vehicle
- 2,0372 vehicles
- 4153 vehicles
- 1804 vehicles
- 205+ vehicles
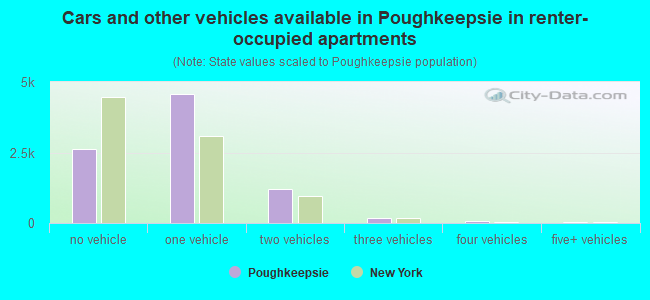
- Cars and other vehicles available in Poughkeepsie in renter-occupied apartments
- 2,637no vehicle
- 4,5621 vehicle
- 1,2202 vehicles
- 1733 vehicles
- 854 vehicles
- 535+ vehicles
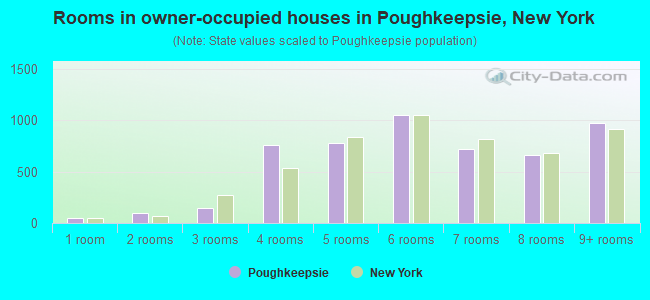
- Rooms in owner-occupied houses in Poughkeepsie, New York
- 451 room
- 932 rooms
- 1433 rooms
- 7634 rooms
- 7775 rooms
- 1,0516 rooms
- 7197 rooms
- 6588 rooms
- 9759+ rooms
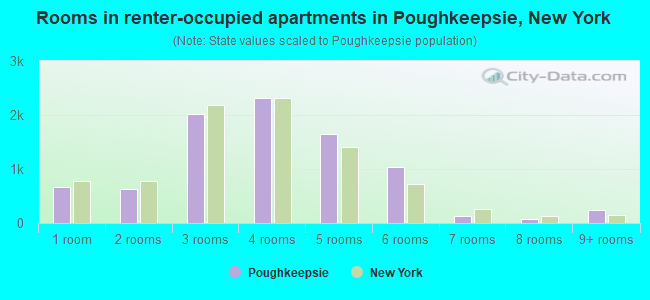
- Rooms in renter-occupied apartments in Poughkeepsie, New York
- 6651 room
- 6372 rooms
- 2,0133 rooms
- 2,3114 rooms
- 1,6395 rooms
- 1,0296 rooms
- 1237 rooms
- 808 rooms
- 2339+ rooms
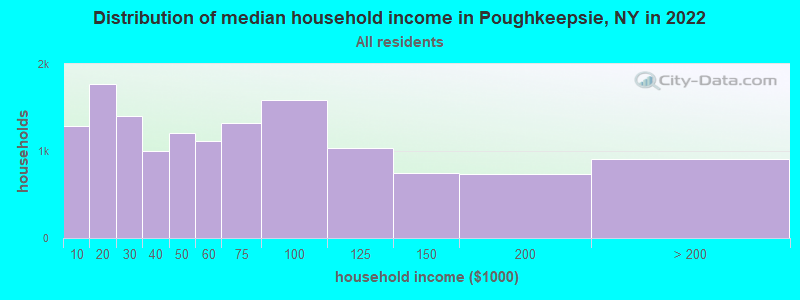
Poughkeepsie, NY household income distribution

- 1,287Less than $10,000
- 1,766$10,000 to $19,999
- 1,398$20,000 to $29,999
- 996$30,000 to $39,999
- 1,205$40,000 to $49,999
- 1,113$50,000 to $59,999
- 1,320$60,000 to $74,999
- 1,587$75,000 to $99,999
- 1,031$100,000 to $124,999
- 745$125,000 to $149,999
- 736$150,000 to $199,999
- 910$200,000 or more
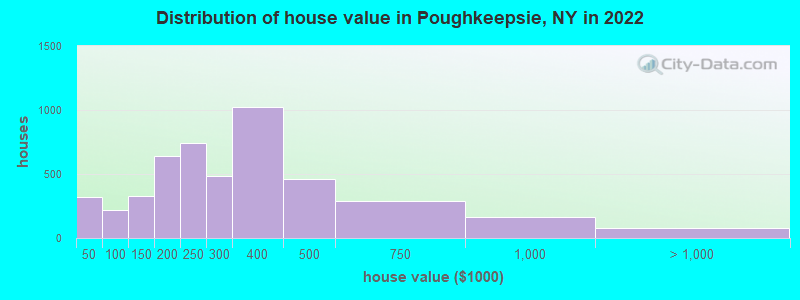
Home value of owner - occupied houses in 2022 in Poughkeepsie, NY
-
- 87Less than $10,000
- 61$10,000 to $14,999
- 143$15,000 to $19,999
- 21$20,000 to $24,999
- 7$30,000 to $34,999
- 31$50,000 to $59,999
- 50$60,000 to $69,999
- 12$70,000 to $79,999
- 75$80,000 to $89,999
- 50$90,000 to $99,999
- 114$100,000 to $124,999
- 215$125,000 to $149,999
- 357$150,000 to $174,999
- 284$175,000 to $199,999
- 743$200,000 to $249,999
- 487$250,000 to $299,999
- 1,024$300,000 to $399,999
- 460$400,000 to $499,999
- 288$500,000 to $749,999
- 165$750,000 to $999,999
- 65$1,000,000 to $1,499,999
- 14$1,500,000 to $1,999,999
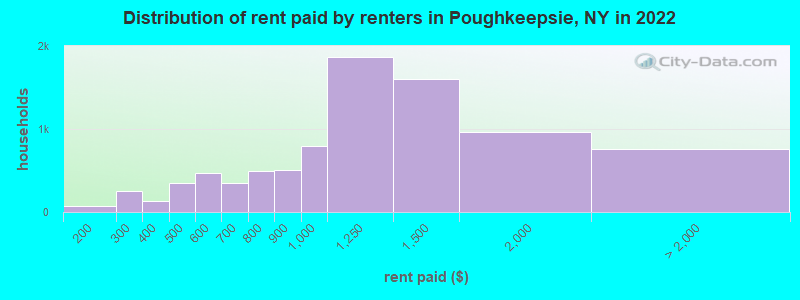
Rent paid by renters in 2022 in Poughkeepsie, NY
-
- 11Less than $100
- 10$100 to $149
- 68$150 to $199
- 74$200 to $249
- 177$250 to $299
- 43$300 to $349
- 88$350 to $399
- 320$400 to $449
- 27$450 to $499
- 61$500 to $549
- 403$550 to $599
- 62$600 to $649
- 290$650 to $699
- 223$700 to $749
- 274$750 to $799
- 503$800 to $899
- 792$900 to $999
- 1,865$1,000 to $1,249
- 1,607$1,250 to $1,499
- 961$1,500 to $1,999
- 373$2,000 to $2,499
- 11$2,500 to $2,999
- 253$3,000 to $3,499
- 23$3,500 or more
- 96No cash rent
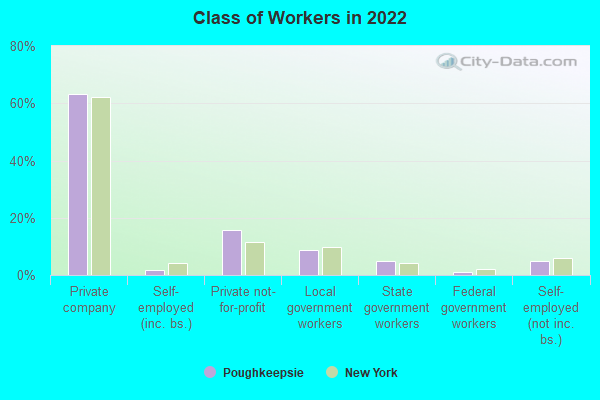
Percentage of workers working in this county: 79.9%
Number of people working at home: 1,503 (10.0% of all workers)
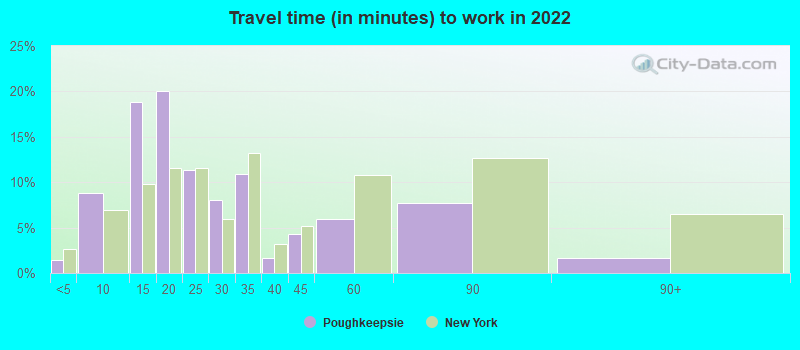
Travel time to work (commute)
- Less than 5 minutes: 179
- 5 to 9 minutes: 2,187
- 10 to 14 minutes: 3,057
- 15 to 19 minutes: 1,990
- 20 to 24 minutes: 1,614
- 25 to 29 minutes: 819
- 30 to 34 minutes: 1,296
- 35 to 39 minutes: 233
- 40 to 44 minutes: 301
- 45 to 59 minutes: 535
- 60 to 89 minutes: 963
- 90 or more minutes: 368

Means of transportation to work:
- Drove a car alone: 14,195 (74.1%)
- Carpooled: 1,779 (9.3%)
- Bus: 117 (0.6%)
- Long-distance train or commuter rail: 49 (0.3%)
- Taxi: 218 (1.1%)
- Bicycle: 94 (0.5%)
- Walked: 666 (3.5%)
- Worked at home: 1,503 (7.8%)
- Unemployment by race in 2022
- Unemployment rate for White non-Hispanic residents
- 2.9%Males
- 4.3%Females
- Unemployment rate for Black residents
- 6.7%Males
- 3.6%Females
- Unemployment rate for American Indian and Alaska Native residents
- 8.7%Males
- Unemployment rate for Asian residents
- 18.3%Females
- Unemployment rate for other race residents
- 8.7%Males
- 6.9%Females
- Unemployment rate for two or more race residents
- 2.3%Males
- 4.8%Females
- Unemployment rate for Hispanic or Latino residents
- 8.3%Males
- 12.0%Females
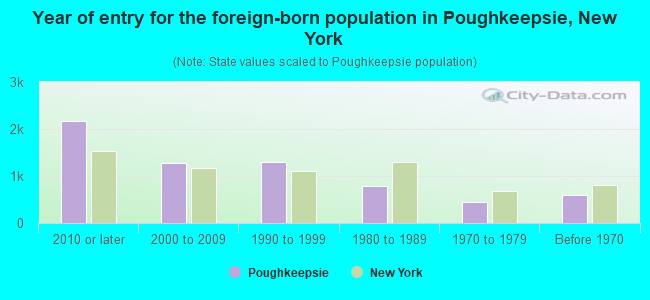
- Year of entry for the foreign-born population in Poughkeepsie, New York
- 2,1632010 or later
- 1,2822000 to 2009
- 1,2931990 to 1999
- 7971980 to 1989
- 4491970 to 1979
- 605Before 1970
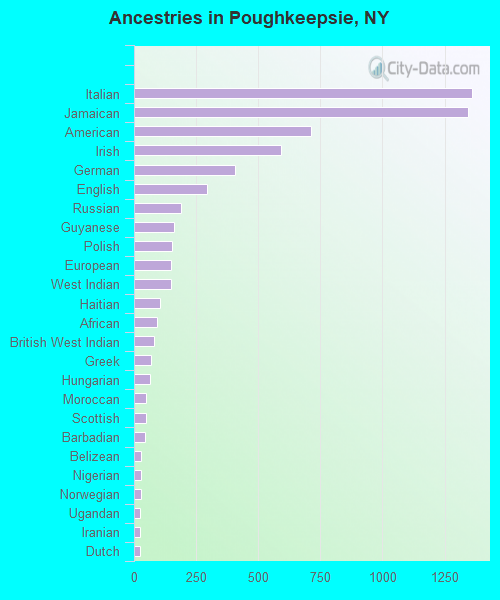
First ancestries reported:
- Italian: 1,361 (8.6%)
- Jamaican: 1,345 (8.5%)
- American: 713 (4.5%)
- Irish: 593 (3.8%)
- German: 405 (2.6%)
- English: 292 (1.9%)
- Russian: 190 (1.2%)
- Guyanese: 162 (1.0%)
- Polish: 153 (1.0%)
- European: 150 (1.0%)
- West Indian: 148 (0.9%)
- Haitian: 106 (0.7%)
- African: 92 (0.6%)
- British West Indian: 79 (0.5%)
- Greek: 68 (0.4%)
- Hungarian: 65 (0.4%)
- Moroccan: 50 (0.3%)
- Scottish: 47 (0.3%)
- Barbadian: 43 (0.3%)
- Belizean: 29 (0.2%)
- Nigerian: 28 (0.2%)
- Norwegian: 27 (0.2%)
- Ugandan: 26 (0.2%)
- Iranian: 24 (0.2%)
- Dutch: 24 (0.2%)
- Eastern European: 24 (0.2%)
- Ukrainian: 23 (0.1%)
- Austrian: 22 (0.1%)
- Lebanese: 20 (0.1%)
- Danish: 16 (0.1%)
- Romanian: 14 (0.09%)
- Northern European: 13 (0.08%)
- South African: 11 (0.07%)
- French: 8 (0.05%)
- Slovak: 7 (0.04%)
- Armenian: 6 (0.04%)
- Israeli: 6 (0.04%)
- British: 6 (0.04%)
- Canadian: 5 (0.03%)
- Slovene: 4 (0.03%)
- Estonian: 4 (0.03%)
- Swedish: 4 (0.03%)
- Czech: 4 (0.03%)
- Trinidadian and Tobagonian: 4 (0.03%)
Most common places of birth for foreign-born residents (%):
| Poughkeepsie: | 32.1% (1,588) |
| New York: | 5.0% (227,557) |
| Poughkeepsie: | 28.7% (1,420) |
| New York: | 4.8% (214,559) |
| Poughkeepsie: | 4.1% (205) |
| New York: | 1.4% (61,245) |
| Poughkeepsie: | 3.6% (176) |
| New York: | 11.1% (501,040) |
| Poughkeepsie: | 2.6% (127) |
| New York: | 0.9% (38,713) |
| Poughkeepsie: | 2.4% (118) |
| New York: | 0.2% (8,613) |
| Poughkeepsie: | 2.1% (105) |
| New York: | 1.4% (65,102) |
| Poughkeepsie: | 2.1% (102) |
| New York: | 2.8% (126,936) |
| Poughkeepsie: | 2.0% (97) |
| New York: | 3.8% (172,129) |
| Poughkeepsie: | 1.6% (78) |
| New York: | 2.0% (91,070) |
Place of birth for U.S.-born residents:
- This state: 21,030
- Other state: 4,476
- Northeast: 1,424
- Midwest: 770
- South: 1,530
- West: 759
88.9% of Poughkeepsie residents lived in the same house 1 years ago.
Out of people who lived in different houses, 27.5% lived in this county.
Out of people who lived in different counties, 81.9% lived in New York.
| Poughkeepsie: | 88.9% |
| State average: | 89.6% |
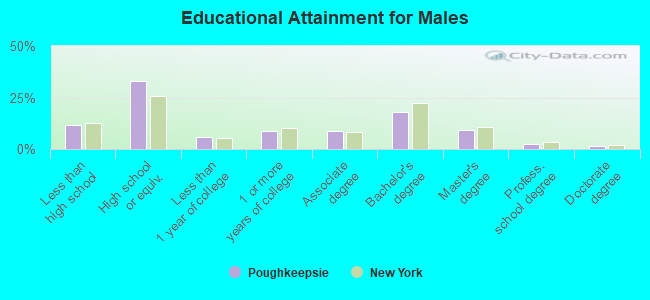
Education attainment for males 25 years and older:
- No schooling: 95
- Nursery to 4th grade: 90
- 5th and 6th grade: 126
- 7th and 8th grade: 167
- 9th grade: 259
- 10th grade: 45
- 11th grade: 238
- 12th grade, no diploma: 144
- High school graduate (or equivalency): 3,273
- Less than 1 year of college: 597
- Some college more than 1 year, no degree: 882
- Associate degree: 888
- Bachelor's degree: 1,786
- Master's degree: 931
- Professional school degree: 252
- Doctorate degree: 148
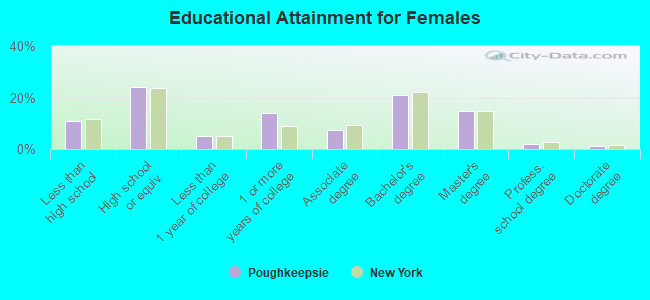
Education attainment for females 25 years and older:
- No schooling: 70
- Nursery to 4th grade: 52
- 5th and 6th grade: 47
- 7th and 8th grade: 114
- 9th grade: 142
- 10th grade: 166
- 11th grade: 318
- 12th grade, no diploma: 453
- High school graduate (or equivalency): 3,009
- Less than 1 year of college: 609
- Some college more than 1 year, no degree: 1,768
- Associate degree: 930
- Bachelor's degree: 2,610
- Master's degree: 1,851
- Professional school degree: 253
- Doctorate degree: 147
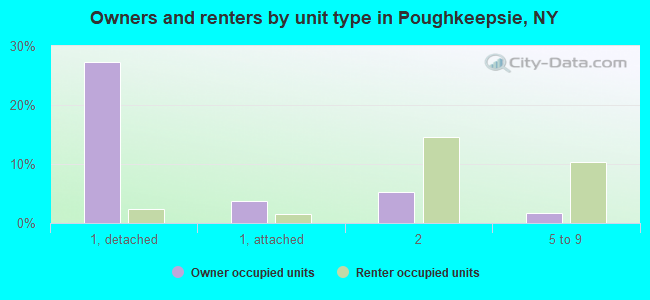
Housing units in structures:
- One, detached: 3,715
- One, attached: 1,173
- Two: 2,669
- 3 or 4: 2,384
- 5 to 9: 1,222
- 10 to 19: 835
- 20 to 49: 737
- 50 or more: 1,877
- Mobile homes: 18
- Boats, RVs, vans, etc.: 20
Housing units lacking complete kitchen facilities in 2022: 1.4%
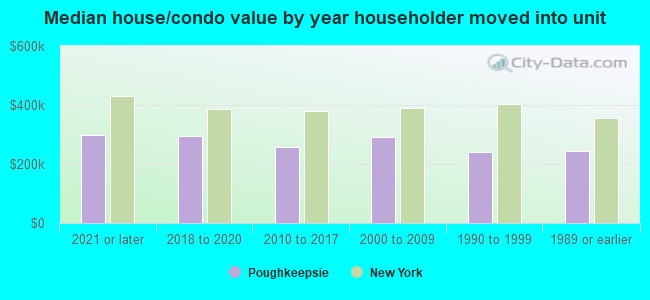
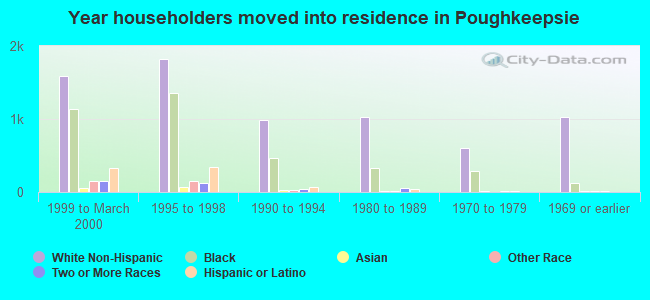
House/condo owner moved in on average 14 years ago
Renter moved in on average 3 years ago
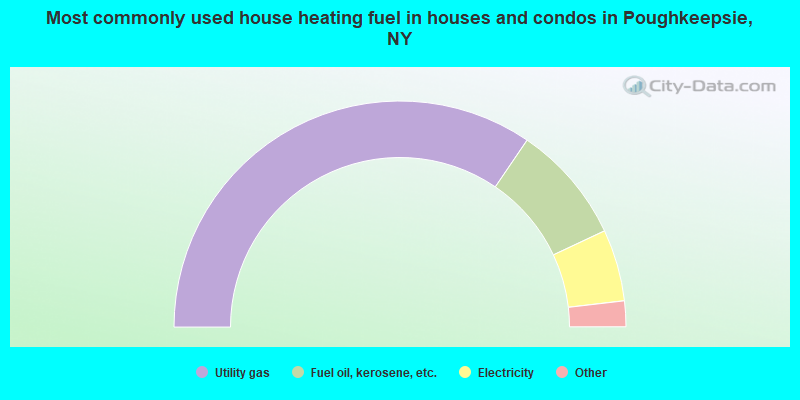
- 69.1%Utility gas
- 17.0%Fuel oil, kerosene, etc.
- 10.3%Electricity
- 2.1%Bottled, tank, or LP gas
- 0.8%Solar energy
- 0.4%Wood
- 0.3%Other fuel
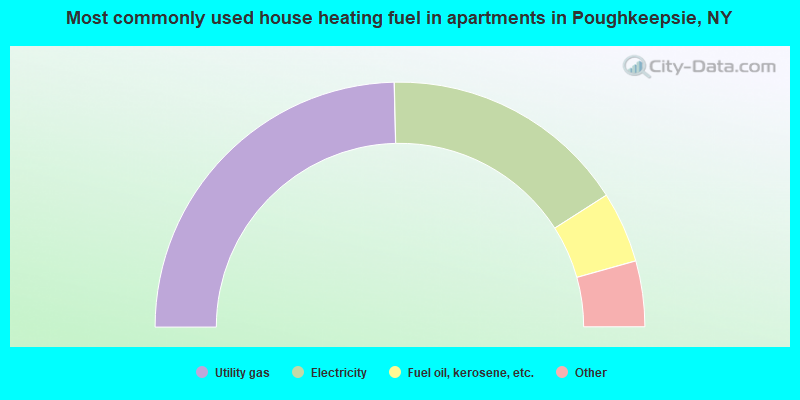
- 49.3%Utility gas
- 32.7%Electricity
- 9.4%Fuel oil, kerosene, etc.
- 4.0%No fuel used
- 3.3%Bottled, tank, or LP gas
- 1.4%Other fuel
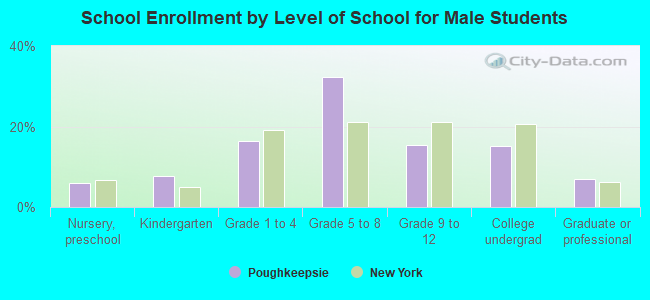
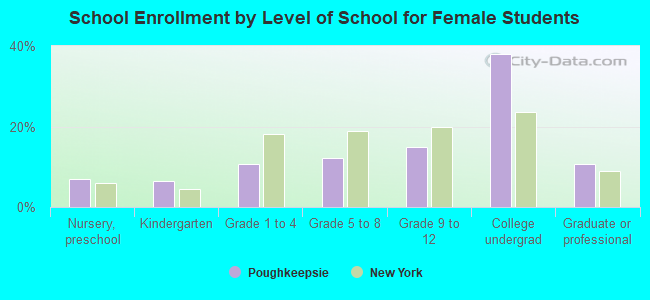
Private vs. public school enrollment:
| Here: | 14.8% |
| New York: | 15.6% |
| Here: | 19.6% |
| New York: | 15.0% |
| Here: | 49.9% |
| New York: | 39.2% |