Princeton, NC (North Carolina) Houses and Residents
| Princeton: | $141,483 |
| North Carolina: | $280,600 |
Mean price in 2022:
Detached houses: $175,624
Here: $175,624 State: $375,326 Mobile homes: $22,084
Here: $22,084 State: $124,933
Total population: 1,259 (Urban population: 0, Rural population: 1,093 (8 farm, 1,085 nonfarm))
Houses: 754 (639 occupied: 284 owner occupied, 358 renter occupied)
| % of renters here: | 56% |
| State: | 33% |
Housing density: 1,103 houses/condos per square mile
Median price asked for vacant for-sale houses and condos in 2022 in this county: $338,491.
Median contract rent in 2022: $637 (lower quartile is $403, upper quartile is $870)
Median rent asked for vacant for-rent units in 2022: $847
Median gross rent in Princeton, NC in 2022: $734
Housing units in Princeton with a mortgage: 180 (6 second mortgage, 0 home equity loan, 6 both second mortgage and home equity loan)
Houses without a mortgage: 17
Median household income for houses/condos with a mortgage: $91,688
Median household income for apartments without a mortgage: $49,041
Median monthly housing costs: $759
Compare current foreclosures near Princeton, NC:
| Photo | Address | Area | Beds / Baths | Price | Details |
|---|---|---|---|---|---|

|
#1
Lisa Dr
Princeton, NC 27569
|
1,308 sq. feet
|
2 baths 3 beds |
show details | |

|
#2
Lauren Ln
Princeton, NC 27569
|
2,016 sq. feet
|
2 baths 3 beds |
show details | |

|
#3
Eagles Crest Ln
Princeton, NC 27569
|
1,769 sq. feet
|
2 baths 3 beds |
show details | |

|
#4
Evans Rd
Princeton, NC 27569
|
- sq. feet
|
- baths - beds |
show details | |

|
#5
Whitley Church Rd
Princeton, NC 27569
|
- sq. feet
|
- baths - beds |
show details | |

|
#6
Smith St
Princeton, NC 27569
|
- sq. feet
|
- baths - beds |
show details | |

|
#7
Marsala Dr
Princeton, NC 27569
|
- sq. feet
|
- baths - beds |
show details | |

|
#8
Croom Dr
Goldsboro, NC 27530
|
1,328 sq. feet
|
1 baths 3 beds |
$27,500
|
show details |

|
#9
Williamson Farm Rd
Dudley, NC 28333
|
- sq. feet
|
1 baths 2 beds |
$105,000
|
show details |

|
#10
Eli Olive Rd
Smithfield, NC 27577
|
1,991 sq. feet
|
2 baths 3 beds |
show details |
| Photo | Address | Area | Beds / Baths | Price | Details |
|---|---|---|---|---|---|

|
#11
Fox Dr
Dudley, NC 28333
|
1,024 sq. feet
|
1 baths 3 beds |
show details | |

|
#12
Campground Rd
Selma, NC 27576
|
2,108 sq. feet
|
2 baths 3 beds |
show details | |

|
#13
Autumn Winds Dr
Goldsboro, NC 27530
|
- sq. feet
|
2 baths 3 beds |
show details | |

|
#14
Bunche Dr
Goldsboro, NC 27530
|
1,104 sq. feet
|
2 baths 3 beds |
show details | |

|
#15
Stone Cutter Dr
Pikeville, NC 27863
|
1,512 sq. feet
|
2 baths 3 beds |
show details | |

|
#16
E Elm St
Goldsboro, NC 27530
|
1,155 sq. feet
|
1 baths 3 beds |
show details | |

|
#17
Brogden St
Dudley, NC 28333
|
1,107 sq. feet
|
1 baths 3 beds |
show details | |

|
#18
Bilston Dr
Clayton, NC 27520
|
2,990 sq. feet
|
3 baths 5 beds |
show details | |

|
#19
Tonya Dr
Goldsboro, NC 27534
|
2,174 sq. feet
|
2 baths 3 beds |
show details | |

|
#20
Little Rock Church Rd
Lucama, NC 27851
|
1,025 sq. feet
|
1 baths 3 beds |
show details |
| Photo | Address | Area | Beds / Baths | Price | Details |
|---|---|---|---|---|---|

|
#21
Jacobs Ridge Dr
Goldsboro, NC 27534
|
2,200 sq. feet
|
2 baths 3 beds |
show details | |

|
#22
Wesley Dr
Goldsboro, NC 27534
|
1,444 sq. feet
|
2 baths 3 beds |
show details | |

|
#23
Buffalo Rd
Selma, NC 27576
|
2,122 sq. feet
|
2 baths 3 beds |
show details | |

|
#24
S Best St
Goldsboro, NC 27530
|
2,145 sq. feet
|
2 baths 3 beds |
show details | |

|
#25
Powell Hooks Rd
Lucama, NC 27851
|
2,186 sq. feet
|
2 baths 3 beds |
show details | |

|
#26
Brookside Dr
Smithfield, NC 27577
|
1,699 sq. feet
|
2 baths 3 beds |
show details | |

|
#27
Beech St
Goldsboro, NC 27530
|
1,404 sq. feet
|
1 baths 3 beds |
show details | |

|
#28
Clear Water Dr
Smithfield, NC 27577
|
1,292 sq. feet
|
2 baths 3 beds |
show details | |

|
#29
Bilston Dr
Clayton, NC 27520
|
1,942 sq. feet
|
2 baths 3 beds |
show details | |

|
#30
Kornegay Dr
Dudley, NC 28333
|
2,108 sq. feet
|
2 baths 3 beds |
show details |
| Photo | Address | Area | Beds / Baths | Price | Details |
|---|---|---|---|---|---|

|
#31
Judy Pl
Goldsboro, NC 27530
|
1,200 sq. feet
|
2 baths 3 beds |
show details | |

|
#32
N Lakeside Dr
Smithfield, NC 27577
|
1,763 sq. feet
|
2 baths 3 beds |
show details | |

|
#33
North Dr
Goldsboro, NC 27534
|
1,144 sq. feet
|
1 baths 3 beds |
show details | |

|
#34
Whitley Dr
Smithfield, NC 27577
|
1,565 sq. feet
|
1 baths 3 beds |
show details | |

|
#35
N Wilson St
Fremont, NC 27830
|
2,012 sq. feet
|
1 baths 3 beds |
show details | |

|
#36
Glenhaven Ln
Goldsboro, NC 27530
|
2,026 sq. feet
|
2 baths 3 beds |
show details | |

|
#37
Riverdale Cir
Smithfield, NC 27577
|
1,212 sq. feet
|
2 baths 3 beds |
show details | |

|
#38
Falcon Dr
Pikeville, NC 27863
|
2 sq. feet
|
2 baths 3 beds |
show details | |

|
#39
Sandhill Dr
Goldsboro, NC 27530
|
1,664 sq. feet
|
2 baths 3 beds |
show details | |

|
#40
Decoy Dr
Pikeville, NC 27863
|
1,848 sq. feet
|
2 baths 3 beds |
show details |
| Photo | Address | Area | Beds / Baths | Price | Details |
|---|---|---|---|---|---|

|
#41
S Crescent Dr
Smithfield, NC 27577
|
1,040 sq. feet
|
1 baths 3 beds |
show details | |

|
#42
Herbert St
Goldsboro, NC 27530
|
1,234 sq. feet
|
1 baths 3 beds |
show details | |

|
#43
S 1st St
Smithfield, NC 27577
|
1,291 sq. feet
|
1 baths 3 beds |
show details | |

|
#44
Hare Rd
Goldsboro, NC 27534
|
1,440 sq. feet
|
2 baths 3 beds |
show details | |

|
#45
Ogburn Rd
Smithfield, NC 27577
|
1,456 sq. feet
|
2 baths 3 beds |
show details | |

|
#46
Bartlett Rd NE
Pikeville, NC 27863
|
1,560 sq. feet
|
2 baths 3 beds |
show details | |

|
#47
Antioch Rd
Goldsboro, NC 27534
|
1,782 sq. feet
|
2 baths 3 beds |
show details | |

|
#48
Sedgefield Dr
Goldsboro, NC 27534
|
1,352 sq. feet
|
2 baths 3 beds |
show details | |

|
#49
Davis Mill Rd
Fremont, NC 27830
|
2,732 sq. feet
|
3 baths 3 beds |
show details | |

|
Check over 1 million property listings on Foreclosure.com!
|
browse all offers | |||

Latest news about housing in Princeton, NC collected exclusively by city-data.com from local newspapers, TV, and radio stations

 | Raleigh: Recent Move and Home Purchase (28 replies) |
| I-42 and I-87 (676 replies) |
| Proposed I-795 Quad East loop (719 replies) |
| Goldsboro is growing again! (1077 replies) |
| I'm shocked by the low real estate prices I'm seeing! (10 replies) |
| Toyota-Mazda Plant Coming to the Triad? (203 replies) |

Median year apartment built: 1985
Household type by relationship:
Households: 1,576- Male householders: 263 (86 living alone), Female householders: 373 (155 living alone)
231 spouses (231 opposite-sex spouses), 41 unmarried partners, (41 opposite-sex unmarried partners), 577 children (561 natural, 3 adopted, 12 stepchildren), 24 grandchildren, 3 brothers or sisters, 10 parents, 0 foster children, 27 other relatives, 22 non-relatives
Size of family households: 168 2-persons, 37 3-persons, 125 4-persons, 27 5-persons, 13 6-persons, 2 7-or-more-persons.
Size of nonfamily households: 210 1-person, 43 2-persons.
320 married couples with children.
111 single-parent households (21 men, 90 women).
80.5% of residents of Princeton speak English at home.
18.5% of residents speak Spanish at home (73% speak English very well, 27% speak English well).
0.3% of residents speak other Indo-European language at home (100% speak English very well).
0.1% of residents speak Asian or Pacific Island language at home (100% speak English very well).
Foreign born population: 153 (9.7%)
(0.7% of them are naturalized citizens)
| Here: | 5.7 |
| State: | 6.4 |
| Here: | 4.8 |
| State: | 4.4 |

- Bedrooms in owner-occupied houses and condos in Princeton, North Carolina
- 0no bedroom
- 01 bedroom
- 882 bedrooms
- 1733 bedrooms
- 224 bedrooms
- 25+ bedrooms

- Bedrooms in renter-occupied apartments in Princeton, North Carolina
- 0no bedroom
- 401 bedroom
- 2222 bedrooms
- 733 bedrooms
- 244 bedrooms
- 05+ bedrooms

- Cars and other vehicles available in Princeton in owner-occupied houses/condos
- 3no vehicle
- 761 vehicle
- 902 vehicles
- 973 vehicles
- 104 vehicles
- 95+ vehicles

- Cars and other vehicles available in Princeton in renter-occupied apartments
- 76no vehicle
- 1331 vehicle
- 1162 vehicles
- 223 vehicles
- 124 vehicles
- 05+ vehicles

- Rooms in owner-occupied houses in Princeton, North Carolina
- 01 room
- 02 rooms
- 03 rooms
- 694 rooms
- 665 rooms
- 506 rooms
- 347 rooms
- 278 rooms
- 399+ rooms

- Rooms in renter-occupied apartments in Princeton, North Carolina
- 01 room
- 02 rooms
- 113 rooms
- 1694 rooms
- 1045 rooms
- 376 rooms
- 297 rooms
- 98 rooms
- 09+ rooms


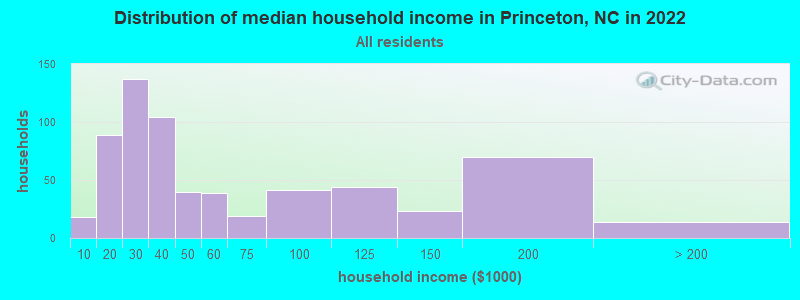
Princeton, NC household income distribution

- 18Less than $10,000
- 89$10,000 to $19,999
- 137$20,000 to $29,999
- 104$30,000 to $39,999
- 40$40,000 to $49,999
- 39$50,000 to $59,999
- 19$60,000 to $74,999
- 41$75,000 to $99,999
- 44$100,000 to $124,999
- 23$125,000 to $149,999
- 70$150,000 to $199,999
- 14$200,000 or more
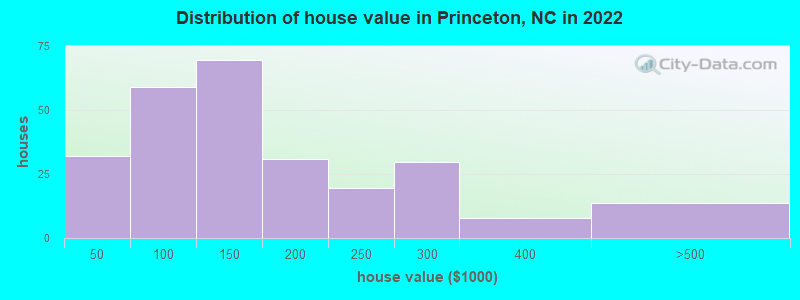
Home value of owner - occupied houses in 2022 in Princeton, NC
-
- 3$10,000 to $14,999
- 5$15,000 to $19,999
- 18$20,000 to $24,999
- 5$40,000 to $49,999
- 14$50,000 to $59,999
- 10$60,000 to $69,999
- 26$80,000 to $89,999
- 1$90,000 to $99,999
- 69$100,000 to $124,999
- 10$150,000 to $174,999
- 20$175,000 to $199,999
- 19$200,000 to $249,999
- 29$250,000 to $299,999
- 7$300,000 to $399,999
- 13$400,000 to $499,999
Rent paid by renters in 2022 in Princeton, NC
-
- 25Less than $100
- 17$150 to $199
- 4$200 to $249
- 67$300 to $349
- 9$450 to $499
- 41$500 to $549
- 17$550 to $599
- 23$600 to $649
- 16$650 to $699
- 2$700 to $749
- 2$750 to $799
- 36$800 to $899
- 11$900 to $999
- 4$1,000 to $1,249
- 18$1,500 to $1,999
- 17No cash rent


Percentage of workers working in this county: 50.7%
Number of people working at home: 45 (7.8% of all workers)
Travel time to work (commute)
- Less than 5 minutes: 25
- 5 to 9 minutes: 44
- 10 to 14 minutes: 8
- 15 to 19 minutes: 67
- 20 to 24 minutes: 149
- 25 to 29 minutes: 26
- 30 to 34 minutes: 75
- 35 to 39 minutes: 7
- 40 to 44 minutes: 6
- 45 to 59 minutes: 66
- 60 to 89 minutes: 69
- 90 or more minutes: 0
Means of transportation to work:
- Drove a car alone: 385 (84.6%)
- Carpooled: 55 (12.1%)
- Taxi: 2 (0.4%)
- Walked: 2 (0.4%)
- Other means: 4 (0.9%)
- Worked at home: 7 (1.5%)

- Unemployment by race in 2022
- Unemployment rate for White non-Hispanic residents
- 1.7%Males
- 1.4%Females
- Unemployment rate for American Indian and Alaska Native residents
- 100.0%Females

- Year of entry for the foreign-born population in Princeton, North Carolina
- 72010 or later
- 1102000 to 2009
- 61990 to 1999
- 01980 to 1989
- 01970 to 1979
- 4Before 1970

First ancestries reported:
- American: 115 (15.2%)
- English: 91 (12.0%)
- Irish: 79 (10.4%)
- European: 22 (2.9%)
- German: 8 (1.1%)
- Italian: 7 (0.9%)
- French Canadian: 6 (0.8%)
- Polish: 5 (0.7%)
- Scottish: 4 (0.5%)
- Austrian: 2 (0.3%)
- British: 2 (0.3%)
- Scotch-Irish: 2 (0.3%)
Most common places of birth for foreign-born residents (%):
| Princeton: | 45.7% (63) |
| North Carolina: | 3.8% (33,379) |
| Princeton: | 37.7% (52) |
| North Carolina: | 24.7% (214,776) |
| Princeton: | 10.1% (14) |
| North Carolina: | 4.7% (40,707) |
Place of birth for U.S.-born residents:
- This state: 1,049
- Other state: 380
- Northeast: 136
- Midwest: 57
- South: 162
- West: 22
88.3% of Princeton residents lived in the same house 1 years ago.
Out of people who lived in different houses, 28.3% lived in this county.
Out of people who lived in different counties, 100.0% lived in North Carolina.
| Princeton: | 88.3% |
| State average: | 87.3% |
Education attainment for males 25 years and older:
- No schooling: 2
- Nursery to 4th grade: 0
- 5th and 6th grade: 0
- 7th and 8th grade: 0
- 9th grade: 64
- 10th grade: 12
- 11th grade: 8
- 12th grade, no diploma: 8
- High school graduate (or equivalency): 109
- Less than 1 year of college: 6
- Some college more than 1 year, no degree: 46
- Associate degree: 80
- Bachelor's degree: 26
- Master's degree: 25
- Professional school degree: 6
- Doctorate degree: 0

Education attainment for females 25 years and older:
- No schooling: 2
- Nursery to 4th grade: 0
- 5th and 6th grade: 4
- 7th and 8th grade: 0
- 9th grade: 5
- 10th grade: 77
- 11th grade: 2
- 12th grade, no diploma: 3
- High school graduate (or equivalency): 160
- Less than 1 year of college: 24
- Some college more than 1 year, no degree: 136
- Associate degree: 49
- Bachelor's degree: 39
- Master's degree: 45
- Professional school degree: 2
- Doctorate degree: 1


Housing units in structures:
- One, detached: 456
- One, attached: 9
- Two: 101
- 3 or 4: 74
- 10 to 19: 7
- Mobile homes: 105
Median worth of mobile homes: $25,857
Housing units lacking complete kitchen facilities in 2022: 6.4%
House/condo owner moved in on average 15 years ago
Renter moved in on average 3 years ago

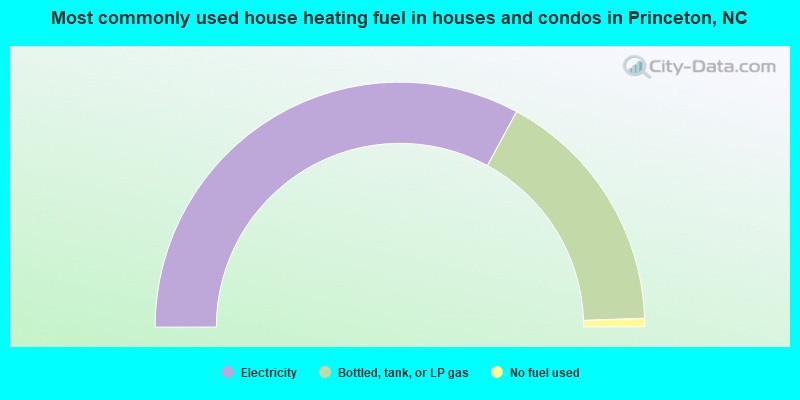
- 65.8%Electricity
- 33.1%Bottled, tank, or LP gas
- 1.1%No fuel used
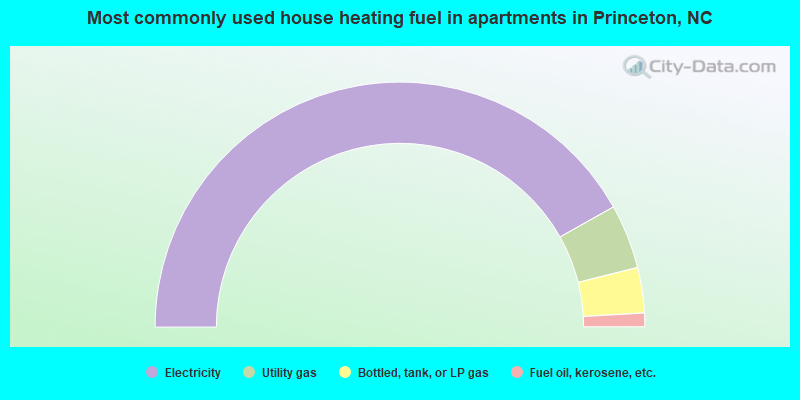
- 83.7%Electricity
- 8.5%Utility gas
- 6.0%Bottled, tank, or LP gas
- 1.8%Fuel oil, kerosene, etc.
Private vs. public school enrollment:
| Here: | 3.7% |
| North Carolina: | 13.8% |
| Here: | 0.0% |
| North Carolina: | 11.9% |
| Here: | 12.3% |
| North Carolina: | 19.3% |


