Housing density: 165 houses/condos per square mile
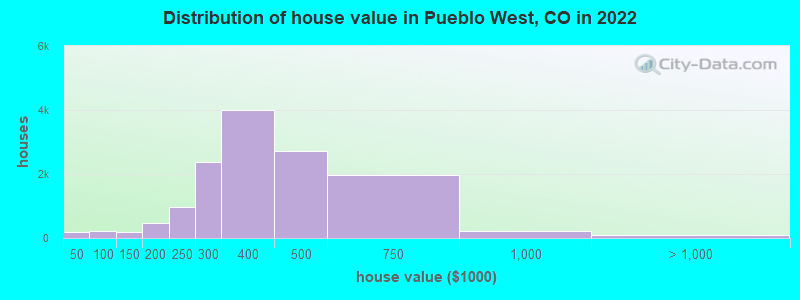
Median price asked for vacant for-sale houses and condos in 2022: $157,223.
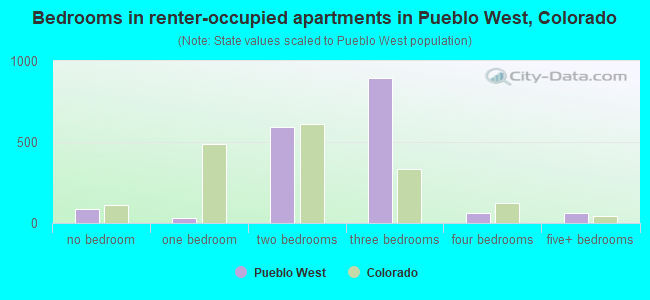
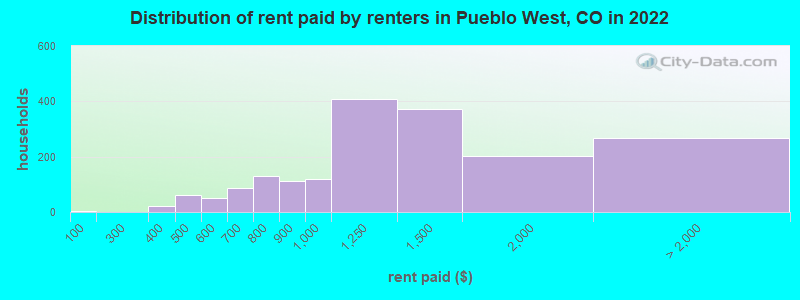
Median contract rent in 2022: $1,085 (lower quartile is $863, upper quartile is $1,515)
Median rent asked for vacant for-rent units in 2022: $3,396
Median gross rent in Pueblo West, CO in 2022: $1,275
Housing units in Pueblo West with a mortgage: 7,728 (591 second mortgage, 14 home equity loan, 629 both second mortgage and home equity loan) Houses without a mortgage: 58
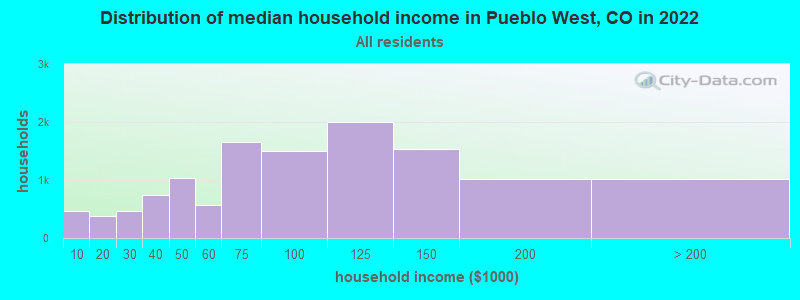
Median household income for houses/condos with a mortgage: $101,997
Median household income for apartments without a mortgage: $77,320
Median monthly housing costs: $1,493
Compare current foreclosures near Pueblo West, CO:
Size of family households: 3,964 2-persons, 1,697 3-persons, 1,848 4-persons, 851 5-persons, 568 6-persons, 402 7-or-more-persons.
Size of nonfamily households: 2,166 1-person, 705 2-persons.
6,132 married couples with children.
1,435 single-parent households (702 men, 733 women).
92.7% of residents of Pueblo West speak English at home.
6.1% of residents speak Spanish at home (71% speak English very well, 20% speak English well, 8% speak English not well, 1% don't speak English at all).
0.9% of residents speak other Indo-European language at home (100% speak English very well).
0.4% of residents speak Asian or Pacific Island language at home (73% speak English very well, 22% speak English well, 5% speak English not well).
Foreign born population: 1,464 (4.2%)
(55.3% of them are naturalized citizens)
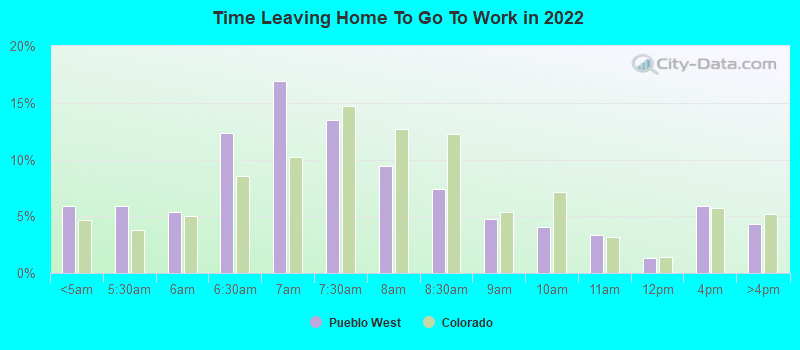
Percentage of workers working in this county: 82.3% Number of people working at home: 1,603 (9.8% of all workers)
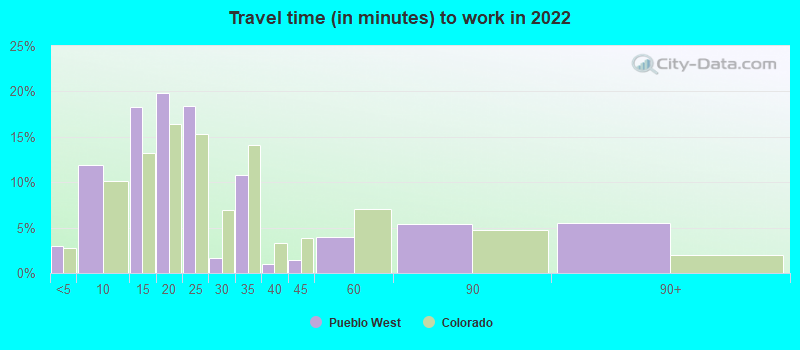
Travel time to work (commute)
Less than 5 minutes: 172
5 to 9 minutes: 650
10 to 14 minutes: 1,221
15 to 19 minutes: 2,517
20 to 24 minutes: 3,041
25 to 29 minutes: 669
30 to 34 minutes: 1,986
35 to 39 minutes: 406
40 to 44 minutes: 569
45 to 59 minutes: 1,549
60 to 89 minutes: 622
90 or more minutes: 951
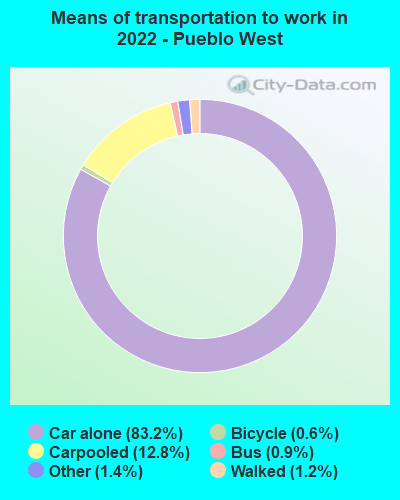
Means of transportation to work:
Drove a car alone: 4,518 (64.4%)
Carpooled: 722 (10.3%)
Bus: 37 (0.5%)
Taxi: 80 (1.1%)
Bicycle: 32 (0.5%)
Walked: 65 (0.9%)
Worked at home: 1,603 (22.9%)
Unemployment by race in 2022
Unemployment rate for White non-Hispanic residents
2.4%Males
3.3%Females
Unemployment rate for Black residents
5.7%Males
Unemployment rate for American Indian and Alaska Native residents
6.7%Females
Unemployment rate for Asian residents
25.4%Males
7.9%Females
Unemployment rate for other race residents
1.9%Females
Unemployment rate for two or more race residents
9.7%Males
2.2%Females
Unemployment rate for Hispanic or Latino residents
3.0%Males
3.9%Females
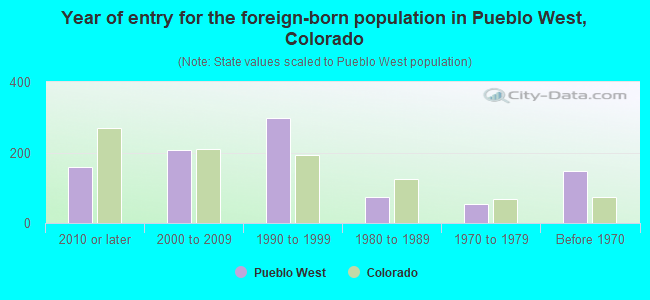
Year of entry for the foreign-born population in Pueblo West, Colorado
1582010 or later
2072000 to 2009
2971990 to 1999
741980 to 1989
551970 to 1979
147Before 1970
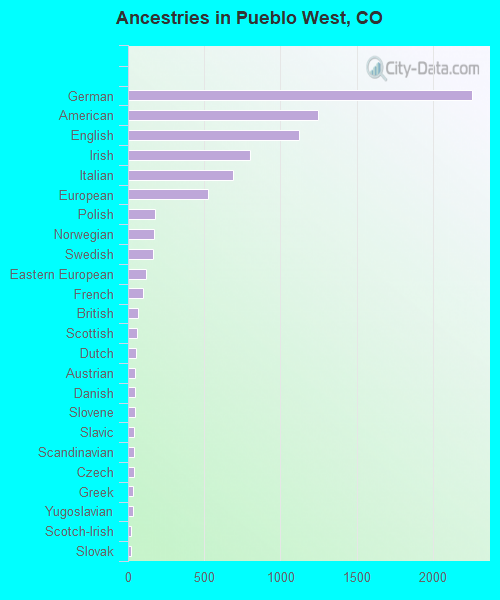
First ancestries reported:
German: 2,256 (17.6%)
American: 1,244 (9.7%)
English: 1,119 (8.7%)
Irish: 800 (6.2%)
Italian: 689 (5.4%)
European: 522 (4.1%)
Polish: 177 (1.4%)
Norwegian: 169 (1.3%)
Swedish: 164 (1.3%)
Eastern European: 118 (0.9%)
French: 96 (0.7%)
British: 63 (0.5%)
Scottish: 62 (0.5%)
Dutch: 51 (0.4%)
Austrian: 46 (0.4%)
Danish: 45 (0.4%)
Slovene: 44 (0.3%)
Slavic: 42 (0.3%)
Scandinavian: 40 (0.3%)
Czech: 37 (0.3%)
Greek: 30 (0.2%)
Yugoslavian: 30 (0.2%)
Scotch-Irish: 22 (0.2%)
Slovak: 22 (0.2%)
French Canadian: 15 (0.1%)
Lithuanian: 15 (0.1%)
Canadian: 13 (0.1%)
Portuguese: 12 (0.09%)
Northern European: 9 (0.07%)
Russian: 7 (0.05%)
Croatian: 6 (0.05%)
Czechoslovakian: 5 (0.04%)
Serbian: 4 (0.03%)
Welsh: 4 (0.03%)
Albanian: 2 (0.02%)
Most common places of birth for foreign-born residents (%):
Mexico
Pueblo West:
53.5% (642)
Colorado:
38.3% (209,491)
India
Pueblo West:
5.7% (68)
Colorado:
4.0% (21,689)
England
Pueblo West:
4.8% (58)
Colorado:
1.2% (6,672)
Germany
Pueblo West:
4.7% (56)
Colorado:
2.5% (13,706)
Canada
Pueblo West:
4.2% (51)
Colorado:
2.7% (15,026)
Colombia
Pueblo West:
3.4% (41)
Colorado:
1.1% (5,971)
Japan
Pueblo West:
3.2% (38)
Colorado:
0.7% (4,075)
Philippines
Pueblo West:
2.6% (31)
Colorado:
2.3% (12,342)
Panama
Pueblo West:
2.5% (30)
Colorado:
0.2% (1,009)
China, excluding Hong Kong and Taiwan
Pueblo West:
1.9% (23)
Colorado:
3.3% (17,998)
Korea
Pueblo West:
1.9% (23)
Colorado:
2.9% (15,981)
Costa Rica
Pueblo West:
1.7% (20)
Colorado:
0.2% (824)
Venezuela
Pueblo West:
1.6% (19)
Colorado:
0.9% (4,829)
Place of birth for U.S.-born residents:
This state: 17,257
Other state: 15,477
Northeast: 918
Midwest: 4,886
South: 3,718
West: 5,920
93.9% of Pueblo West residents lived in the same house 1 years ago. Out of people who lived in different houses, 28.4% lived in this county. Out of people who lived in different counties, 57.8% lived in Colorado.
Pueblo West:
93.9%
State average:
83.6%
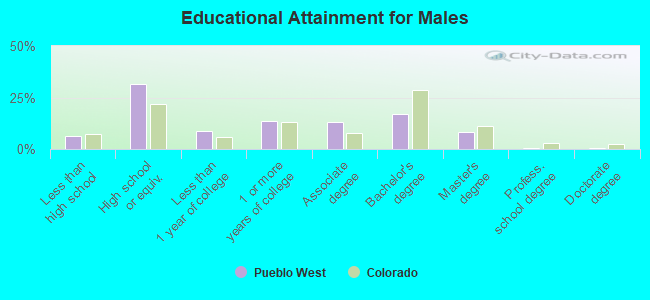
Education attainment for males 25 years and older:
No schooling: 149
Nursery to 4th grade: 28
5th and 6th grade: 0
7th and 8th grade: 36
9th grade: 203
10th grade: 135
11th grade: 135
12th grade, no diploma: 82
High school graduate (or equivalency): 3,748
Less than 1 year of college: 1,037
Some college more than 1 year, no degree: 1,643
Associate degree: 1,577
Bachelor's degree: 2,015
Master's degree: 993
Professional school degree: 77
Doctorate degree: 62
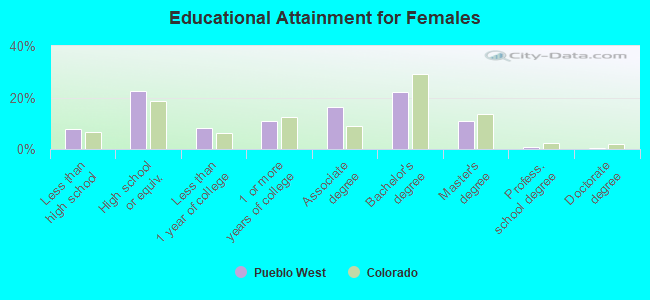
Education attainment for females 25 years and older:
No schooling: 101
Nursery to 4th grade: 36
5th and 6th grade: 76
7th and 8th grade: 58
9th grade: 236
10th grade: 60
11th grade: 254
12th grade, no diploma: 103
High school graduate (or equivalency): 2,717
Less than 1 year of college: 980
Some college more than 1 year, no degree: 1,324
Associate degree: 1,954
Bachelor's degree: 2,652
Master's degree: 1,301
Professional school degree: 82
Doctorate degree: 63
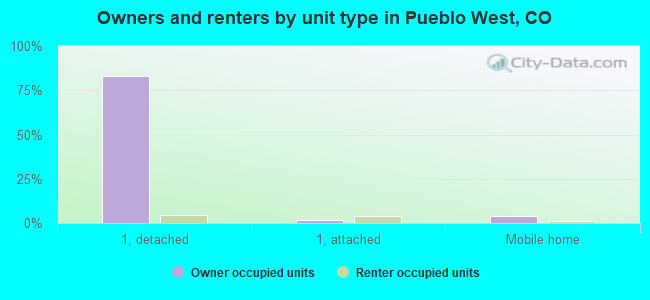
Housing units in structures:
One, detached: 10,644
One, attached: 736
Two: 215
3 or 4: 190
5 to 9: 109
10 to 19: 23
20 to 49: 20
50 or more: 94
Mobile homes: 723
Median worth of mobile homes: $101,432
Housing units lacking complete plumbing facilities in 2022: 0.3%
Housing units lacking complete kitchen facilities in 2022: 1.0%
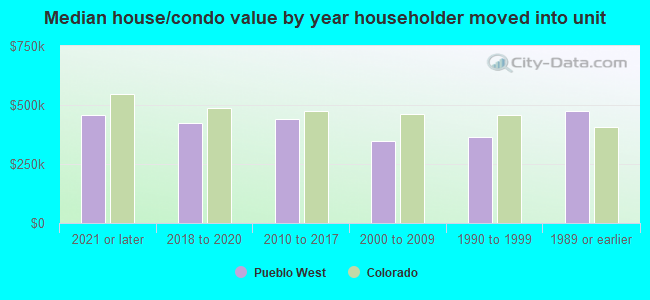
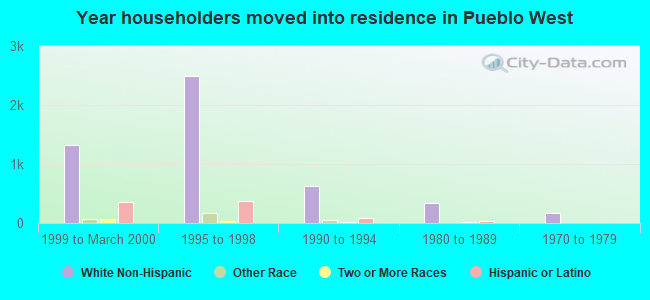
House/condo owner moved in on average 11 years ago