Pulaski, GA (Georgia) Houses and Residents
| Pulaski: | $120,460 |
| Georgia: | $297,400 |
Mean price in 2022:
Detached houses: $154,789
Here: $154,789 State: $376,364 Mobile homes: $59,931
Here: $59,931 State: $102,413
Total population: 271 (Urban population: 0, Rural population: 267 (all nonfarm))
Houses: 65 (51 occupied: 42 owner occupied, 9 renter occupied)
| % of renters here: | 18% |
| State: | 34% |
Housing density: 81 houses/condos per square mile
Median price asked for vacant for-sale houses and condos in 2022 in this county: $0.
Median gross rent in Pulaski, GA in 2022: $-692,874,692
Housing units in Pulaski with a mortgage: 13 (4 second mortgage, 4 home equity loan, 0 both second mortgage and home equity loan)
Houses without a mortgage: 0
Median household income for houses/condos with a mortgage: $72,558
Median household income for apartments without a mortgage: $78,321
Median monthly housing costs: $458
Compare current foreclosures near Pulaski, GA:
| Photo | Address | Area | Beds / Baths | Price | Details |
|---|---|---|---|---|---|

|
#1
Ben Grady Collins Rd
Portal, GA 30450
|
1,344 sq. feet
|
1 baths 3 beds |
$19,900
|
show details |

|
#2
Meadow Dr
Statesboro, GA 30461
|
1,964 sq. feet
|
2 baths 3 beds |
show details | |

|
#3
Pondside Dr
Statesboro, GA 30458
|
1,520 sq. feet
|
2 baths 3 beds |
show details | |

|
#4
Alexis Dr
Claxton, GA 30417
|
1,811 sq. feet
|
2 baths 3 beds |
show details | |

|
#5
Ga Highway 57 N
Metter, GA 30439
|
2,240 sq. feet
|
3 baths 5 beds |
show details | |

|
#6
Highway 67
Statesboro, GA 30458
|
1,632 sq. feet
|
2 baths 3 beds |
show details | |

|
#7
Foxlake Dr
Statesboro, GA 30458
|
1,434 sq. feet
|
2 baths 3 beds |
show details | |

|
#8
Preston St
Metter, GA 30439
|
2,824 sq. feet
|
2 baths 3 beds |
show details | |

|
#9
Grady St N
Portal, GA 30450
|
- sq. feet
|
2 baths 3 beds |
show details | |

|
#10
Meadow Dr
Statesboro, GA 30461
|
1,215 sq. feet
|
2 baths 3 beds |
show details |
| Photo | Address | Area | Beds / Baths | Price | Details |
|---|---|---|---|---|---|

|
#11
Circle Dr
Statesboro, GA 30461
|
1,401 sq. feet
|
2 baths 3 beds |
show details | |

|
#12
Circle Dr
Statesboro, GA 30461
|
1,322 sq. feet
|
2 baths 3 beds |
show details | |

|
#13
Aycock St
Portal, GA 30450
|
1,426 sq. feet
|
2 baths 3 beds |
show details | |

|
#14
Gentilly Rd
Statesboro, GA 30458
|
1,306 sq. feet
|
1 baths 3 beds |
show details | |

|
#15
N Jackson Rd
Statesboro, GA 30461
|
1,878 sq. feet
|
2 baths 3 beds |
show details | |

|
#16
S College St
Statesboro, GA 30458
|
1,464 sq. feet
|
1 baths 3 beds |
show details | |

|
#17
Garfield St
Statesboro, GA 30458
|
1,373 sq. feet
|
1 baths 2 beds |
show details | |

|
#18
Proctor St # A
Statesboro, GA 30458
|
1,323 sq. feet
|
1 baths 4 beds |
show details | |

|
#19
Reed St
Statesboro, GA 30458
|
1,360 sq. feet
|
2 baths 2 beds |
show details | |

|
#20
Stuckey Rd
Statesboro, GA 30461
|
2,558 sq. feet
|
2 baths 3 beds |
show details |
| Photo | Address | Area | Beds / Baths | Price | Details |
|---|---|---|---|---|---|

|
#21
Creasyville Ln
Brooklet, GA 30415
|
2,589 sq. feet
|
2 baths 3 beds |
show details | |

|
#22
Success Ct
Statesboro, GA 30458
|
914 sq. feet
|
1 baths 3 beds |
show details | |

|
#23
Len Tenner Ct
Statesboro, GA 30458
|
884 sq. feet
|
2 baths 3 beds |
show details | |

|
#24
Dodd Cir
Statesboro, GA 30461
|
1,056 sq. feet
|
1 baths 3 beds |
show details | |

|
#25
Pinemount Blvd
Statesboro, GA 30461
|
2,078 sq. feet
|
2 baths 4 beds |
show details | |

|
#26
Turner St
Statesboro, GA 30458
|
1,152 sq. feet
|
1 baths 2 beds |
show details | |

|
#27
Canterberry Pl
Statesboro, GA 30458
|
1,592 sq. feet
|
2 baths 3 beds |
show details | |

|
#28
Joyce St
Statesboro, GA 30458
|
1,220 sq. feet
|
1 baths 3 beds |
show details | |

|
#29
Hart St
Statesboro, GA 30458
|
1,531 sq. feet
|
1 baths 3 beds |
show details | |

|
#30
Pate Pl
Statesboro, GA 30458
|
1,247 sq. feet
|
2 baths 3 beds |
show details |
| Photo | Address | Area | Beds / Baths | Price | Details |
|---|---|---|---|---|---|

|
#31
Old Carriage Trl
Statesboro, GA 30458
|
1,743 sq. feet
|
2 baths 3 beds |
show details | |

|
#32
E Main St
Statesboro, GA 30458
|
1,073 sq. feet
|
1 baths 2 beds |
show details | |

|
#33
Hummingbird Cir
Statesboro, GA 30458
|
1,025 sq. feet
|
2 baths 2 beds |
show details | |

|
#34
Herons Walk
Statesboro, GA 30458
|
2,523 sq. feet
|
3 baths 4 beds |
show details | |

|
#35
Gentilly Rd
Statesboro, GA 30458
|
1,329 sq. feet
|
2 baths 3 beds |
show details | |

|
#36
Woodrum Rd S
Statesboro, GA 30461
|
2,470 sq. feet
|
2 baths 3 beds |
show details | |

|
#37
Deerfield Dr
Statesboro, GA 30461
|
1,766 sq. feet
|
2 baths 3 beds |
show details | |

|
#38
Burkhalter Rd
Statesboro, GA 30461
|
1,997 sq. feet
|
2 baths 3 beds |
show details | |

|
#39
Park Ave
Statesboro, GA 30458
|
2,510 sq. feet
|
2 baths 4 beds |
show details | |

|
#40
Windmill Rd
Metter, GA 30439
|
1,380 sq. feet
|
2 baths 3 beds |
show details |
| Photo | Address | Area | Beds / Baths | Price | Details |
|---|---|---|---|---|---|

|
#41
Burnt Pottery Ln
Statesboro, GA 30461
|
1,988 sq. feet
|
2 baths 3 beds |
show details | |

|
#42
Soloman Cir
Statesboro, GA 30458
|
912 sq. feet
|
1 baths 3 beds |
show details | |

|
#43
Johnny White Rd
Pembroke, GA 31321
|
2,016 sq. feet
|
1 baths 3 beds |
show details | |

|
#44
Five Chop Rd
Statesboro, GA 30461
|
1,451 sq. feet
|
1 baths 3 beds |
show details | |

|
#45
Penn Ave
Claxton, GA 30417
|
3,831 sq. feet
|
3 baths - beds |
show details | |

|
#46
Moffitt St
Metter, GA 30439
|
1,584 sq. feet
|
3 baths 3 beds |
show details | |

|
#47
Dekle Rd S
Register, GA 30452
|
1,962 sq. feet
|
2 baths 3 beds |
show details | |

|
#48
Charleston Ave
Statesboro, GA 30458
|
1,600 sq. feet
|
2 baths 3 beds |
show details | |

|
#49
Carriage Ln
Statesboro, GA 30458
|
1,077 sq. feet
|
2 baths 3 beds |
show details | |

|
Check over 1 million property listings on Foreclosure.com!
|
browse all offers | |||

Latest news about housing in Pulaski, GA collected exclusively by city-data.com from local newspapers, TV, and radio stations


Median year apartment built: 1938
Household type by relationship:
Households: 234- Male householders: 10 (5 living alone), Female householders: 40 (7 living alone)
24 spouses (24 opposite-sex spouses), 5 unmarried partners, (5 opposite-sex unmarried partners), 52 children (52 natural, 0 adopted, 0 stepchildren), 0 grandchildren, 0 brothers or sisters, 0 parents, 0 foster children, 0 other relatives, 12 non-relatives
- In group quarters: 88
Size of family households: 20 2-persons, 4 3-persons, 9 4-persons, 2 5-persons.
Size of nonfamily households: 12 1-person, 3 2-persons.
17 married couples with children.
2 single-parent households (0 men, 2 women).
99.6% of residents of Pulaski speak English at home.
0.4% of residents speak Spanish at home (100% speak English very well).
Foreign born population: 5 (2.1%)
(100.0% of them are naturalized citizens)
| Here: | 6.2 |
| State: | 6.8 |
| Here: | 4.4 |
| State: | 4.6 |

- Bedrooms in owner-occupied houses and condos in Pulaski, Georgia
- 0no bedroom
- 01 bedroom
- 82 bedrooms
- 323 bedrooms
- 24 bedrooms
- 05+ bedrooms

- Bedrooms in renter-occupied apartments in Pulaski, Georgia
- 0no bedroom
- 01 bedroom
- 62 bedrooms
- 33 bedrooms
- 04 bedrooms
- 05+ bedrooms

- Cars and other vehicles available in Pulaski in owner-occupied houses/condos
- 0no vehicle
- 91 vehicle
- 102 vehicles
- 203 vehicles
- 04 vehicles
- 35+ vehicles

- Cars and other vehicles available in Pulaski in renter-occupied apartments
- 0no vehicle
- 51 vehicle
- 12 vehicles
- 33 vehicles
- 04 vehicles
- 05+ vehicles

- Rooms in owner-occupied houses in Pulaski, Georgia
- 01 room
- 02 rooms
- 03 rooms
- 04 rooms
- 35 rooms
- 256 rooms
- 57 rooms
- 78 rooms
- 29+ rooms

- Rooms in renter-occupied apartments in Pulaski, Georgia
- 01 room
- 02 rooms
- 03 rooms
- 54 rooms
- 05 rooms
- 46 rooms
- 07 rooms
- 08 rooms
- 09+ rooms


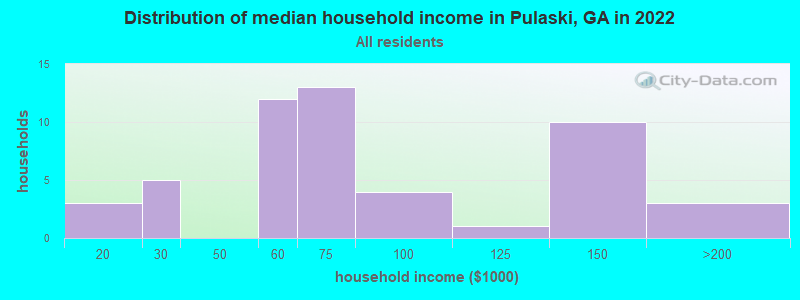
Pulaski, GA household income distribution

- 3$10,000 to $19,999
- 5$20,000 to $29,999
- 12$50,000 to $59,999
- 13$60,000 to $74,999
- 4$75,000 to $99,999
- 1$100,000 to $124,999
- 10$125,000 to $149,999
- 3$150,000 to $199,999
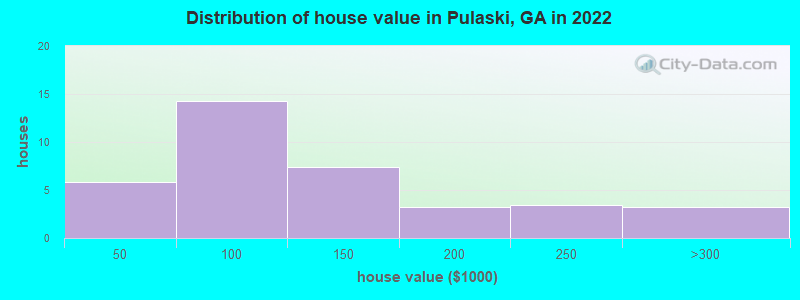
Home value of owner - occupied houses in 2022 in Pulaski, GA
-
- 0$20,000 to $24,999
- 4$40,000 to $49,999
- 1$50,000 to $59,999
- 7$90,000 to $99,999
- 7$100,000 to $124,999
- 3$150,000 to $174,999
- 3$200,000 to $249,999
- 3$250,000 to $299,999
Rent paid by renters in 2022 in Pulaski, GA
-
- 3$350 to $399
- 5No cash rent


Percentage of workers working in this county: 41.1%
Number of people working at home: 4 (4.2% of all workers)
Travel time to work (commute)
- Less than 5 minutes: 0
- 5 to 9 minutes: 0
- 10 to 14 minutes: 26
- 15 to 19 minutes: 6
- 20 to 24 minutes: 12
- 25 to 29 minutes: 30
- 30 to 34 minutes: 0
- 35 to 39 minutes: 0
- 40 to 44 minutes: 4
- 45 to 59 minutes: 6
- 60 to 89 minutes: 0
- 90 or more minutes: 0
Means of transportation to work:
- Drove a car alone: 48 (53.9%)
- Carpooled: 24 (27.0%)
- Other means: 17 (19.1%)


- Year of entry for the foreign-born population in Pulaski, Georgia
- 02010 or later
- 02000 to 2009
- 01990 to 1999
- 81980 to 1989
- 01970 to 1979
- 0Before 1970

First ancestries reported:
- American: 55 (34.7%)
- English: 14 (8.8%)
- Canadian: 4 (2.5%)
Most common places of birth for foreign-born residents (%):
| Pulaski: | 80.0% (4) |
| Georgia: | 1.6% (17,851) |
Place of birth for U.S.-born residents:
- This state: 205
- Other state: 20
- Northeast: 5
- Midwest: 5
- South: 7
- West: 3
93.6% of Pulaski residents lived in the same house 1 years ago.
Out of people who lived in different houses, 0.0% lived in this county.
Out of people who lived in different counties, 100.0% lived in Georgia.
| Pulaski: | 93.6% |
| State average: | 86.6% |
Education attainment for males 25 years and older:
- No schooling: 0
- Nursery to 4th grade: 0
- 5th and 6th grade: 0
- 7th and 8th grade: 0
- 9th grade: 1
- 10th grade: 0
- 11th grade: 4
- 12th grade, no diploma: 0
- High school graduate (or equivalency): 43
- Less than 1 year of college: 0
- Some college more than 1 year, no degree: 9
- Associate degree: 8
- Bachelor's degree: 2
- Master's degree: 6
- Professional school degree: 0
- Doctorate degree: 0

Education attainment for females 25 years and older:
- No schooling: 0
- Nursery to 4th grade: 0
- 5th and 6th grade: 0
- 7th and 8th grade: 0
- 9th grade: 4
- 10th grade: 10
- 11th grade: 0
- 12th grade, no diploma: 0
- High school graduate (or equivalency): 47
- Less than 1 year of college: 3
- Some college more than 1 year, no degree: 9
- Associate degree: 22
- Bachelor's degree: 19
- Master's degree: 0
- Professional school degree: 3
- Doctorate degree: 0


Housing units in structures:
- One, detached: 54
- Mobile homes: 11
Median worth of mobile homes: $54,801
House/condo owner moved in on average 18 years ago
Renter moved in on average 14 years ago

Private vs. public school enrollment:
| Here: | 0.0% |
| Georgia: | 12.1% |
| Here: | 0.0% |
| Georgia: | 10.8% |
| Here: | 0.0% |
| Georgia: | 17.1% |


