Punta Gorda, FL (Florida) Houses and Residents
Estimated median house or condo value in 2022: $575,164 (it was $185,000 in 2000 )
Punta Gorda:
$575,164Florida:
$354,100
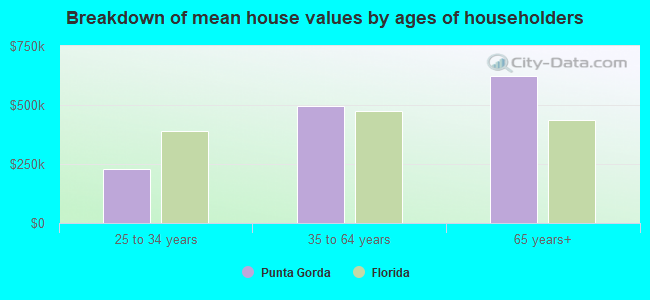
Lower value quartile - upper value quartile: $341,220 - $806,307Mean price in 2022: Detached houses: $749,704 Here:
$749,704State:
$500,941
Townhouses or other attached units: $700,852 Here:
$700,852State:
$370,869
In 2-unit structures: $325,747 Here:
$325,747State:
$423,188
In 3-to-4-unit structures: $256,361 Here:
$256,361State:
$309,944
In 5-or-more-unit structures: $436,188 Here:
$436,188State:
$447,145
Mobile homes: $95,114 Here:
$95,114State:
$113,202
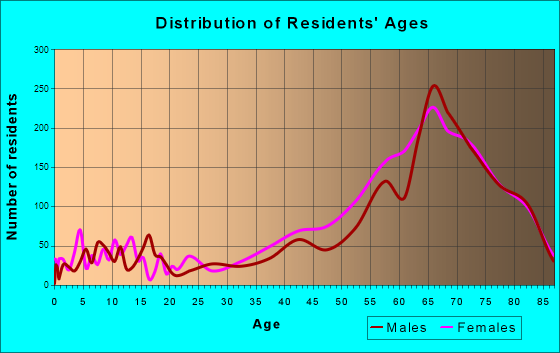
Total population: 17,596 (Urban population: 14,394, Rural population: 39 (all nonfarm) )
Houses: 14,132 (10,436 occupied: 8,651 owner occupied, 1,847 renter occupied )
% of renters here:
18%State:
33%
Housing density: 998 houses/condos per square mile
Median price asked for vacant for-sale houses and condos in 2022: $567,996.
Median contract rent in 2022: $1,115 (lower quartile is $797, upper quartile is $1,786)
Median rent asked for vacant for-rent units in 2022: $1,376
Median gross rent in Punta Gorda, FL in 2022: $1,230
Housing units in Punta Gorda with a mortgage: 2,962 (313 second mortgage, 0 home equity loan, 256 both second mortgage and home equity loan )Houses without a mortgage: 21
Median household income for houses/condos with a mortgage: $103,239
Median household income for apartments without a mortgage: $75,681
Median monthly housing costs: $1,171
Data:
Median house or condo value ($)
Median house or condo value ($ change since 2000)
Median house or condo value ($) - White
Median house or condo value ($) - Black or African American
Median house or condo value ($) - Asian
Median house or condo value ($) - Hispanic or Latino
Median house or condo value ($) - American Indian and Alaska Native
Median house or condo value ($) - Multirace
Median house or condo value ($) - Other Race
Median price asked for mobile homes ($)
Household density (households per square mile)
Mean house or condo value by units in structure - 1, detached ($)
Mean house or condo value by units in structure - 1, attached ($)
Mean house or condo value by units in structure - 2 ($)
Mean house or condo value by units in structure by units in structure - 3 or 4 ($)
Mean house or condo value by units in structure - 5 or more ($)
Mean house or condo value by units in structure - Boat, RV, van, etc. ($)
Mean house or condo value by units in structure - Mobile home ($)
Median contract rent ($)
Median contract rent - Lower quartile ($)
Median contract rent - Upper quartile ($)
Median gross rent ($)
Urban houses (%)
Rural houses (%)
Houses occupied (%)
Houses occupied (% change since 2000)
Houses owner occupied (%)
Houses owner occupied (% change since 2000)
Houses renter occupied (%)
Houses renter occupied (% change since 2000)
Vacant housing units - For rent (%)
Vacant housing units - For rent (% change since 2000)
Vacant housing units - For sale only (%)
Vacant housing units - For sale only (% change since 2000)
Vacant housing units - Rented or sold, not occupied (%)
Vacant housing units - Rented or sold, not occupied (% change since 2000)
Vacant housing units - For seasonal, recreational, or occasional use (%)
Vacant housing units - For seasonal, recreational, or occasional use (% change since 2000)
Vacant housing units - For migrant workers (%)
Vacant housing units - For migrant workers (% change since 2000)
Vacant housing units - Other vacant (%)
Vacant housing units - Other vacant (% change since 2000)
Median monthly housing costs ($)
Median household income for houses/condos with a mortgage ($)
Median household income for houses/condos without a mortgage ($)
Median household income ($)
Median household income ($) - White
Median household income ($) - Black or African American
Median household income ($) - Asian
Median household income ($) - Hispanic or Latino
Median household income ($) - American Indian and Alaska Native
Median household income ($) - Multirace
Median household income ($) - Other Race
Mortgage status - with mortgage (%)
Mortgage status - with second mortgage (%)
Mortgage status - with home equity loan (%)
Mortgage status - with both second mortgage and home equity loan (%)
Mortgage status - without a mortgage (%)
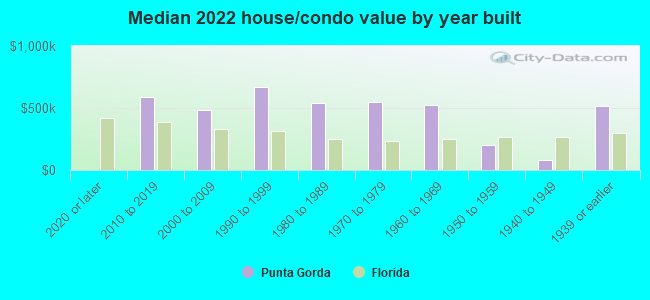
Median year house/condo built
Median year apartment built
Household type by relationship - Male householder living alone (%)
Household type by relationship - Male householder not living alone (%)
Household type by relationship - Female householder living alone (%)
Household type by relationship - Female householder not living alone (%)
Household type by relationship - Opposite-Sex spouse (%)
Household type by relationship - Same-Sex spouse (%)
Household type by relationship - Opposite-Sex unmarried partner (%)
Household type by relationship - Same-Sex unmarried partner (%)
Household type by relationship - In group quarters (%)
Size of family households - 2-person household (%)
Size of family households - 3-person household (%)
Size of family households - 4-person household (%)
Size of family households - 5-person household (%)
Size of family households - 6-person household (%)
Size of family households - 7-or-more-person household (%)
Size of nonfamily households - 1-person household (%)
Size of nonfamily households - 2-person household (%)
Size of nonfamily households - 3-person household (%)
Size of nonfamily households - 4-person household (%)
Size of nonfamily households - 5-person household (%)
Size of nonfamily households - 6-person household (%)
Size of nonfamily households - 7-or-moreperson household (%)
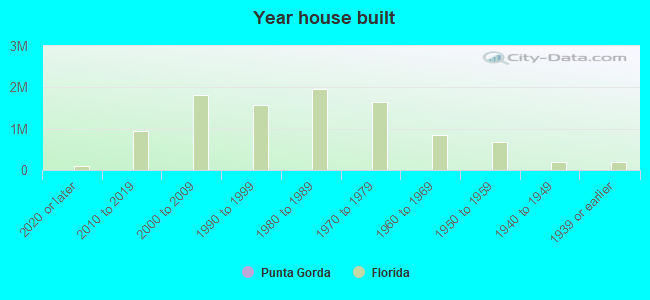
Year house built - Built 2010 or later (%)
Year house built - Built 2000 to 2009 (%)
Year house built - Built 1990 to 1999 (%)
Year house built - Built 1980 to 1989 (%)
Year house built - Built 1970 to 1979 (%)
Year house built - Built 1960 to 1969 (%)
Year house built - Built 1950 to 1959 (%)
Year house built - Built 1940 to 1949 (%)
Year house built - Built 1939 or earlier (%)
Median number of rooms in houses and condos
Median number of rooms in apartments
Median number of bedrooms in owner occupied houses
Mean number of bedrooms in owner occupied houses
Median number of bedrooms in renter occupied houses
Mean number of bedrooms in renter occupied houses
Median number of vehichles in owner occupied houses
Mean number of vehichles in owner occupied houses
Median number of vehichles in renter occupied houses
Mean number of vehichles in renter occupied houses
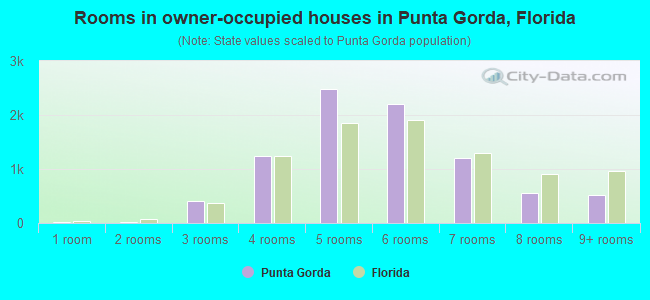
Rooms in owner-occupied houses - 1 room (%)
Rooms in owner-occupied houses - 2 rooms (%)
Rooms in owner-occupied houses - 3 rooms (%)
Rooms in owner-occupied houses - 4 rooms (%)
Rooms in owner-occupied houses - 5 rooms (%)
Rooms in owner-occupied houses - 6 rooms (%)
Rooms in owner-occupied houses - 7 rooms (%)
Rooms in owner-occupied houses - 8 rooms (%)
Rooms in owner-occupied houses - 9+ rooms (%)
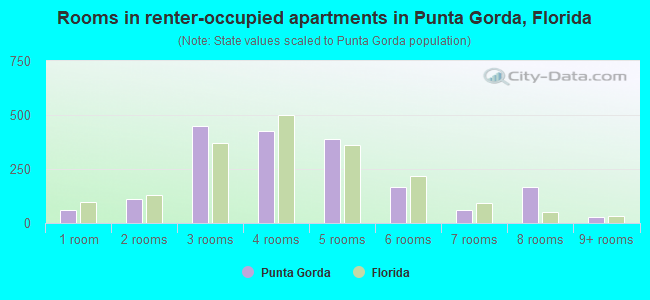
Rooms in renter-occupied houses - 1 room (%)
Rooms in renter-occupied houses - 2 rooms (%)
Rooms in renter-occupied houses - 3 rooms (%)
Rooms in renter-occupied houses - 4 rooms (%)
Rooms in renter-occupied houses - 5 rooms (%)
Rooms in renter-occupied houses - 6 rooms (%)
Rooms in renter-occupied houses - 7 rooms (%)
Rooms in renter-occupied houses - 8 rooms (%)
Rooms in renter-occupied houses - 9+ rooms (%)
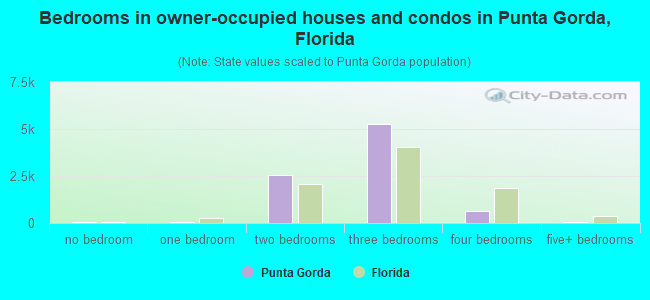
Bedrooms in owner-occupied houses - no bedrooms (%)
Bedrooms in owner-occupied houses - 1 bedroom (%)
Bedrooms in owner-occupied houses - 2 bedrooms (%)
Bedrooms in owner-occupied houses - 3 bedrooms (%)
Bedrooms in owner-occupied houses - 4 bedrooms (%)
Bedrooms in owner-occupied houses - 5+ bedrooms (%)
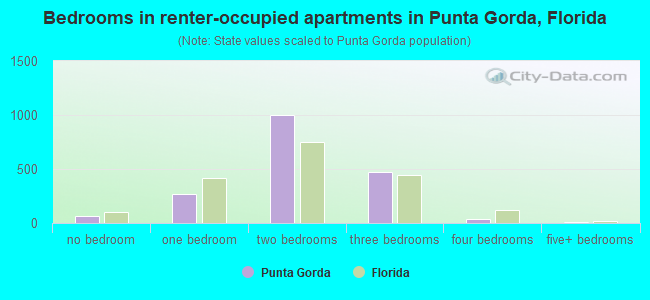
Bedrooms in renter-occupied houses - no bedrooms (%)
Bedrooms in renter-occupied houses - 1 bedroom (%)
Bedrooms in renter-occupied houses - 2 bedrooms (%)
Bedrooms in renter-occupied houses - 3 bedrooms (%)
Bedrooms in renter-occupied houses - 4 bedrooms (%)
Bedrooms in renter-occupied houses - 5+ bedrooms (%)
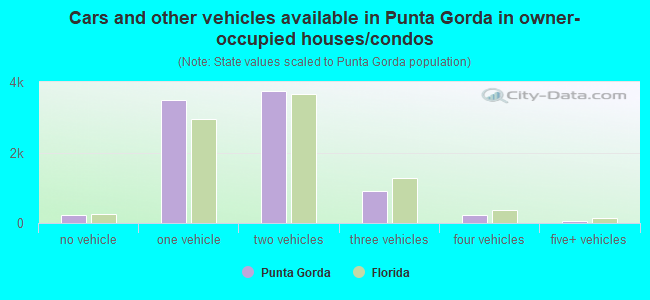
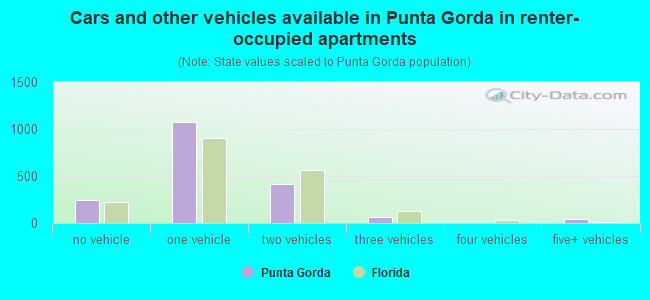
Vehicles available in owner-occupied houses - no vehicle available (%)
Vehicles available in owner-occupied houses - 1 vehicle available(%)
Vehicles available in owner-occupied houses - 2 Vehicles available (%)
Vehicles available in owner-occupied houses - 3 Vehicles available (%)
Vehicles available in owner-occupied houses - 4 Vehicles available (%)
Vehicles available in owner-occupied houses - 5+ Vehicles available (%)
Vehicles available in renter-occupied houses - no vehicle available (%)
Vehicles available in renter-occupied houses - 1 vehicle available (%)
Vehicles available in renter-occupied houses - 2 Vehicles available (%)
Vehicles available in renter-occupied houses - 3 Vehicles available (%)
Vehicles available in renter-occupied houses - 4 Vehicles available (%)
Vehicles available in renter-occupied houses - 5+ Vehicles available (%)
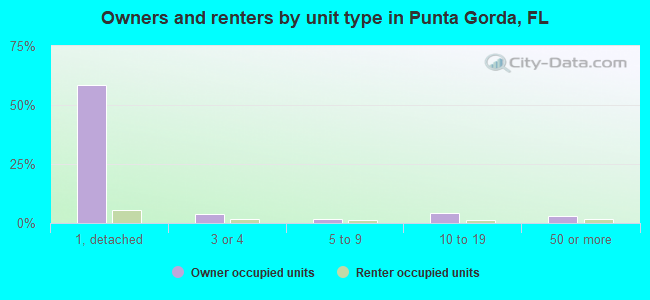
Housing units in structures - 1, detached (%)
Housing units in structures - 1, attached (%)
Housing units in structures - 2 (%)
Housing units in structures - 3 or 4 (%)
Housing units in structures - 5 to 9 (%)
Housing units in structures - 10 to 19 (%)
Housing units in structures - 20 to 49 (%)
Housing units in structures - 50 or more (%)
Housing units in structures - Mobile home (%)
Housing units in structures - Boat, RV, van, etc. (%)
Housing units in structures - Owners - 1, detached (%)
Housing units in structures - Owners - 1, attached (%)
Housing units in structures - Owners - 2 (%)
Housing units in structures - Owners - 3 or 4 (%)
Housing units in structures - Owners - 5 to 9 (%)
Housing units in structures - Owners - 10 to 19 (%)
Housing units in structures - Owners - 20 to 49 (%)
Housing units in structures - Owners - 50 or more (%)
Housing units in structures - Owners - Mobile home (%)
Housing units in structures - Owners - Boat, RV, van, etc. (%)
Housing units in structures - Renters - 1, detached (%)
Housing units in structures - Renters - 1, attached (%)
Housing units in structures - Renters - 2 (%)
Housing units in structures - Renters - 3 or 4 (%)
Housing units in structures - Renters - 5 to 9 (%)
Housing units in structures - Renters - 10 to 19 (%)
Housing units in structures - Renters - 20 to 49 (%)
Housing units in structures - Renters - 50 or more (%)
Housing units in structures - Renters - Mobile home (%)
Housing units in structures - Renters - Boat, RV, van, etc. (%)
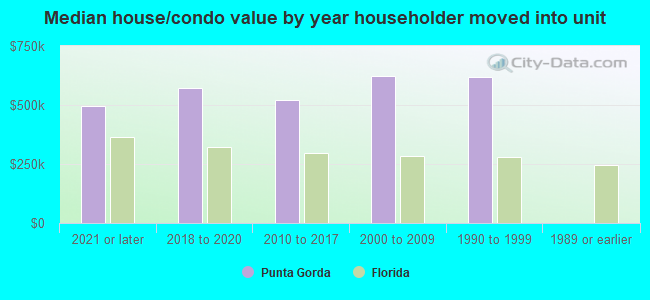
House/condo owner moved in on average (years ago)
Renter moved in on average (years ago)
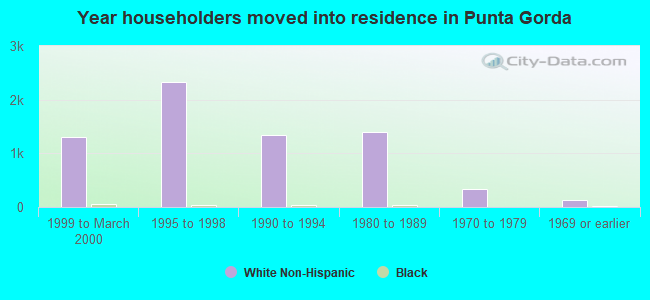
Year householder moved into unit - Moved in 1999 to March 2000 (%)
Year householder moved into unit - Moved in 1999 to March 2000 (%) - White
Year householder moved into unit - Moved in 1999 to March 2000 (%) - Black or African American
Year householder moved into unit - Moved in 1999 to March 2000 (%) - Asian
Year householder moved into unit - Moved in 1999 to March 2000 (%) - Hispanic or Latino
Year householder moved into unit - Moved in 1999 to March 2000 (%) - American Indian and Alaska Native
Year householder moved into unit - Moved in 1999 to March 2000 (%) - Multirace
Year householder moved into unit - Moved in 1999 to March 2000 (%) - Other Race
Year householder moved into unit - Moved in 1995 to 1998 (%)
Year householder moved into unit - Moved in 1995 to 1998 (%) - White
Year householder moved into unit - Moved in 1995 to 1998 (%) - Black or African American
Year householder moved into unit - Moved in 1995 to 1998 (%) - Asian
Year householder moved into unit - Moved in 1995 to 1998 (%) - Hispanic or Latino
Year householder moved into unit - Moved in 1995 to 1998 (%) - American Indian and Alaska Native
Year householder moved into unit - Moved in 1995 to 1998 (%) - Multirace
Year householder moved into unit - Moved in 1995 to 1998 (%) - Other Race
Year householder moved into unit - Moved in 1990 to 1994 (%)
Year householder moved into unit - Moved in 1990 to 1994 (%) - White
Year householder moved into unit - Moved in 1990 to 1994 (%) - Black or African American
Year householder moved into unit - Moved in 1990 to 1994 (%) - Asian
Year householder moved into unit - Moved in 1990 to 1994 (%) - Hispanic or Latino
Year householder moved into unit - Moved in 1990 to 1994 (%) - American Indian and Alaska Native
Year householder moved into unit - Moved in 1990 to 1994 (%) - Multirace
Year householder moved into unit - Moved in 1990 to 1994 (%) - Other Race
Year householder moved into unit - Moved in 1980 to 1989 (%)
Year householder moved into unit - Moved in 1980 to 1989 (%) - White
Year householder moved into unit - Moved in 1980 to 1989 (%) - Black or African American
Year householder moved into unit - Moved in 1980 to 1989 (%) - Asian
Year householder moved into unit - Moved in 1980 to 1989 (%) - Hispanic or Latino
Year householder moved into unit - Moved in 1980 to 1989 (%) - American Indian and Alaska Native
Year householder moved into unit - Moved in 1980 to 1989 (%) - Multirace
Year householder moved into unit - Moved in 1980 to 1989 (%) - Other Race
Year householder moved into unit - Moved in 1970 to 1979 (%)
Year householder moved into unit - Moved in 1970 to 1979 (%) - White
Year householder moved into unit - Moved in 1970 to 1979 (%) - Black or African American
Year householder moved into unit - Moved in 1970 to 1979 (%) - Asian
Year householder moved into unit - Moved in 1970 to 1979 (%) - Hispanic or Latino
Year householder moved into unit - Moved in 1970 to 1979 (%) - American Indian and Alaska Native
Year householder moved into unit - Moved in 1970 to 1979 (%) - Multirace
Year householder moved into unit - Moved in 1970 to 1979 (%) - Other Race
Year householder moved into unit - Moved in 1969 or earlier (%)
Year householder moved into unit - Moved in 1969 or earlier (%) - White
Year householder moved into unit - Moved in 1969 or earlier (%) - Black or African American
Year householder moved into unit - Moved in 1969 or earlier (%) - Asian
Year householder moved into unit - Moved in 1969 or earlier (%) - Hispanic or Latino
Year householder moved into unit - Moved in 1969 or earlier (%) - American Indian and Alaska Native
Year householder moved into unit - Moved in 1969 or earlier (%) - Multirace
Year householder moved into unit - Moved in 1969 or earlier (%) - Other Race
Housing units lacking complete plumbing facilities (%)
Housing units lacking complete kitchen facilities (%)
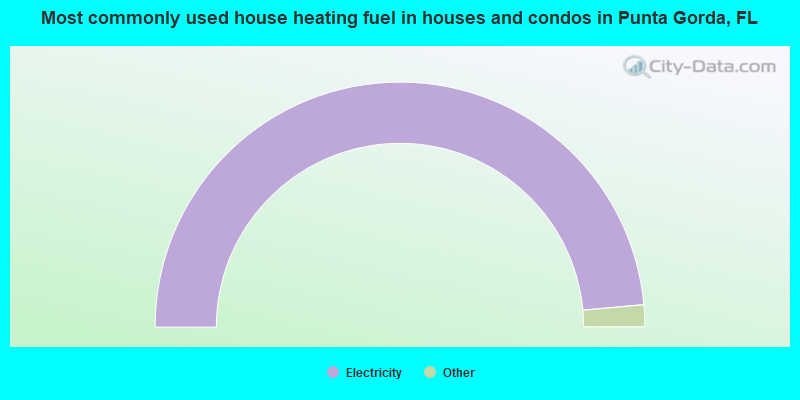
House heating fuel used in houses and condos - Utility gas (%)
House heating fuel used in houses and condos - Bottled, tank, or LP gas (%)
House heating fuel used in houses and condos - Electricity (%)
House heating fuel used in houses and condos - Fuel oil, kerosene, etc. (%)
House heating fuel used in houses and condos - Coal or coke (%)
House heating fuel used in houses and condos - Wood (%)
House heating fuel used in houses and condos - Solar energy (%)
House heating fuel used in houses and condos - Other fuel (%)
House heating fuel used in houses and condos - No fuel used (%)
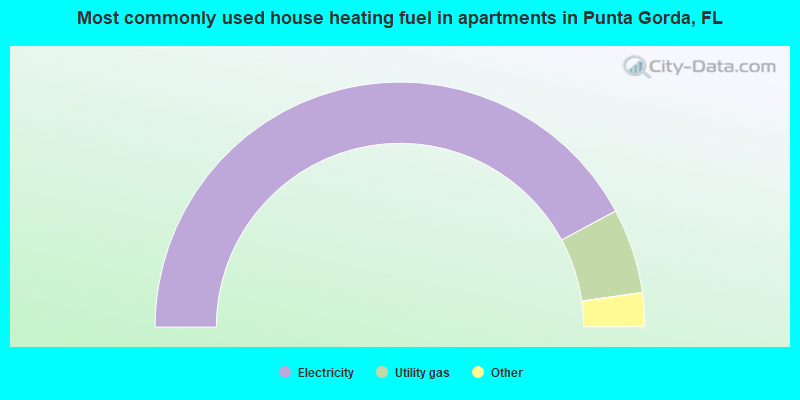
House heating fuel used in apartments - Utility gas (%)
House heating fuel used in apartments - Bottled, tank, or LP gas (%)
House heating fuel used in apartments - Electricity (%)
House heating fuel used in apartments - Fuel oil, kerosene, etc. (%)
House heating fuel used in apartments - Coal or coke (%)
House heating fuel used in apartments - Wood (%)
House heating fuel used in apartments - Solar energy (%)
House heating fuel used in apartments - Other fuel (%)
House heating fuel used in apartments - No fuel used (%)
Median year house/condo built: 1998Median year apartment built: 1999Household type by relationship:
Households: 20,922
Male householders: 5,608 (1,234 living alone ), Female householders: 4,879 (1,801 living alone )6,126 spouses (6,113 opposite-sex spouses ), 614 unmarried partners , (614 opposite-sex unmarried partners ), 2,514 children (2,305 natural , 0 adopted , 209 stepchildren ), 392 grandchildren , 181 brothers or sisters , 85 parents , 0 foster children , 114 other relatives , 192 non-relatives In group quarters: 213
Size of family households: 5,514 2-persons , 773 3-persons , 429 4-persons , 68 5-persons , 61 6-persons , 22 7-or-more-persons .
Size of nonfamily households: 2,923 1-person , 678 2-persons , 7 3-persons .
979 married couples with children. single-parent households (342 men , 235 women ).
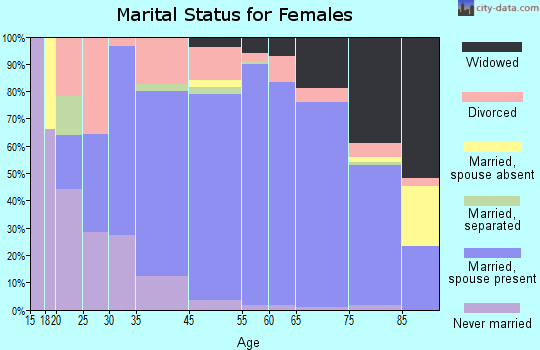
94.1% of residents of Punta Gorda speak English at home. of residents speak Spanish at home (73% speak English very well , 15% speak English well , 11% speak English not well , 2% don't speak English at all ).of residents speak other Indo-European language at home (80% speak English very well , 11% speak English well , 9% speak English not well ).of residents speak Asian or Pacific Island language at home (64% speak English very well , 29% speak English well , 8% speak English not well ).of residents speak other language at home (50% speak English very well , 50% speak English well ).
Foreign born population: 1,824 (8.7%)of them are naturalized citizens )
Median number of rooms in houses and condos:
Median number of rooms in apartments
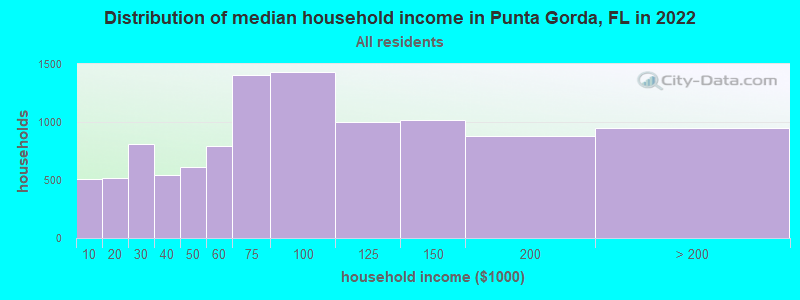
Punta Gorda, FL household income distribution 512 Less than $10,000519 $10,000 to $19,999812 $20,000 to $29,999546 $30,000 to $39,999609 $40,000 to $49,999789 $50,000 to $59,9991,409 $60,000 to $74,9991,427 $75,000 to $99,9991,001 $100,000 to $124,9991,017 $125,000 to $149,999880 $150,000 to $199,999948 $200,000 or more
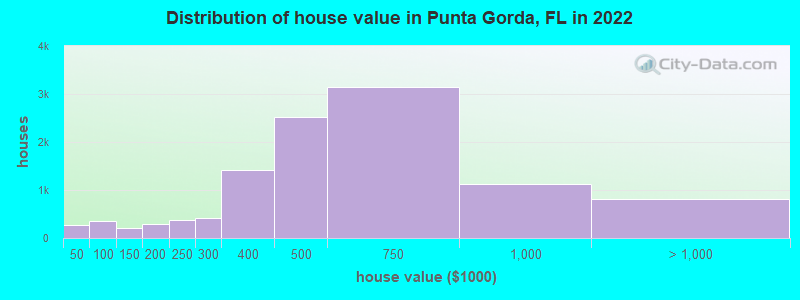
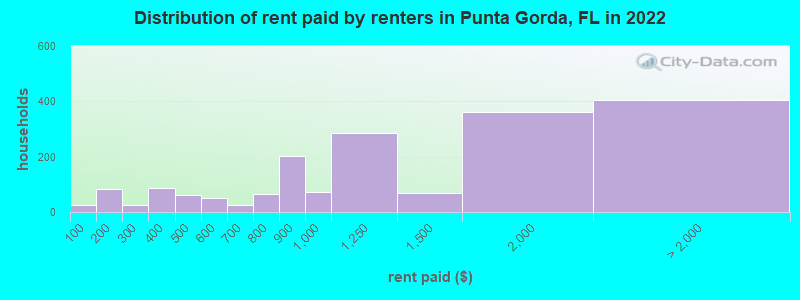
Home value of owner - occupied houses in 2022 in Punta Gorda, FL 20 Less than $10,00018 $10,000 to $14,99932 $15,000 to $19,9998 $20,000 to $24,99944 $25,000 to $29,99944 $30,000 to $34,999106 $40,000 to $49,99950 $50,000 to $59,99967 $60,000 to $69,99922 $70,000 to $79,99976 $80,000 to $89,99934 $90,000 to $99,999158 $100,000 to $124,99940 $125,000 to $149,99994 $150,000 to $174,999205 $175,000 to $199,999375 $200,000 to $249,999422 $250,000 to $299,9991,416 $300,000 to $399,9992,518 $400,000 to $499,9993,152 $500,000 to $749,9991,128 $750,000 to $999,999572 $1,000,000 to $1,499,999132 $1,500,000 to $1,999,999111 $2,000,000 or moreRent paid by renters in 2022 in Punta Gorda, FL 27 Less than $10084 $100 to $14923 $200 to $24924 $300 to $34960 $350 to $39959 $400 to $44946 $500 to $5495 $550 to $59926 $650 to $69924 $700 to $74940 $750 to $799202 $800 to $89973 $900 to $999283 $1,000 to $1,24967 $1,250 to $1,499363 $1,500 to $1,999101 $2,000 to $2,49989 $2,500 to $2,99953 $3,500 or more161 No cash rent
Percentage of workers working in this county: 76.0%Number of people working at home: 1,074 (19.2% of all workers )
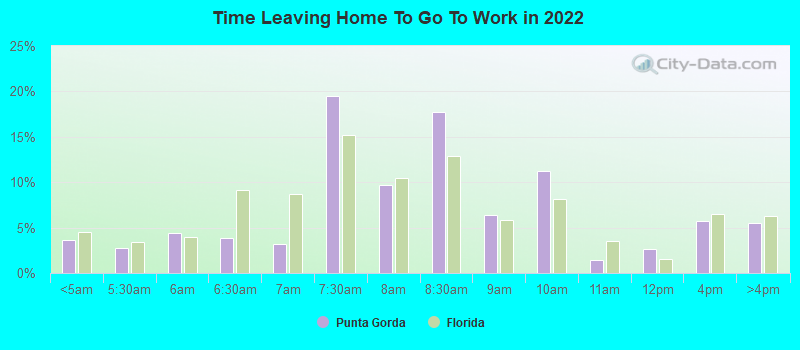
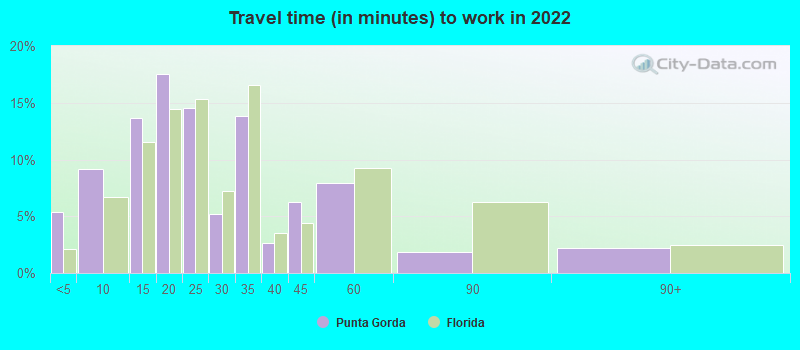
Travel time to work (commute)
Less than 5 minutes: 3545 to 9 minutes: 51410 to 14 minutes: 1,06115 to 19 minutes: 54820 to 24 minutes: 33425 to 29 minutes: 25430 to 34 minutes: 72335 to 39 minutes: 16640 to 44 minutes: 9745 to 59 minutes: 46360 to 89 minutes: 27390 or more minutes: 75
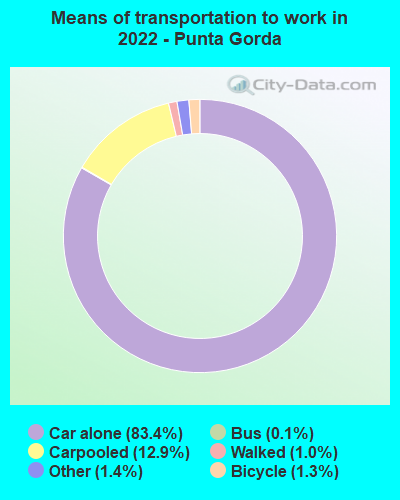
Means of transportation to work:
Drove a car alone: 8,396 (73.0%)Carpooled: 1,376 (12.0%)Bus : 10 (0.1%)Taxi: 152 (1.3%)Bicycle: 127 (1.1%)Walked: 113 (1.0%)Worked at home: 1,074 (9.3%)
Unemployment by race in 2022
Unemployment rate for White non-Hispanic residents 6.7% Males2.7% FemalesUnemployment rate for other race residents 100.0% MalesUnemployment rate for two or more race residents 1.6% MalesUnemployment rate for Hispanic or Latino residents 16.0% Males7.2% Females
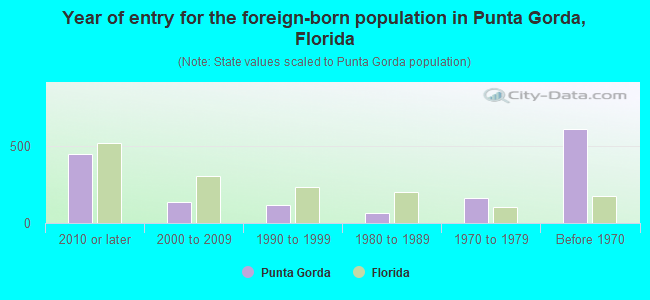
Year of entry for the foreign-born population in Punta Gorda, Florida
450 2010 or later 135 2000 to 2009 120 1990 to 1999 66 1980 to 1989 164 1970 to 1979 613 Before 1970
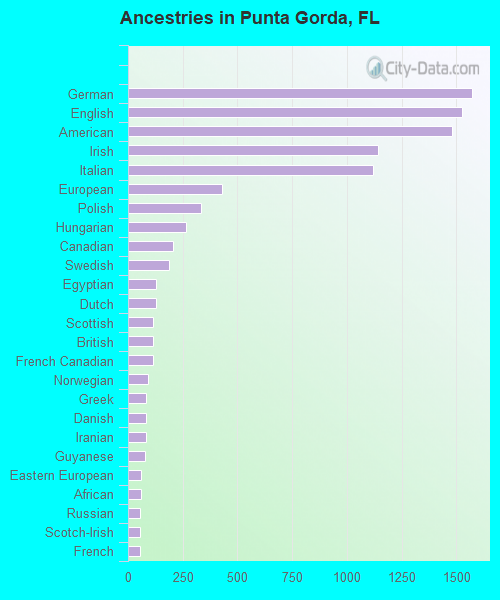
First ancestries reported:
German: 1,570 (13.7%)
English: 1,524 (13.3%)
American: 1,480 (12.9%)
Irish: 1,141 (9.9%)
Italian: 1,121 (9.8%)
European: 430 (3.7%)
Polish: 332 (2.9%)
Hungarian: 267 (2.3%)
Canadian: 206 (1.8%)
Swedish: 185 (1.6%)
Egyptian: 129 (1.1%)
Dutch: 129 (1.1%)
Scottish: 116 (1.0%)
British: 114 (1.0%)
French Canadian: 112 (1.0%)
Norwegian: 92 (0.8%)
Greek: 84 (0.7%)
Danish: 83 (0.7%)
Iranian: 81 (0.7%)
Guyanese: 76 (0.7%)
Eastern European: 60 (0.5%)
African: 60 (0.5%)
Russian: 55 (0.5%)
Scotch-Irish: 55 (0.5%)
French: 54 (0.5%)
Ukrainian: 53 (0.5%)
Scandinavian: 41 (0.4%)
Portuguese: 40 (0.3%)
Northern European: 31 (0.3%)
Czech: 31 (0.3%)
Australian: 29 (0.3%)
Brazilian: 28 (0.2%)
South African: 20 (0.2%)
Israeli: 19 (0.2%)
Bulgarian: 16 (0.1%)
Jamaican: 14 (0.1%)
Slovak: 11 (0.10%)
Icelander: 9 (0.08%)
Lithuanian: 9 (0.08%)
Swiss: 9 (0.08%)
Lebanese: 8 (0.07%)
New Zealander: 8 (0.07%)
Welsh: 8 (0.07%) Most common places of birth for foreign-born residents (%): Canada Punta Gorda:
22.1% (374)Florida:
2.4% (109,132)
Germany Punta Gorda:
7.2% (122)Florida:
1.2% (54,272)
United Kingdom, excluding England and Scotland Punta Gorda:
6.6% (112)Florida:
0.7% (34,227)
Guyana Punta Gorda:
5.9% (100)Florida:
0.7% (33,556)
Iran Punta Gorda:
4.8% (81)Florida:
0.2% (11,000)
Cuba Punta Gorda:
3.8% (65)Florida:
22.0% (1,006,576)
England Punta Gorda:
3.6% (61)Florida:
0.8% (37,723)
Philippines Punta Gorda:
3.5% (60)Florida:
1.8% (84,403)
Ireland Punta Gorda:
3.4% (58)Florida:
0.2% (9,421)
Thailand Punta Gorda:
2.9% (49)Florida:
0.3% (12,303)
Italy Punta Gorda:
2.8% (47)Florida:
0.7% (30,755)
Guatemala Punta Gorda:
2.5% (43)Florida:
2.1% (97,632)
Sweden Punta Gorda:
2.5% (42)Florida:
0.1% (4,700)
Japan Punta Gorda:
2.2% (38)Florida:
0.2% (10,425)
Egypt Punta Gorda:
2.2% (37)Florida:
0.3% (13,998)
Dominican Republic Punta Gorda:
1.9% (32)Florida:
3.0% (137,727)
Ecuador Punta Gorda:
1.7% (28)Florida:
1.2% (54,585)
Chile Punta Gorda:
1.6% (27)Florida:
0.5% (22,715)
Place of birth for U.S.-born residents:
This state: 2,939Other state: 15,944Northeast: 7,194Midwest: 5,716South: 2,181West: 840 85.9% of Punta Gorda residents lived in the same house 1 years ago.
Out of people who lived in different houses, 16.5% lived in this county.
Out of people who lived in different counties, 41.0% lived in Florida.
Punta Gorda:
85.9%State average:
86.3%
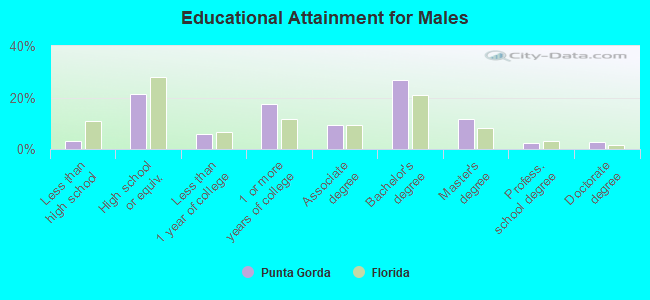
Education attainment for males 25 years and older:
No schooling: 43Nursery to 4th grade: 95th and 6th grade: 07th and 8th grade: 69th grade: 1310th grade: 7011th grade: 4312th grade, no diploma: 85High school graduate (or equivalency): 1,902Less than 1 year of college: 518Some college more than 1 year, no degree: 1,544Associate degree: 821Bachelor's degree: 2,384Master's degree: 1,030Professional school degree: 219Doctorate degree: 231
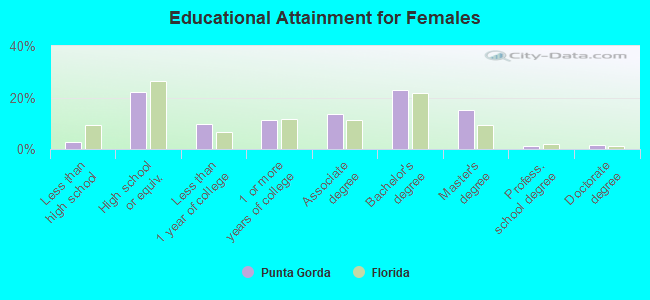
Education attainment for females 25 years and older:
No schooling: 11Nursery to 4th grade: 05th and 6th grade: 07th and 8th grade: 199th grade: 3310th grade: 4911th grade: 912th grade, no diploma: 160High school graduate (or equivalency): 2,142Less than 1 year of college: 932Some college more than 1 year, no degree: 1,087Associate degree: 1,304Bachelor's degree: 2,208Master's degree: 1,487Professional school degree: 117Doctorate degree: 151
Housing units in structures:
One, detached: 7,952One, attached: 648Two: 2453 or 4: 9565 to 9: 93810 to 19: 1,02620 to 49: 95850 or more: 403Mobile homes: 988Boats, RVs, vans, etc.: 12Median worth of mobile homes: $121,807
Housing units lacking complete plumbing facilities in 2022: 0.4%Housing units lacking complete kitchen facilities in 2022: 0.8%House/condo owner moved in on average 10 years ago
Renter moved in on average 1 years ago
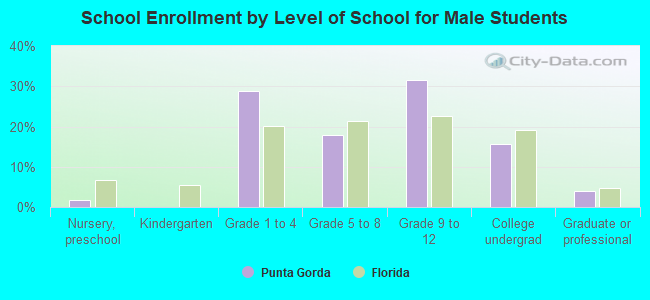
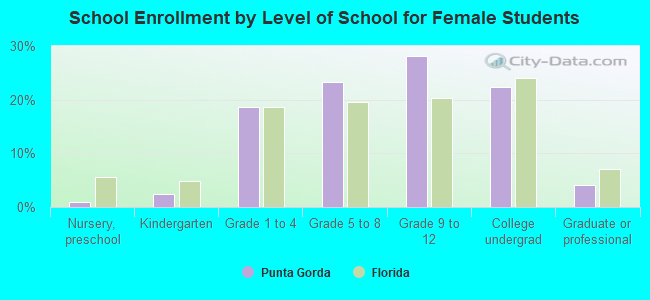
Private vs. public school enrollment:
Students in private schools in grades 1 to 8 (elementary and middle school): 171 Students in private schools in grades 9 to 12 (high school): 33 Students in private undergraduate colleges: 21