Quail Valley, CA (California) Houses and Residents
| Quail Valley: | $315,138 |
| California: | $715,900 |
Total population: 2,161 (Urban population: 1,679, Rural population: 77 (all nonfarm))
Houses: 525 (472 occupied: 347 owner occupied, 125 renter occupied)
| % of renters here: | 26% |
| State: | 44% |
Housing density: 419 houses/condos per square mile
Median price asked for vacant for-sale houses and condos in 2022 in this county: $550,307.
Median contract rent in 2022: $1,344 (lower quartile is $1,122, upper quartile is $1,637)
Median rent asked for vacant for-rent units in 2022: $1,690
Median gross rent in Quail Valley, CA in 2022: $1,690
Housing units in Quail Valley with a mortgage: 262 (28 second mortgage, 0 home equity loan, 0 both second mortgage and home equity loan)
Houses without a mortgage: 68


 | To all of you who say/think that about the IE... (168 replies) |
| Menifee, Murrieta, Temecula mentality (92 replies) |
| Best area to buy a home, san Gabriel, Hemet or Apple Valley. (21 replies) |
| What is the deal with Temecula, CA? (163 replies) |
| Wondering about Quail Valley? (3 replies) |
| Why did you move or going to move to Inland Empire ? (42 replies) |

Household type by relationship:
Households: 2,153,812- In family households: 1,916,707 (357,691 male householders, 152,550 female householders)
376,381 spouses, 728,028 children (675,451 natural, 15,499 adopted, 37,078 stepchildren), 69,455 grandchildren, 34,232 brothers or sisters, 33,896 parents, foster children, 57,727 other relatives, 76,462 non-relatives
- In nonfamily households: 237,105 (84,686 male householders (58,397 living alone)), 91,333 female householders (74,097 living alone)), 61,086 nonrelatives
- In group quarters: 35,829 (20,862 institutionalized population)
308,692 married couples with children.
98,911 single-parent households (26,262 men, 72,649 women).
51.7% of residents of Quail Valley speak English at home.
48.3% of residents speak Spanish at home (32% speak English very well, 34% speak English well, 23% speak English not well, 12% don't speak English at all).
Foreign born population: 1,086 (38.6%)
(43.0% of them are naturalized citizens)
| Here: | 4.9 |
| State: | 6.0 |
| Here: | 5.7 |
| State: | 3.9 |

- Bedrooms in owner-occupied houses and condos in Quail Valley, California
- 6no bedroom
- 921 bedroom
- 1232 bedrooms
- 1173 bedrooms
- 94 bedrooms
- 05+ bedrooms

- Bedrooms in renter-occupied apartments in Quail Valley, California
- 9no bedroom
- 181 bedroom
- 602 bedrooms
- 383 bedrooms
- 04 bedrooms
- 05+ bedrooms

- Cars and other vehicles available in Quail Valley in owner-occupied houses/condos
- 0no vehicle
- 961 vehicle
- 1202 vehicles
- 883 vehicles
- 204 vehicles
- 235+ vehicles

- Cars and other vehicles available in Quail Valley in renter-occupied apartments
- 0no vehicle
- 701 vehicle
- 342 vehicles
- 103 vehicles
- 114 vehicles
- 05+ vehicles

- Rooms in owner-occupied houses in Quail Valley, California
- 01 room
- 402 rooms
- 993 rooms
- 484 rooms
- 765 rooms
- 526 rooms
- 327 rooms
- 08 rooms
- 09+ rooms

- Rooms in renter-occupied apartments in Quail Valley, California
- 91 room
- 182 rooms
- 03 rooms
- 434 rooms
- 355 rooms
- 206 rooms
- 07 rooms
- 08 rooms
- 09+ rooms


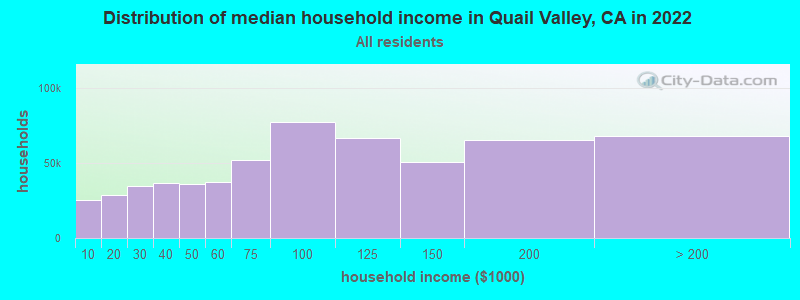
Quail Valley, CA household income distribution

- 25,391Less than $10,000
- 28,715$10,000 to $19,999
- 34,657$20,000 to $29,999
- 36,826$30,000 to $39,999
- 36,371$40,000 to $49,999
- 37,403$50,000 to $59,999
- 52,372$60,000 to $74,999
- 77,499$75,000 to $99,999
- 66,695$100,000 to $124,999
- 51,011$125,000 to $149,999
- 65,174$150,000 to $199,999
- 68,199$200,000 or more
Percentage of workers working in this county: 74.5%
Number of people working at home: 130 (11.6% of all workers)
Travel time to work (commute)
- Less than 5 minutes: 0
- 5 to 9 minutes: 20
- 10 to 14 minutes: 53
- 15 to 19 minutes: 14
- 20 to 24 minutes: 103
- 25 to 29 minutes: 19
- 30 to 34 minutes: 81
- 35 to 39 minutes: 32
- 40 to 44 minutes: 31
- 45 to 59 minutes: 74
- 60 to 89 minutes: 123
- 90 or more minutes: 25
Means of transportation to work:
- Drove a car alone: 364 (61.6%)
- Carpooled: 170 (28.8%)
- Walked: 20 (3.4%)
- Other means: 21 (3.6%)
- Worked at home: 16 (2.7%)


- Year of entry for the foreign-born population in Quail Valley, California
- 851995 to March 2000
- 2231990 to 1994
- 921985 to 1989
- 861980 to 1984
- 361975 to 1979
- 191970 to 1974
- 271965 to 1969
- 19Before 1965
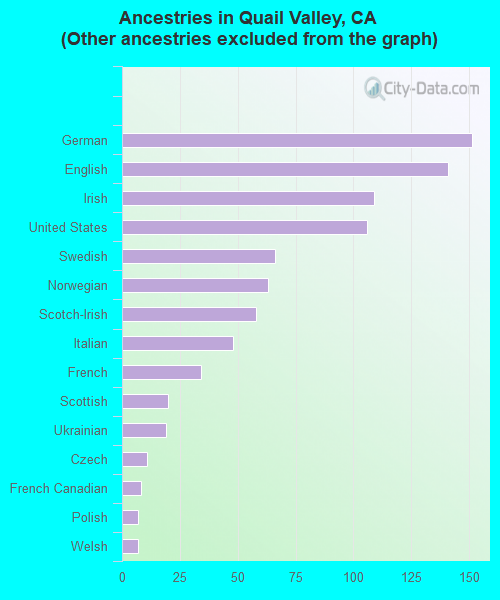
First ancestries reported:
- Other: 1,040 (55.1%)
- German: 151 (8.0%)
- English: 141 (7.5%)
- Irish: 109 (5.8%)
- United States: 106 (5.6%)
- Swedish: 66 (3.5%)
- Norwegian: 63 (3.3%)
- Scotch-Irish: 58 (3.1%)
- Italian: 48 (2.5%)
- French: 34 (1.8%)
- Scottish: 20 (1.1%)
- Ukrainian: 19 (1.0%)
- Czech: 11 (0.6%)
- French Canadian: 8 (0.4%)
- Polish: 7 (0.4%)
- Welsh: 7 (0.4%)
Most common places of birth for foreign-born residents (%):
| Quail Valley: | 98.5% (578) |
| California: | 44.3% (3,928,701) |
| Quail Valley: | 1.5% (9) |
| California: | 2.4% (211,458) |
Place of birth for U.S.-born residents:
- This state: 901
- Other state: 260
- Northeast: 18
- Midwest: 110
- South: 82
- West: 50
43% of Quail Valley residents lived in the same house 5 years ago.
Out of people who lived in different houses, 69% lived in this county.
Out of people who lived in different counties, 95% lived in California.
Education attainment for males 25 years and older:
- No schooling: 52
- Nursery to 4th grade: 31
- 5th and 6th grade: 40
- 7th and 8th grade: 19
- 9th grade: 9
- 10th grade: 12
- 11th grade: 16
- 12th grade, no diploma: 30
- High school graduate (or equivalency): 131
- Less than 1 year of college: 28
- Some college more than 1 year, no degree: 67
- Associate degree: 44
- Bachelor's degree: 0
- Master's degree: 0
- Professional school degree: 9
- Doctorate degree: 0

Education attainment for females 25 years and older:
- No schooling: 60
- Nursery to 4th grade: 15
- 5th and 6th grade: 54
- 7th and 8th grade: 0
- 9th grade: 7
- 10th grade: 7
- 11th grade: 27
- 12th grade, no diploma: 26
- High school graduate (or equivalency): 153
- Less than 1 year of college: 35
- Some college more than 1 year, no degree: 26
- Associate degree: 6
- Bachelor's degree: 21
- Master's degree: 0
- Professional school degree: 0
- Doctorate degree: 0


Housing units in structures:
- One, detached: 469
- One, attached: 18
- Mobile homes: 31
- Boats, RVs, vans, etc.: 7
Median worth of mobile homes: $242,885


- 69.5%Bottled, tank, or LP gas
- 23.1%Electricity
- 6.1%Wood
- 1.4%Utility gas
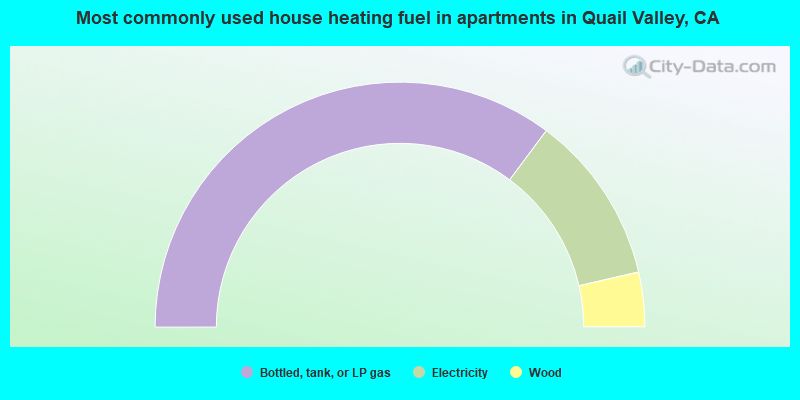
- 70.4%Bottled, tank, or LP gas
- 22.4%Electricity
- 7.2%Wood
Private vs. public school enrollment:
| Here: | 1.9% |
| California: | 9.9% |
| Here: | 3.3% |
| California: | 7.8% |
| Here: | 39.4% |
| California: | 15.4% |


