Queenstown, MD (Maryland) Houses and Residents
| Queenstown: | $351,542 |
| Maryland: | $398,100 |
Mean price in 2022:
Detached houses: $417,656
Here: $417,656 State: $526,819 Townhouses or other attached units: $362,734
Here: $362,734 State: $328,305
Total population: 656 (Urban population: 609 (all inside urban clusters), Rural population: 8 (all nonfarm))
Houses: 308 (276 occupied: 198 owner occupied, 80 renter occupied)
| % of renters here: | 29% |
| State: | 32% |
Housing density: 750 houses/condos per square mile
Median price asked for vacant for-sale houses and condos in 2022 in this county: $570,420.
Median contract rent in 2022: $1,332 (lower quartile is $1,117, upper quartile is $1,521)
Median rent asked for vacant for-rent units in 2022: $1,347
Median gross rent in Queenstown, MD in 2022: $1,682
Housing units in Queenstown with a mortgage: 133 (4 second mortgage, 0 home equity loan, 4 both second mortgage and home equity loan)
Houses without a mortgage: 0
Median household income for houses/condos with a mortgage: $106,543
Median household income for apartments without a mortgage: $68,778
Median monthly housing costs: $1,537
Compare current foreclosures near Queenstown, MD:
| Photo | Address | Area | Beds / Baths | Price | Details |
|---|---|---|---|---|---|

|
#1
Grason Vista Dr
Queenstown, MD 21658
|
3,410 sq. feet
|
2 baths - beds |
show details | |

|
#2
Overlook Dr
Queenstown, MD 21658
|
2,270 sq. feet
|
2 baths - beds |
show details | |

|
#3
River Run
Queenstown, MD 21658
|
2,576 sq. feet
|
2 baths - beds |
show details | |

|
#4
Overlook Dr
Queenstown, MD 21658
|
2,624 sq. feet
|
2 baths - beds |
show details | |

|
#5
Slippery Hill Ln
Queenstown, MD 21658
|
1,490 sq. feet
|
2 baths - beds |
show details | |

|
#6
Marlborough Rd
Queenstown, MD 21658
|
- sq. feet
|
- baths - beds |
show details | |

|
#7
Skipton Cordova Rd
Cordova, MD 21625
|
1,256 sq. feet
|
2 baths 2 beds |
$128,250
|
show details |

|
#8
Waterview Ln
Chestertown, MD 21620
|
2,153 sq. feet
|
2 baths 2 beds |
$310,000
|
show details |

|
#9
Leontyne Pl
Easton, MD 21601
|
1,641 sq. feet
|
2 baths 3 beds |
show details | |

|
#10
Sampson Ln
Grasonville, MD 21638
|
2,445 sq. feet
|
2 baths 4 beds |
show details |
| Photo | Address | Area | Beds / Baths | Price | Details |
|---|---|---|---|---|---|

|
#11
Hillsboro Rd
Hillsboro, MD 21641
|
1,668 sq. feet
|
2 baths 4 beds |
show details | |

|
#12
Duke Of Kent St
Chestertown, MD 21620
|
1,556 sq. feet
|
2 baths 3 beds |
show details | |

|
#13
Rock Hall Ave
Rock Hall, MD 21661
|
2,414 sq. feet
|
2 baths - beds |
show details | |

|
#14
Petunia Dr
Easton, MD 21601
|
2,200 sq. feet
|
1 baths - beds |
show details | |

|
#15
Secretariat Dr
Annapolis, MD 21409
|
1,160 sq. feet
|
1 baths - beds |
show details | |

|
#16
Cananaro Ct
Annapolis, MD 21409
|
2,154 sq. feet
|
2 baths - beds |
show details | |

|
#17
Lister Ln
Ridgely, MD 21660
|
2,448 sq. feet
|
2 baths - beds |
show details | |

|
#18
Bentley Ave
Saint Michaels, MD 21663
|
1,450 sq. feet
|
2 baths - beds |
show details | |

|
#19
Hillsboro Rd
Denton, MD 21629
|
1,716 sq. feet
|
1 baths - beds |
show details | |

|
#20
Walnut St
Church Hill, MD 21623
|
1,848 sq. feet
|
1 baths - beds |
show details |
| Photo | Address | Area | Beds / Baths | Price | Details |
|---|---|---|---|---|---|

|
#21
Chapel Rd
Cordova, MD 21625
|
1,160 sq. feet
|
1 baths - beds |
show details | |

|
#22
Church Hill Rd
Centreville, MD 21617
|
1,184 sq. feet
|
1 baths - beds |
show details | |

|
#23
Black Dog Aly
Easton, MD 21601
|
1,712 sq. feet
|
2 baths - beds |
show details | |

|
#24
Upland Ln
Centreville, MD 21617
|
4,948 sq. feet
|
3 baths - beds |
show details | |

|
#25
Allen Ave
Stevensville, MD 21666
|
1,708 sq. feet
|
2 baths - beds |
show details | |

|
#26
Kentmorr Rd
Stevensville, MD 21666
|
2,076 sq. feet
|
2 baths - beds |
show details | |

|
#27
Windy Acres Farm Ln
Centreville, MD 21617
|
2,309 sq. feet
|
3 baths - beds |
show details | |

|
#28
Central Ave
Ridgely, MD 21660
|
1,248 sq. feet
|
2 baths - beds |
show details | |

|
#29
South St
Easton, MD 21601
|
864 sq. feet
|
1 baths - beds |
show details | |

|
#30
Colony Cir
Easton, MD 21601
|
1,920 sq. feet
|
2 baths - beds |
show details |
| Photo | Address | Area | Beds / Baths | Price | Details |
|---|---|---|---|---|---|

|
#31
Waverly Rd
Easton, MD 21601
|
2,102 sq. feet
|
1 baths - beds |
show details | |

|
#32
Saint Margarets Rd
Annapolis, MD 21409
|
1,546 sq. feet
|
1 baths - beds |
show details | |

|
#33
Middletown Rd
Annapolis, MD 21409
|
2,184 sq. feet
|
2 baths - beds |
show details | |

|
#34
Sudlersville Rd
Sudlersville, MD 21668
|
2,412 sq. feet
|
2 baths - beds |
show details | |

|
#35
W Lake Dr
Annapolis, MD 21403
|
4,452 sq. feet
|
5 baths - beds |
show details | |

|
#36
Fairway Dr
Annapolis, MD 21409
|
1,460 sq. feet
|
2 baths - beds |
show details | |

|
#37
Cumberland St
Chestertown, MD 21620
|
880 sq. feet
|
1 baths - beds |
show details | |

|
#38
Tour Dr
Easton, MD 21601
|
1,756 sq. feet
|
2 baths - beds |
show details | |

|
#39
Ramblewood Ct
Annapolis, MD 21409
|
1,760 sq. feet
|
2 baths - beds |
show details | |

|
#40
Orchard Dr
Chestertown, MD 21620
|
3,315 sq. feet
|
3 baths - beds |
show details |
| Photo | Address | Area | Beds / Baths | Price | Details |
|---|---|---|---|---|---|

|
#41
Pleasant Aly
Easton, MD 21601
|
1,008 sq. feet
|
1 baths - beds |
show details | |

|
#42
Duke Of Kent St
Chestertown, MD 21620
|
1,606 sq. feet
|
2 baths - beds |
show details | |

|
#43
Old Fairlee Rd
Chestertown, MD 21620
|
1,912 sq. feet
|
1 baths - beds |
show details | |

|
#44
Penny Ln
Easton, MD 21601
|
1,520 sq. feet
|
2 baths - beds |
show details | |

|
#45
Commanders Way S
Annapolis, MD 21409
|
1,280 sq. feet
|
1 baths - beds |
show details | |

|
#46
Hampton Rd
Annapolis, MD 21409
|
2,254 sq. feet
|
2 baths - beds |
show details | |

|
#47
Wye Oak St
Easton, MD 21601
|
2,060 sq. feet
|
2 baths - beds |
show details | |

|
#48
Longwoods Rd
Easton, MD 21601
|
2,266 sq. feet
|
3 baths - beds |
show details | |

|
#49
South St
Easton, MD 21601
|
1,008 sq. feet
|
1 baths - beds |
show details | |

|
Check over 1 million property listings on Foreclosure.com!
|
browse all offers | |||

Latest news about housing in Queenstown, MD collected exclusively by city-data.com from local newspapers, TV, and radio stations

 | How are things around Queenstown, MD (22 replies) |
| Annapolis to Queenstown (5 replies) |
| Possible relocation to Stevensville/Kent Island area. Advice? (15 replies) |
| Grasonville MD eastern shore (6 replies) |
| Experience at Tanger Outlet National Harbor (3 replies) |
| Who is leaving Maryland?? (181 replies) |

Median year apartment built: 1977
Household type by relationship:
Households: 815- Male householders: 158 (20 living alone), Female householders: 115 (48 living alone)
154 spouses (154 opposite-sex spouses), 55 unmarried partners, (55 opposite-sex unmarried partners), 223 children (149 natural, 68 adopted, 6 stepchildren), 58 grandchildren, 0 brothers or sisters, 5 parents, 0 foster children, 17 other relatives, 30 non-relatives
Size of family households: 82 2-persons, 38 3-persons, 38 4-persons, 16 5-persons, 9 6-persons.
Size of nonfamily households: 71 1-person, 16 2-persons, 6 5-persons.
100 married couples with children.
80 single-parent households (77 men, 3 women).
80.7% of residents of Queenstown speak English at home.
18.1% of residents speak Spanish at home (49% speak English very well, 19% speak English well, 33% speak English not well).
0.1% of residents speak other Indo-European language at home (100% speak English well).
0.6% of residents speak Asian or Pacific Island language at home (100% speak English very well).
Foreign born population: 92 (11.3%)
(29.3% of them are naturalized citizens)
| Here: | 6.1 |
| State: | 7.3 |
| Here: | 4.8 |
| State: | 4.2 |

- Bedrooms in owner-occupied houses and condos in Queenstown, Maryland
- 0no bedroom
- 41 bedroom
- 452 bedrooms
- 1123 bedrooms
- 274 bedrooms
- 115+ bedrooms

- Bedrooms in renter-occupied apartments in Queenstown, Maryland
- 0no bedroom
- 61 bedroom
- 272 bedrooms
- 433 bedrooms
- 24 bedrooms
- 35+ bedrooms

- Cars and other vehicles available in Queenstown in owner-occupied houses/condos
- 8no vehicle
- 491 vehicle
- 952 vehicles
- 373 vehicles
- 24 vehicles
- 75+ vehicles

- Cars and other vehicles available in Queenstown in renter-occupied apartments
- 0no vehicle
- 131 vehicle
- 442 vehicles
- 223 vehicles
- 24 vehicles
- 05+ vehicles

- Rooms in owner-occupied houses in Queenstown, Maryland
- 01 room
- 02 rooms
- 23 rooms
- 294 rooms
- 425 rooms
- 466 rooms
- 127 rooms
- 278 rooms
- 419+ rooms

- Rooms in renter-occupied apartments in Queenstown, Maryland
- 01 room
- 32 rooms
- 33 rooms
- 294 rooms
- 145 rooms
- 166 rooms
- 87 rooms
- 78 rooms
- 09+ rooms


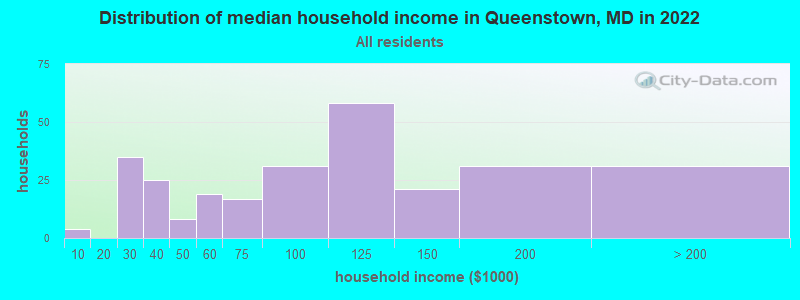
Queenstown, MD household income distribution

- 4Less than $10,000
- 35$20,000 to $29,999
- 25$30,000 to $39,999
- 8$40,000 to $49,999
- 19$50,000 to $59,999
- 17$60,000 to $74,999
- 31$75,000 to $99,999
- 58$100,000 to $124,999
- 21$125,000 to $149,999
- 31$150,000 to $199,999
- 31$200,000 or more
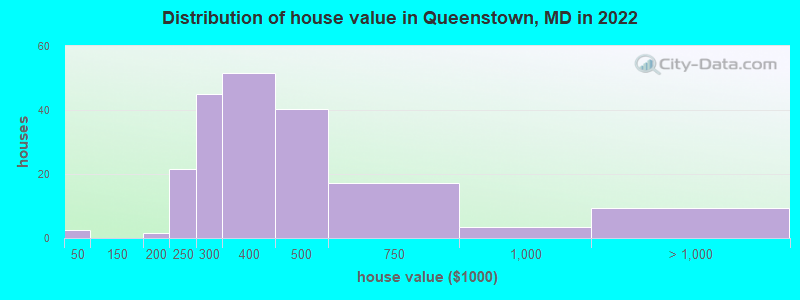
Home value of owner - occupied houses in 2022 in Queenstown, MD
-
- 2$15,000 to $19,999
- 1$175,000 to $199,999
- 21$200,000 to $249,999
- 45$250,000 to $299,999
- 51$300,000 to $399,999
- 40$400,000 to $499,999
- 17$500,000 to $749,999
- 3$750,000 to $999,999
- 9$1,500,000 to $1,999,999
Rent paid by renters in 2022 in Queenstown, MD
-
- 7$800 to $899
- 7$900 to $999
- 11$1,000 to $1,249
- 33$1,250 to $1,499
- 18$1,500 to $1,999
- 1$2,000 to $2,499
- 2No cash rent


Percentage of workers working in this county: 52.1%
Number of people working at home: 34 (10.1% of all workers)
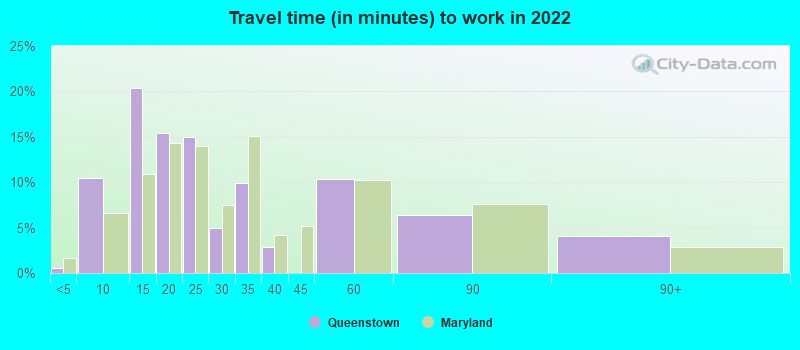
Travel time to work (commute)
- Less than 5 minutes: 3
- 5 to 9 minutes: 19
- 10 to 14 minutes: 32
- 15 to 19 minutes: 44
- 20 to 24 minutes: 6
- 25 to 29 minutes: 57
- 30 to 34 minutes: 38
- 35 to 39 minutes: 22
- 40 to 44 minutes: 6
- 45 to 59 minutes: 23
- 60 to 89 minutes: 27
- 90 or more minutes: 14
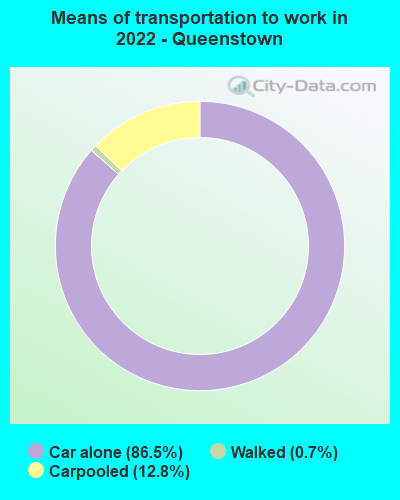
Means of transportation to work:
- Drove a car alone: 705 (79.3%)
- Carpooled: 110 (12.4%)
- Walked: 5 (0.6%)
- Worked at home: 34 (3.8%)

- Unemployment by race in 2022
- Unemployment rate for White non-Hispanic residents
- 5.8%Males
- 4.2%Females

- Year of entry for the foreign-born population in Queenstown, Maryland
- 262010 or later
- 222000 to 2009
- 391990 to 1999
- 01980 to 1989
- 131970 to 1979
- 10Before 1970

First ancestries reported:
- English: 49 (9.8%)
- German: 34 (6.8%)
- American: 27 (5.4%)
- Irish: 24 (4.8%)
- Scottish: 17 (3.4%)
- European: 7 (1.4%)
- Italian: 7 (1.4%)
- French: 6 (1.2%)
- British: 5 (1.0%)
- Northern European: 5 (1.0%)
- Polish: 4 (0.8%)
- Norwegian: 3 (0.6%)
- Ukrainian: 3 (0.6%)
- Scotch-Irish: 2 (0.4%)
- Eastern European: 1 (0.2%)
Most common places of birth for foreign-born residents (%):
| Queenstown: | 43.5% (40) |
| Maryland: | 4.4% (42,350) |
| Queenstown: | 22.8% (21) |
| Maryland: | 1.8% (17,161) |
| Queenstown: | 15.2% (14) |
| Maryland: | 3.5% (34,065) |
| Queenstown: | 3.3% (3) |
| Maryland: | 0.3% (2,475) |
| Queenstown: | 2.2% (2) |
| Maryland: | 0.7% (6,724) |
| Queenstown: | 2.2% (2) |
| Maryland: | 1.3% (12,898) |
Place of birth for U.S.-born residents:
- This state: 503
- Other state: 212
- Northeast: 97
- Midwest: 10
- South: 74
- West: 31
85.4% of Queenstown residents lived in the same house 1 years ago.
Out of people who lived in different houses, 36.5% lived in this county.
Out of people who lived in different counties, 89.1% lived in Maryland.
| Queenstown: | 85.4% |
| State average: | 88.5% |
Education attainment for males 25 years and older:
- No schooling: 12
- Nursery to 4th grade: 2
- 5th and 6th grade: 16
- 7th and 8th grade: 0
- 9th grade: 1
- 10th grade: 0
- 11th grade: 3
- 12th grade, no diploma: 0
- High school graduate (or equivalency): 68
- Less than 1 year of college: 8
- Some college more than 1 year, no degree: 30
- Associate degree: 6
- Bachelor's degree: 59
- Master's degree: 37
- Professional school degree: 4
- Doctorate degree: 7

Education attainment for females 25 years and older:
- No schooling: 10
- Nursery to 4th grade: 7
- 5th and 6th grade: 0
- 7th and 8th grade: 0
- 9th grade: 0
- 10th grade: 1
- 11th grade: 0
- 12th grade, no diploma: 0
- High school graduate (or equivalency): 82
- Less than 1 year of college: 22
- Some college more than 1 year, no degree: 46
- Associate degree: 5
- Bachelor's degree: 67
- Master's degree: 28
- Professional school degree: 7
- Doctorate degree: 7


Housing units in structures:
- One, detached: 250
- One, attached: 25
- 3 or 4: 32
Housing units lacking complete kitchen facilities in 2022: 5.2%
House/condo owner moved in on average 9 years ago
Renter moved in on average 1 years ago

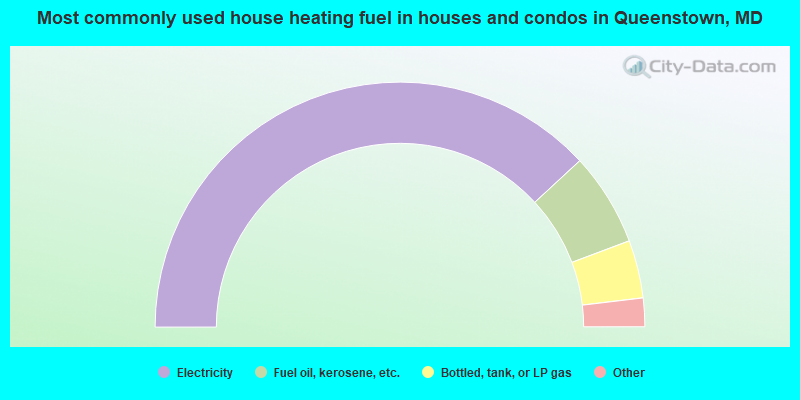
- 76.8%Electricity
- 12.4%Fuel oil, kerosene, etc.
- 7.7%Bottled, tank, or LP gas
- 2.1%Wood
- 1.0%Other fuel
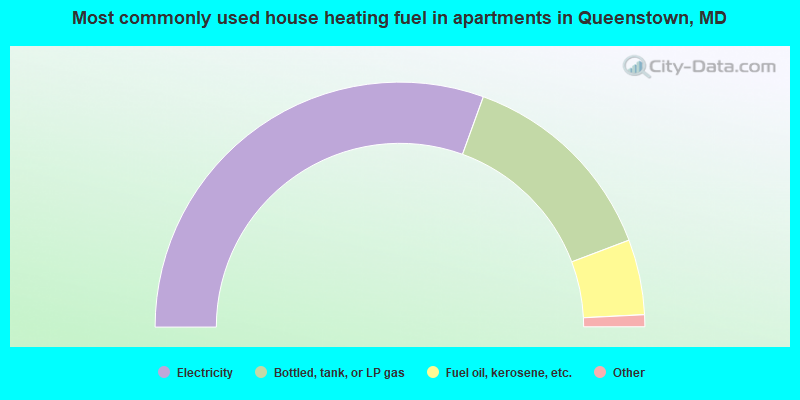
- 62.0%Electricity
- 27.8%Bottled, tank, or LP gas
- 10.1%Fuel oil, kerosene, etc.
Private vs. public school enrollment:
| Here: | 9.1% |
| Maryland: | 15.2% |
| Here: | 44.0% |
| Maryland: | 14.4% |
| Here: | 0.0% |
| Maryland: | 20.2% |


