Raleigh, NC (North Carolina) Houses and Residents
Estimated median house or condo value in 2022: $430,600 (it was $152,400 in 2000 )
Raleigh:
$430,600North Carolina:
$280,600
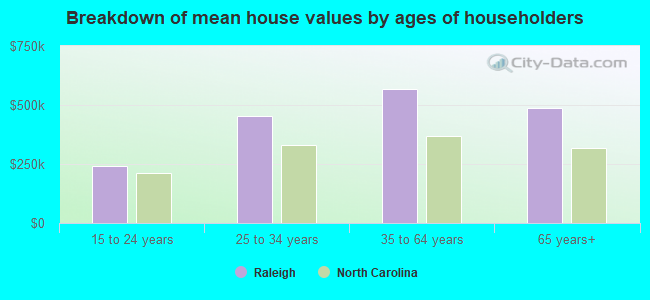
Lower value quartile - upper value quartile: $310,100 - $639,400Mean price in 2022: Detached houses: $484,153 Here:
$484,153State:
$375,326
Townhouses or other attached units: $303,811 Here:
$303,811State:
$317,935
In 2-unit structures: $389,767 Here:
$389,767State:
$250,488
In 3-to-4-unit structures: $209,910 Here:
$209,910State:
$254,939
In 5-or-more-unit structures: $394,172 Here:
$394,172State:
$329,290
Mobile homes: $46,712 Here:
$46,712State:
$124,933
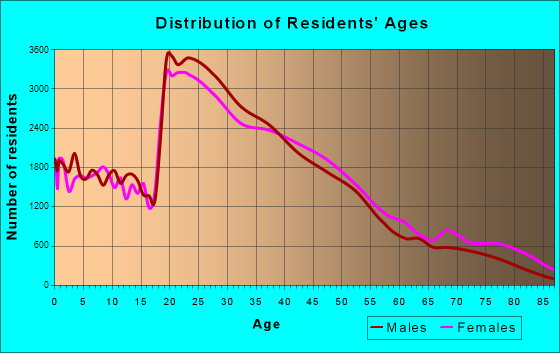
Total population: 439,896 (Urban population: 276,059, Rural population: 520 (all nonfarm) )
Houses: 225,320 (195,414 occupied: 98,845 owner occupied, 96,569 renter occupied )
% of renters here:
49%State:
33%
Housing density: 1,966 houses/condos per square mile
Median price asked for vacant for-sale houses and condos in 2022: $387,389.
Median contract rent in 2022: $1,309 (lower quartile is $1,024, upper quartile is $1,657)
Median rent asked for vacant for-rent units in 2022: $2,328
Median gross rent in Raleigh, NC in 2022: $1,434
Housing units in Raleigh with a mortgage: 73,553 (9,342 second mortgage, 236 home equity loan, 8,280 both second mortgage and home equity loan )Houses without a mortgage: 1,368
Median household income for houses/condos with a mortgage: $127,524
Median household income for apartments without a mortgage: $80,135
Median monthly housing costs: $1,446
Data:
Median house or condo value ($)
Median house or condo value ($ change since 2000)
Median house or condo value ($) - White
Median house or condo value ($) - Black or African American
Median house or condo value ($) - Asian
Median house or condo value ($) - Hispanic or Latino
Median house or condo value ($) - American Indian and Alaska Native
Median house or condo value ($) - Multirace
Median house or condo value ($) - Other Race
Median price asked for mobile homes ($)
Household density (households per square mile)
Mean house or condo value by units in structure - 1, detached ($)
Mean house or condo value by units in structure - 1, attached ($)
Mean house or condo value by units in structure - 2 ($)
Mean house or condo value by units in structure by units in structure - 3 or 4 ($)
Mean house or condo value by units in structure - 5 or more ($)
Mean house or condo value by units in structure - Boat, RV, van, etc. ($)
Mean house or condo value by units in structure - Mobile home ($)
Median contract rent ($)
Median contract rent - Lower quartile ($)
Median contract rent - Upper quartile ($)
Median gross rent ($)
Urban houses (%)
Rural houses (%)
Houses occupied (%)
Houses occupied (% change since 2000)
Houses owner occupied (%)
Houses owner occupied (% change since 2000)
Houses renter occupied (%)
Houses renter occupied (% change since 2000)
Vacant housing units - For rent (%)
Vacant housing units - For rent (% change since 2000)
Vacant housing units - For sale only (%)
Vacant housing units - For sale only (% change since 2000)
Vacant housing units - Rented or sold, not occupied (%)
Vacant housing units - Rented or sold, not occupied (% change since 2000)
Vacant housing units - For seasonal, recreational, or occasional use (%)
Vacant housing units - For seasonal, recreational, or occasional use (% change since 2000)
Vacant housing units - For migrant workers (%)
Vacant housing units - For migrant workers (% change since 2000)
Vacant housing units - Other vacant (%)
Vacant housing units - Other vacant (% change since 2000)
Median monthly housing costs ($)
Median household income for houses/condos with a mortgage ($)
Median household income for houses/condos without a mortgage ($)
Median household income ($)
Median household income ($) - White
Median household income ($) - Black or African American
Median household income ($) - Asian
Median household income ($) - Hispanic or Latino
Median household income ($) - American Indian and Alaska Native
Median household income ($) - Multirace
Median household income ($) - Other Race
Mortgage status - with mortgage (%)
Mortgage status - with second mortgage (%)
Mortgage status - with home equity loan (%)
Mortgage status - with both second mortgage and home equity loan (%)
Mortgage status - without a mortgage (%)
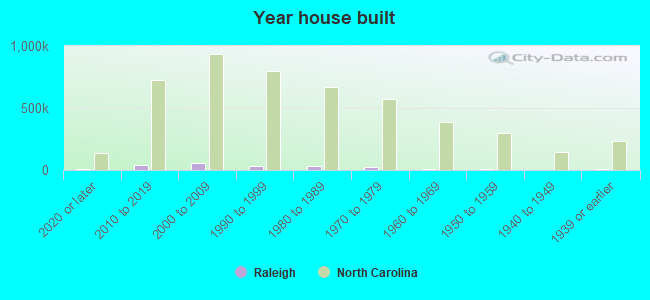
Median year house/condo built
Median year apartment built
Household type by relationship - Male householder living alone (%)
Household type by relationship - Male householder not living alone (%)
Household type by relationship - Female householder living alone (%)
Household type by relationship - Female householder not living alone (%)
Household type by relationship - Opposite-Sex spouse (%)
Household type by relationship - Same-Sex spouse (%)
Household type by relationship - Opposite-Sex unmarried partner (%)
Household type by relationship - Same-Sex unmarried partner (%)
Household type by relationship - In group quarters (%)
Size of family households - 2-person household (%)
Size of family households - 3-person household (%)
Size of family households - 4-person household (%)
Size of family households - 5-person household (%)
Size of family households - 6-person household (%)
Size of family households - 7-or-more-person household (%)
Size of nonfamily households - 1-person household (%)
Size of nonfamily households - 2-person household (%)
Size of nonfamily households - 3-person household (%)
Size of nonfamily households - 4-person household (%)
Size of nonfamily households - 5-person household (%)
Size of nonfamily households - 6-person household (%)
Size of nonfamily households - 7-or-moreperson household (%)
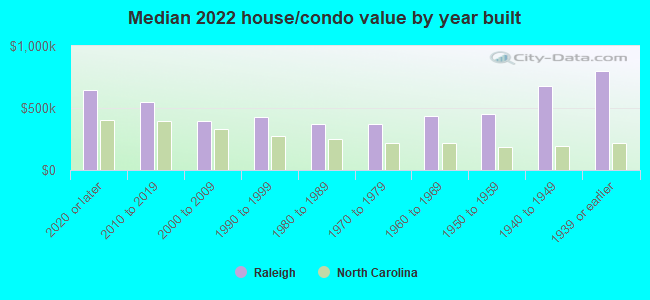
Year house built - Built 2010 or later (%)
Year house built - Built 2000 to 2009 (%)
Year house built - Built 1990 to 1999 (%)
Year house built - Built 1980 to 1989 (%)
Year house built - Built 1970 to 1979 (%)
Year house built - Built 1960 to 1969 (%)
Year house built - Built 1950 to 1959 (%)
Year house built - Built 1940 to 1949 (%)
Year house built - Built 1939 or earlier (%)
Median number of rooms in houses and condos
Median number of rooms in apartments
Median number of bedrooms in owner occupied houses
Mean number of bedrooms in owner occupied houses
Median number of bedrooms in renter occupied houses
Mean number of bedrooms in renter occupied houses
Median number of vehichles in owner occupied houses
Mean number of vehichles in owner occupied houses
Median number of vehichles in renter occupied houses
Mean number of vehichles in renter occupied houses
Rooms in owner-occupied houses - 1 room (%)
Rooms in owner-occupied houses - 2 rooms (%)
Rooms in owner-occupied houses - 3 rooms (%)
Rooms in owner-occupied houses - 4 rooms (%)
Rooms in owner-occupied houses - 5 rooms (%)
Rooms in owner-occupied houses - 6 rooms (%)
Rooms in owner-occupied houses - 7 rooms (%)
Rooms in owner-occupied houses - 8 rooms (%)
Rooms in owner-occupied houses - 9+ rooms (%)
Rooms in renter-occupied houses - 1 room (%)
Rooms in renter-occupied houses - 2 rooms (%)
Rooms in renter-occupied houses - 3 rooms (%)
Rooms in renter-occupied houses - 4 rooms (%)
Rooms in renter-occupied houses - 5 rooms (%)
Rooms in renter-occupied houses - 6 rooms (%)
Rooms in renter-occupied houses - 7 rooms (%)
Rooms in renter-occupied houses - 8 rooms (%)
Rooms in renter-occupied houses - 9+ rooms (%)
Bedrooms in owner-occupied houses - no bedrooms (%)
Bedrooms in owner-occupied houses - 1 bedroom (%)
Bedrooms in owner-occupied houses - 2 bedrooms (%)
Bedrooms in owner-occupied houses - 3 bedrooms (%)
Bedrooms in owner-occupied houses - 4 bedrooms (%)
Bedrooms in owner-occupied houses - 5+ bedrooms (%)
Bedrooms in renter-occupied houses - no bedrooms (%)
Bedrooms in renter-occupied houses - 1 bedroom (%)
Bedrooms in renter-occupied houses - 2 bedrooms (%)
Bedrooms in renter-occupied houses - 3 bedrooms (%)
Bedrooms in renter-occupied houses - 4 bedrooms (%)
Bedrooms in renter-occupied houses - 5+ bedrooms (%)
Vehicles available in owner-occupied houses - no vehicle available (%)
Vehicles available in owner-occupied houses - 1 vehicle available(%)
Vehicles available in owner-occupied houses - 2 Vehicles available (%)
Vehicles available in owner-occupied houses - 3 Vehicles available (%)
Vehicles available in owner-occupied houses - 4 Vehicles available (%)
Vehicles available in owner-occupied houses - 5+ Vehicles available (%)
Vehicles available in renter-occupied houses - no vehicle available (%)
Vehicles available in renter-occupied houses - 1 vehicle available (%)
Vehicles available in renter-occupied houses - 2 Vehicles available (%)
Vehicles available in renter-occupied houses - 3 Vehicles available (%)
Vehicles available in renter-occupied houses - 4 Vehicles available (%)
Vehicles available in renter-occupied houses - 5+ Vehicles available (%)
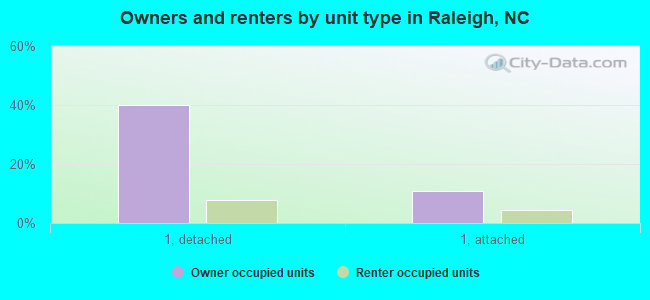
Housing units in structures - 1, detached (%)
Housing units in structures - 1, attached (%)
Housing units in structures - 2 (%)
Housing units in structures - 3 or 4 (%)
Housing units in structures - 5 to 9 (%)
Housing units in structures - 10 to 19 (%)
Housing units in structures - 20 to 49 (%)
Housing units in structures - 50 or more (%)
Housing units in structures - Mobile home (%)
Housing units in structures - Boat, RV, van, etc. (%)
Housing units in structures - Owners - 1, detached (%)
Housing units in structures - Owners - 1, attached (%)
Housing units in structures - Owners - 2 (%)
Housing units in structures - Owners - 3 or 4 (%)
Housing units in structures - Owners - 5 to 9 (%)
Housing units in structures - Owners - 10 to 19 (%)
Housing units in structures - Owners - 20 to 49 (%)
Housing units in structures - Owners - 50 or more (%)
Housing units in structures - Owners - Mobile home (%)
Housing units in structures - Owners - Boat, RV, van, etc. (%)
Housing units in structures - Renters - 1, detached (%)
Housing units in structures - Renters - 1, attached (%)
Housing units in structures - Renters - 2 (%)
Housing units in structures - Renters - 3 or 4 (%)
Housing units in structures - Renters - 5 to 9 (%)
Housing units in structures - Renters - 10 to 19 (%)
Housing units in structures - Renters - 20 to 49 (%)
Housing units in structures - Renters - 50 or more (%)
Housing units in structures - Renters - Mobile home (%)
Housing units in structures - Renters - Boat, RV, van, etc. (%)
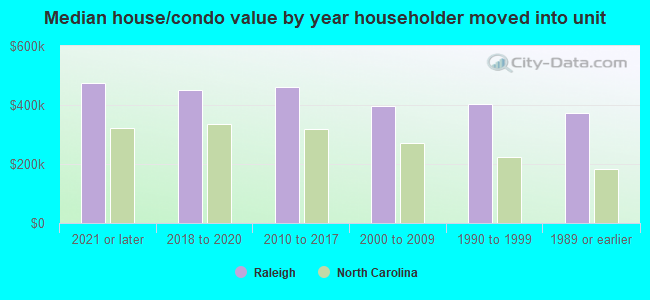
House/condo owner moved in on average (years ago)
Renter moved in on average (years ago)
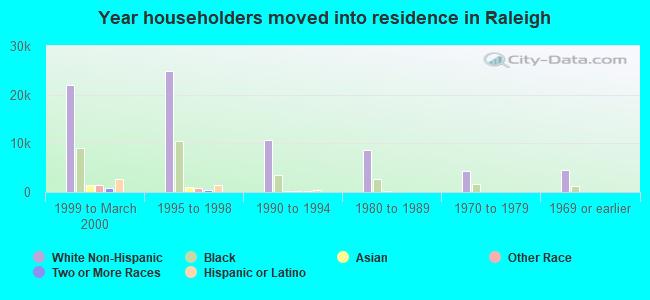
Year householder moved into unit - Moved in 1999 to March 2000 (%)
Year householder moved into unit - Moved in 1999 to March 2000 (%) - White
Year householder moved into unit - Moved in 1999 to March 2000 (%) - Black or African American
Year householder moved into unit - Moved in 1999 to March 2000 (%) - Asian
Year householder moved into unit - Moved in 1999 to March 2000 (%) - Hispanic or Latino
Year householder moved into unit - Moved in 1999 to March 2000 (%) - American Indian and Alaska Native
Year householder moved into unit - Moved in 1999 to March 2000 (%) - Multirace
Year householder moved into unit - Moved in 1999 to March 2000 (%) - Other Race
Year householder moved into unit - Moved in 1995 to 1998 (%)
Year householder moved into unit - Moved in 1995 to 1998 (%) - White
Year householder moved into unit - Moved in 1995 to 1998 (%) - Black or African American
Year householder moved into unit - Moved in 1995 to 1998 (%) - Asian
Year householder moved into unit - Moved in 1995 to 1998 (%) - Hispanic or Latino
Year householder moved into unit - Moved in 1995 to 1998 (%) - American Indian and Alaska Native
Year householder moved into unit - Moved in 1995 to 1998 (%) - Multirace
Year householder moved into unit - Moved in 1995 to 1998 (%) - Other Race
Year householder moved into unit - Moved in 1990 to 1994 (%)
Year householder moved into unit - Moved in 1990 to 1994 (%) - White
Year householder moved into unit - Moved in 1990 to 1994 (%) - Black or African American
Year householder moved into unit - Moved in 1990 to 1994 (%) - Asian
Year householder moved into unit - Moved in 1990 to 1994 (%) - Hispanic or Latino
Year householder moved into unit - Moved in 1990 to 1994 (%) - American Indian and Alaska Native
Year householder moved into unit - Moved in 1990 to 1994 (%) - Multirace
Year householder moved into unit - Moved in 1990 to 1994 (%) - Other Race
Year householder moved into unit - Moved in 1980 to 1989 (%)
Year householder moved into unit - Moved in 1980 to 1989 (%) - White
Year householder moved into unit - Moved in 1980 to 1989 (%) - Black or African American
Year householder moved into unit - Moved in 1980 to 1989 (%) - Asian
Year householder moved into unit - Moved in 1980 to 1989 (%) - Hispanic or Latino
Year householder moved into unit - Moved in 1980 to 1989 (%) - American Indian and Alaska Native
Year householder moved into unit - Moved in 1980 to 1989 (%) - Multirace
Year householder moved into unit - Moved in 1980 to 1989 (%) - Other Race
Year householder moved into unit - Moved in 1970 to 1979 (%)
Year householder moved into unit - Moved in 1970 to 1979 (%) - White
Year householder moved into unit - Moved in 1970 to 1979 (%) - Black or African American
Year householder moved into unit - Moved in 1970 to 1979 (%) - Asian
Year householder moved into unit - Moved in 1970 to 1979 (%) - Hispanic or Latino
Year householder moved into unit - Moved in 1970 to 1979 (%) - American Indian and Alaska Native
Year householder moved into unit - Moved in 1970 to 1979 (%) - Multirace
Year householder moved into unit - Moved in 1970 to 1979 (%) - Other Race
Year householder moved into unit - Moved in 1969 or earlier (%)
Year householder moved into unit - Moved in 1969 or earlier (%) - White
Year householder moved into unit - Moved in 1969 or earlier (%) - Black or African American
Year householder moved into unit - Moved in 1969 or earlier (%) - Asian
Year householder moved into unit - Moved in 1969 or earlier (%) - Hispanic or Latino
Year householder moved into unit - Moved in 1969 or earlier (%) - American Indian and Alaska Native
Year householder moved into unit - Moved in 1969 or earlier (%) - Multirace
Year householder moved into unit - Moved in 1969 or earlier (%) - Other Race
Housing units lacking complete plumbing facilities (%)
Housing units lacking complete kitchen facilities (%)
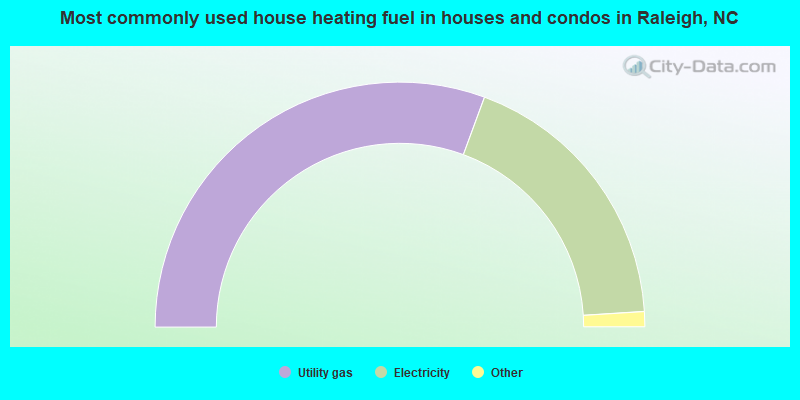
House heating fuel used in houses and condos - Utility gas (%)
House heating fuel used in houses and condos - Bottled, tank, or LP gas (%)
House heating fuel used in houses and condos - Electricity (%)
House heating fuel used in houses and condos - Fuel oil, kerosene, etc. (%)
House heating fuel used in houses and condos - Coal or coke (%)
House heating fuel used in houses and condos - Wood (%)
House heating fuel used in houses and condos - Solar energy (%)
House heating fuel used in houses and condos - Other fuel (%)
House heating fuel used in houses and condos - No fuel used (%)
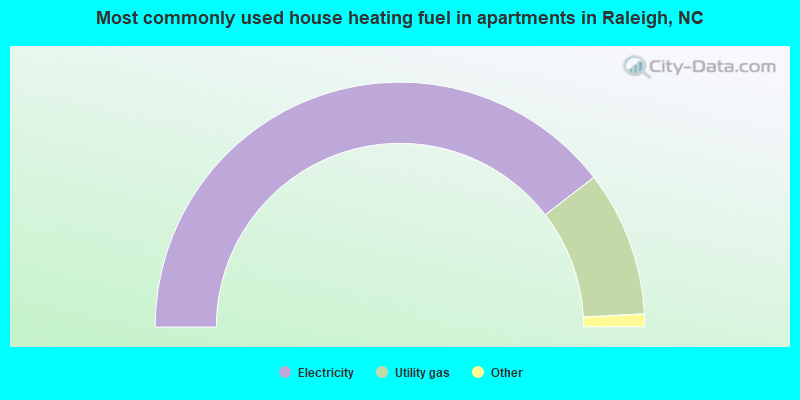
House heating fuel used in apartments - Utility gas (%)
House heating fuel used in apartments - Bottled, tank, or LP gas (%)
House heating fuel used in apartments - Electricity (%)
House heating fuel used in apartments - Fuel oil, kerosene, etc. (%)
House heating fuel used in apartments - Coal or coke (%)
House heating fuel used in apartments - Wood (%)
House heating fuel used in apartments - Solar energy (%)
House heating fuel used in apartments - Other fuel (%)
House heating fuel used in apartments - No fuel used (%)
Latest news about housing in Raleigh, NC collected exclusively by city-data.com from local newspapers, TV, and radio stations
Median year house/condo built: 1997Median year apartment built: 1999Household type by relationship:
Households: 477,084
Male householders: 93,352 (31,672 living alone ), Female householders: 102,062 (37,222 living alone )77,115 spouses (75,630 opposite-sex spouses ), 16,899 unmarried partners , (15,748 opposite-sex unmarried partners ), 124,738 children (120,402 natural , 2,174 adopted , 2,162 stepchildren ), 5,409 grandchildren , 4,708 brothers or sisters , 6,366 parents , 0 foster children , 6,198 other relatives , 21,076 non-relatives In group quarters: 19,161
Size of family households: 48,149 2-persons , 24,470 3-persons , 21,506 4-persons , 7,073 5-persons , 2,088 6-persons , 1,755 7-or-more-persons .
Size of nonfamily households: 68,894 1-person , 17,929 2-persons , 2,432 3-persons , 798 4-persons , 320 5-persons .
58,315 married couples with children. single-parent households (4,598 men , 22,144 women ).
81.5% of residents of Raleigh speak English at home. of residents speak Spanish at home (63% speak English very well , 20% speak English well , 13% speak English not well , 4% don't speak English at all ).of residents speak other Indo-European language at home (75% speak English very well , 19% speak English well , 6% speak English not well ).of residents speak Asian or Pacific Island language at home (59% speak English very well , 29% speak English well , 9% speak English not well , 3% don't speak English at all ).of residents speak other language at home (85% speak English very well , 13% speak English well , 3% speak English not well ).
Foreign born population: 64,586 (13.5%)of them are naturalized citizens )
Median number of rooms in houses and condos:
Median number of rooms in apartments
Owner-occupied Renter-occupied
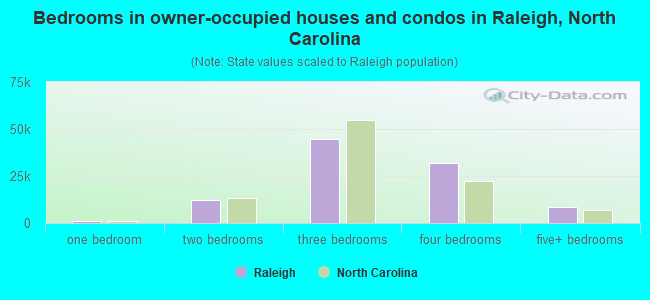
Bedrooms in owner-occupied houses and condos in Raleigh, North Carolina
92 no bedroom 950 1 bedroom 12,188 2 bedrooms 44,783 3 bedrooms 32,127 4 bedrooms 8,705 5+ bedrooms
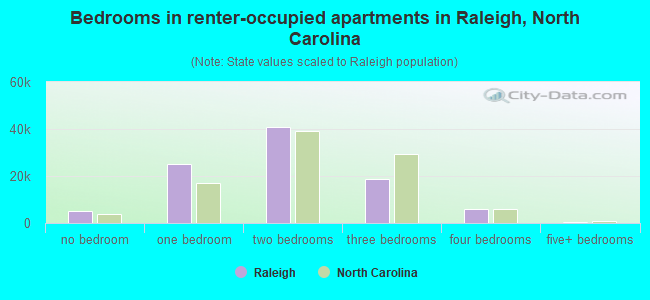
Bedrooms in renter-occupied apartments in Raleigh, North Carolina
5,100 no bedroom 25,312 1 bedroom 41,040 2 bedrooms 18,856 3 bedrooms 5,800 4 bedrooms 461 5+ bedrooms
Owner-occupied Renter-occupied
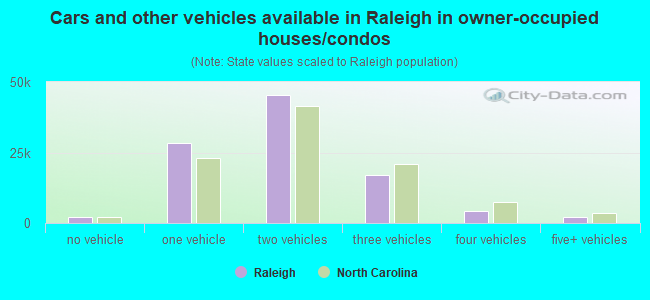
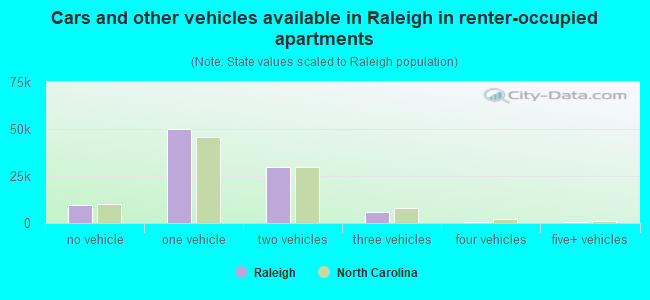
Cars and other vehicles available in Raleigh in owner-occupied houses/condos
1,985 no vehicle 28,375 1 vehicle 45,289 2 vehicles 16,911 3 vehicles 4,245 4 vehicles 2,040 5+ vehicles
Cars and other vehicles available in Raleigh in renter-occupied apartments
9,719 no vehicle 49,935 1 vehicle 29,925 2 vehicles 6,004 3 vehicles 660 4 vehicles 326 5+ vehicles
Owner-occupied Renter-occupied
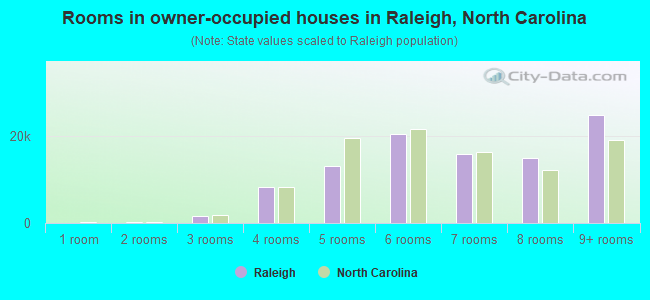
Rooms in owner-occupied houses in Raleigh, North Carolina
92 1 room 305 2 rooms 1,532 3 rooms 8,161 4 rooms 13,006 5 rooms 20,420 6 rooms 15,817 7 rooms 14,824 8 rooms 24,688 9+ rooms
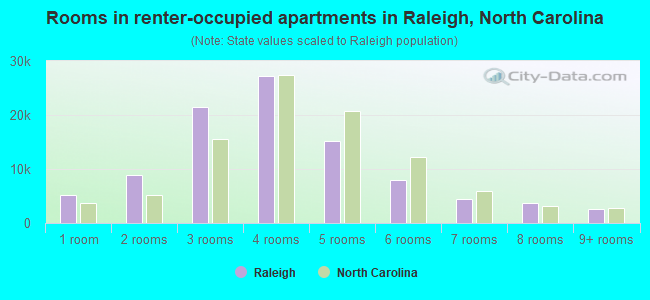
Rooms in renter-occupied apartments in Raleigh, North Carolina
5,100 1 room 8,955 2 rooms 21,433 3 rooms 27,240 4 rooms 15,094 5 rooms 7,916 6 rooms 4,404 7 rooms 3,795 8 rooms 2,632 9+ rooms
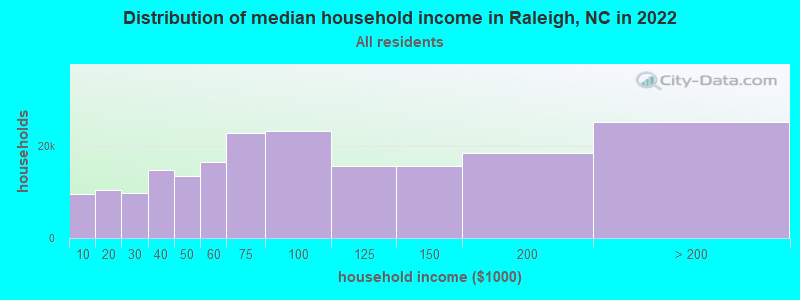
Raleigh, NC household income distribution 9,499 Less than $10,00010,460 $10,000 to $19,9999,748 $20,000 to $29,99914,861 $30,000 to $39,99913,360 $40,000 to $49,99916,511 $50,000 to $59,99922,717 $60,000 to $74,99923,270 $75,000 to $99,99915,735 $100,000 to $124,99915,528 $125,000 to $149,99918,548 $150,000 to $199,99925,177 $200,000 or more
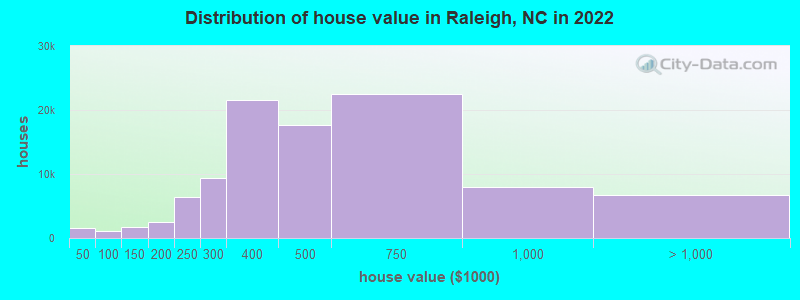
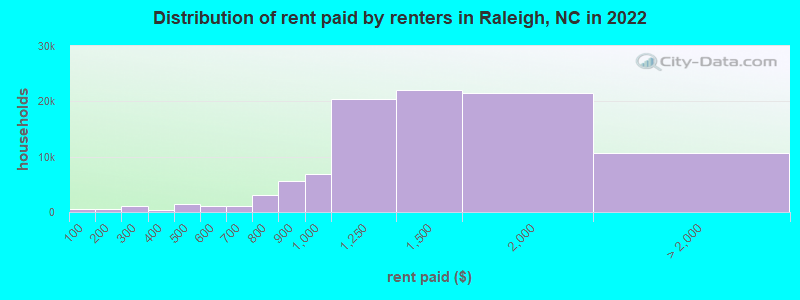
Home value of owner - occupied houses in 2022 in Raleigh, NC 682 Less than $10,000152 $10,000 to $14,999128 $15,000 to $19,999234 $20,000 to $24,99977 $25,000 to $29,99972 $30,000 to $34,999170 $35,000 to $39,99994 $40,000 to $49,999142 $50,000 to $59,999499 $60,000 to $69,99976 $70,000 to $79,99976 $80,000 to $89,999170 $90,000 to $99,9991,137 $100,000 to $124,999577 $125,000 to $149,9991,454 $150,000 to $174,9991,084 $175,000 to $199,9996,370 $200,000 to $249,9999,344 $250,000 to $299,99921,493 $300,000 to $399,99917,592 $400,000 to $499,99922,440 $500,000 to $749,9998,041 $750,000 to $999,9994,350 $1,000,000 to $1,499,9991,224 $1,500,000 to $1,999,9991,167 $2,000,000 or moreRent paid by renters in 2022 in Raleigh, NC 488 Less than $100403 $100 to $149157 $150 to $199559 $200 to $249531 $250 to $299307 $300 to $349143 $350 to $399900 $400 to $449474 $450 to $499499 $500 to $549579 $550 to $599355 $600 to $649770 $650 to $6991,746 $700 to $7491,354 $750 to $7995,687 $800 to $8996,793 $900 to $99920,443 $1,000 to $1,24922,073 $1,250 to $1,49921,584 $1,500 to $1,9995,610 $2,000 to $2,4991,799 $2,500 to $2,99979 $3,000 to $3,4991,387 $3,500 or more1,849 No cash rent
Percentage of workers working in this county: 88.8%Number of people working at home: 64,845 (24.5% of all workers )
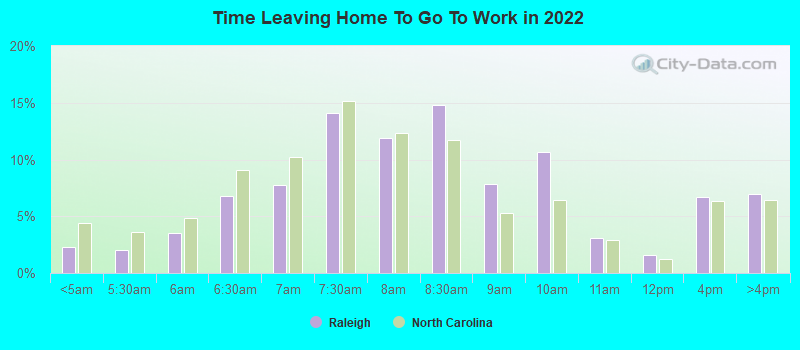
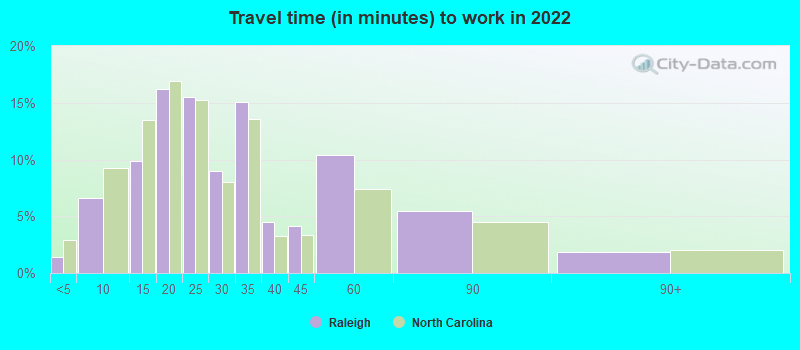
Travel time to work (commute)
Less than 5 minutes: 3,6755 to 9 minutes: 18,35510 to 14 minutes: 28,35515 to 19 minutes: 43,15220 to 24 minutes: 35,94725 to 29 minutes: 19,30330 to 34 minutes: 26,05835 to 39 minutes: 5,23540 to 44 minutes: 4,78845 to 59 minutes: 9,04660 to 89 minutes: 3,91690 or more minutes: 1,897
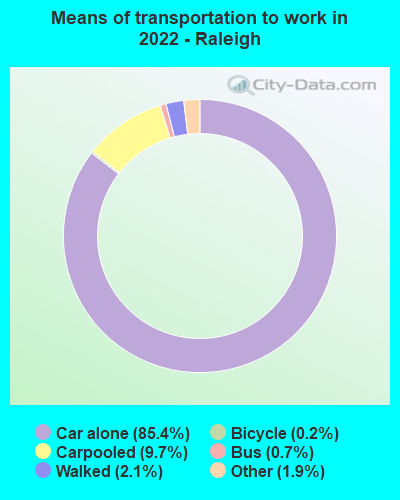
Means of transportation to work:
Drove a car alone: 248,406 (69.8%)Carpooled: 28,228 (7.9%)Bus : 2,176 (0.6%)Taxi: 5,450 (1.5%)Bicycle: 613 (0.2%)Walked: 5,966 (1.7%)Worked at home: 64,845 (18.2%)
Unemployment by race in 2022
Unemployment rate for White non-Hispanic residents 2.1% Males1.2% FemalesUnemployment rate for Black residents 2.9% Males6.3% FemalesUnemployment rate for American Indian and Alaska Native residents 2.8% Males2.6% FemalesUnemployment rate for Asian residents 2.5% MalesUnemployment rate for other race residents 1.8% Males6.2% FemalesUnemployment rate for two or more race residents 6.7% Males5.9% FemalesUnemployment rate for Hispanic or Latino residents 8.3% Males6.0% Females
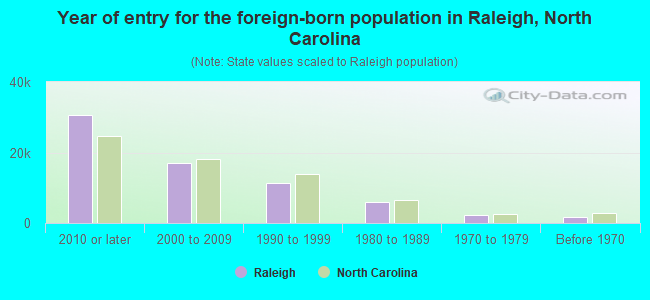
Year of entry for the foreign-born population in Raleigh, North Carolina
30,577 2010 or later 16,963 2000 to 2009 11,393 1990 to 1999 6,070 1980 to 1989 2,243 1970 to 1979 1,695 Before 1970
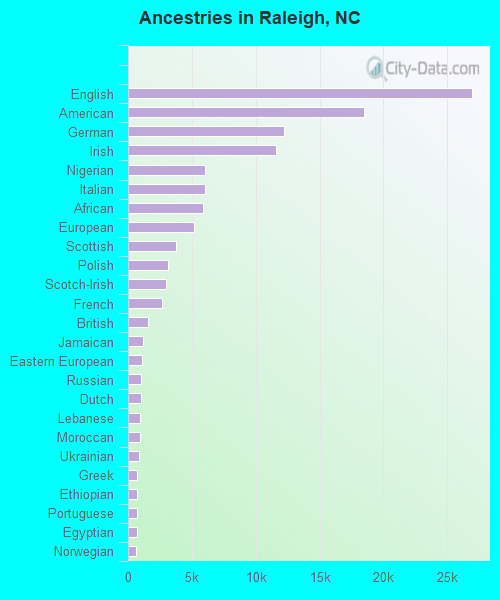
First ancestries reported:
English: 26,922 (9.7%)
American: 18,497 (6.7%)
German: 12,189 (4.4%)
Irish: 11,564 (4.2%)
Nigerian: 6,033 (2.2%)
Italian: 6,032 (2.2%)
African: 5,884 (2.1%)
European: 5,140 (1.9%)
Scottish: 3,733 (1.3%)
Polish: 3,159 (1.1%)
Scotch-Irish: 2,963 (1.1%)
French: 2,655 (1.0%)
British: 1,598 (0.6%)
Jamaican: 1,164 (0.4%)
Eastern European: 1,099 (0.4%)
Russian: 1,033 (0.4%)
Dutch: 1,007 (0.4%)
Lebanese: 921 (0.3%)
Moroccan: 911 (0.3%)
Ukrainian: 864 (0.3%)
Greek: 733 (0.3%)
Ethiopian: 704 (0.3%)
Portuguese: 700 (0.3%)
Egyptian: 674 (0.2%)
Norwegian: 648 (0.2%)
Iranian: 646 (0.2%)
West Indian: 633 (0.2%)
Scandinavian: 516 (0.2%)
Romanian: 511 (0.2%)
Palestinian: 506 (0.2%)
Afghan: 460 (0.2%)
Turkish: 441 (0.2%)
French Canadian: 437 (0.2%)
Swedish: 406 (0.1%)
Canadian: 385 (0.1%)
Arab: 370 (0.1%)
Hungarian: 361 (0.1%)
Northern European: 342 (0.1%)
Welsh: 327 (0.1%)
Haitian: 321 (0.1%)
Kenyan: 314 (0.1%)
Ghanaian: 307 (0.1%)
Iraqi: 276 (0.10%)
Senegalese: 266 (0.10%)
Danish: 264 (0.10%)
Czech: 232 (0.08%)
Slovak: 205 (0.07%)
Slavic: 188 (0.07%)
Bulgarian: 175 (0.06%)
Lithuanian: 171 (0.06%)
Swiss: 163 (0.06%)
Trinidadian and Tobagonian: 156 (0.06%)
Cape Verdean: 155 (0.06%)
Brazilian: 149 (0.05%)
Slovene: 110 (0.04%)
Austrian: 108 (0.04%)
Croatian: 103 (0.04%)
Belizean: 103 (0.04%)
Bermudan: 103 (0.04%)
South African: 102 (0.04%)
Armenian: 87 (0.03%)
Jordanian: 77 (0.03%)
Finnish: 74 (0.03%)
Bahamian: 71 (0.03%)
Belgian: 64 (0.02%)
British West Indian: 62 (0.02%)
Syrian: 60 (0.02%)
Liberian: 58 (0.02%)
Czechoslovakian: 53 (0.02%)
Sudanese: 52 (0.02%)
Israeli: 48 (0.02%)
Albanian: 47 (0.02%)
New Zealander: 44 (0.02%)
Cajun: 43 (0.02%)
Basque: 41 (0.01%)
Ugandan: 39 (0.01%)
Serbian: 32 (0.01%)
Latvian: 30 (0.01%)
U.S. Virgin Islander: 29 (0.01%)
Celtic: 26 (0.01%)
Guyanese: 24 (0.01%)
Icelander: 19 (0.01%)
Sierra Leonean: 18 (0.01%)
Estonian: 18 (0.01%)
Australian: 17 (0.01%)
Maltese: 14 (0.01%)
Most common places of birth for foreign-born residents (%): Mexico Raleigh:
15.0% (9,563)North Carolina:
24.7% (214,776)
India Raleigh:
7.4% (4,738)North Carolina:
9.3% (80,594)
Vietnam Raleigh:
5.3% (3,354)North Carolina:
2.9% (24,965)
El Salvador Raleigh:
4.7% (2,998)North Carolina:
3.8% (33,379)
Nigeria Raleigh:
4.6% (2,907)North Carolina:
1.1% (9,173)
Honduras Raleigh:
3.5% (2,227)North Carolina:
4.7% (40,707)
Philippines Raleigh:
3.4% (2,145)North Carolina:
2.4% (20,695)
Venezuela Raleigh:
2.7% (1,690)North Carolina:
1.2% (9,986)
Dominican Republic Raleigh:
2.5% (1,610)North Carolina:
1.7% (15,135)
China, excluding Hong Kong and Taiwan Raleigh:
2.5% (1,586)North Carolina:
3.2% (27,477)
Congo Raleigh:
1.9% (1,189)North Carolina:
0.4% (3,108)
Canada Raleigh:
1.9% (1,186)North Carolina:
2.1% (18,105)
Egypt Raleigh:
1.8% (1,147)North Carolina:
0.6% (4,847)
Other Western Africa Raleigh:
1.6% (1,015)North Carolina:
0.3% (2,644)
Iran Raleigh:
1.6% (1,010)North Carolina:
0.5% (4,378)
Colombia Raleigh:
1.6% (1,009)North Carolina:
2.1% (18,275)
Place of birth for U.S.-born residents:
This state: 213,767Other state: 189,856Northeast: 70,328Midwest: 30,716South: 72,623West: 16,189 82.8% of Raleigh residents lived in the same house 1 years ago.
Out of people who lived in different houses, 34.7% lived in this county.
Out of people who lived in different counties, 51.4% lived in North Carolina.
Raleigh:
82.8%State average:
87.3%
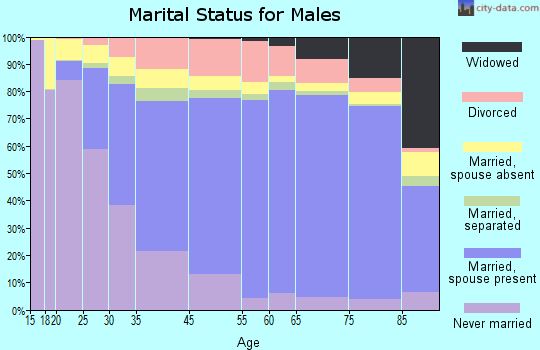
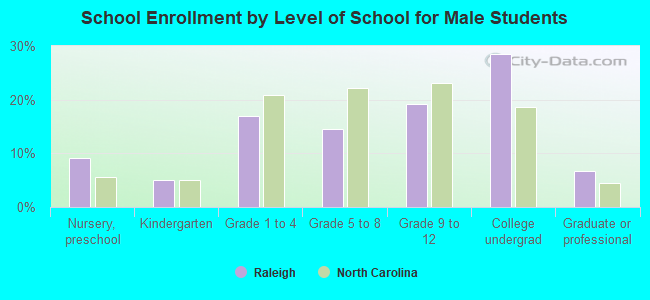
Education attainment for males 25 years and older:
No schooling: 2,527Nursery to 4th grade: 1,0985th and 6th grade: 8377th and 8th grade: 1,1249th grade: 1,63910th grade: 1,47911th grade: 89412th grade, no diploma: 2,460High school graduate (or equivalency): 27,568Less than 1 year of college: 7,137Some college more than 1 year, no degree: 15,816Associate degree: 10,187Bachelor's degree: 54,007Master's degree: 18,641Professional school degree: 6,193Doctorate degree: 5,110
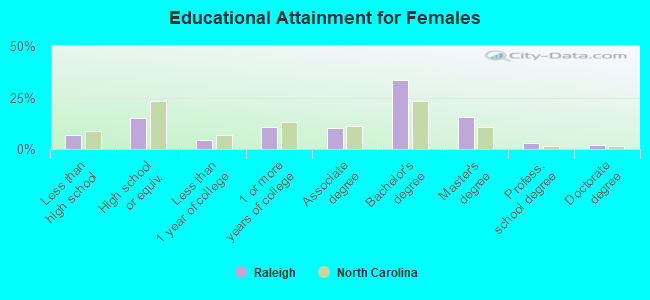
Education attainment for females 25 years and older:
No schooling: 2,840Nursery to 4th grade: 5475th and 6th grade: 7047th and 8th grade: 1,1579th grade: 2,04210th grade: 5311th grade: 1,66512th grade, no diploma: 2,211High school graduate (or equivalency): 24,836Less than 1 year of college: 7,026Some college more than 1 year, no degree: 17,304Associate degree: 16,589Bachelor's degree: 55,240Master's degree: 25,355Professional school degree: 4,797Doctorate degree: 2,941
Housing units in structures:
One, detached: 94,147One, attached: 29,965Two: 5,4923 or 4: 8,1735 to 9: 16,14210 to 19: 22,72720 to 49: 17,09350 or more: 28,482Mobile homes: 2,960Boats, RVs, vans, etc.: 139Median worth of mobile homes: $86,522
Housing units lacking complete plumbing facilities in 2022: 0.5%Housing units lacking complete kitchen facilities in 2022: 0.6%House/condo owner moved in on average 9 years ago
Renter moved in on average 2 years ago
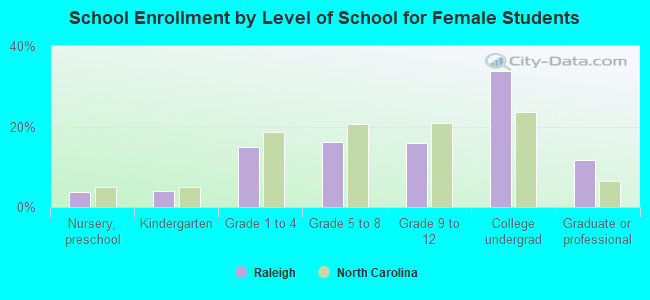
Private vs. public school enrollment:
Students in private schools in grades 1 to 8 (elementary and middle school): 4,202 Here:
11.2%North Carolina:
13.8%
Students in private schools in grades 9 to 12 (high school): 2,139 Here:
10.1%North Carolina:
11.9%
Students in private undergraduate colleges: 4,647 Here:
12.4%North Carolina:
19.3%