Rapid City, SD (South Dakota) Houses and Residents
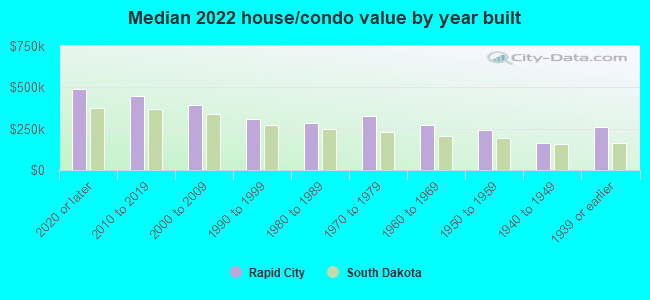
Estimated median house or condo value in 2022: $298,700 (it was $85,500 in 2000 )
Rapid City:
$298,700South Dakota:
$245,000
Lower value quartile - upper value quartile: $213,100 - $418,500Mean price in 2022: Detached houses: $332,578 Here:
$332,578State:
$303,134
Townhouses or other attached units: $356,939 Here:
$356,939State:
$292,182
In 2-unit structures: $178,058 Here:
$178,058State:
$202,885
In 3-to-4-unit structures: $214,413 Here:
$214,413State:
$310,946
In 5-or-more-unit structures: $228,808 Here:
$228,808State:
$177,195
Mobile homes: $55,021 Here:
$55,021State:
$82,732
Total population: 72,638 (Urban population: 57,036, Rural population: 2,471 (51 farm, 2,420 nonfarm ))
Houses: 36,569 (33,411 occupied: 19,127 owner occupied, 14,284 renter occupied )
% of renters here:
43%State:
30%
Housing density: 820 houses/condos per square mile
Median price asked for vacant for-sale houses and condos in 2022: $681,398.
Median contract rent in 2022: $898 (lower quartile is $490, upper quartile is $1,145)
Median rent asked for vacant for-rent units in 2022: $1,779
Median gross rent in Rapid City, SD in 2022: $994
Housing units in Rapid City with a mortgage: 11,261 (1,073 second mortgage, 56 home equity loan, 777 both second mortgage and home equity loan )Houses without a mortgage: 283
Median household income for houses/condos with a mortgage: $88,785
Median household income for apartments without a mortgage: $62,917
Median monthly housing costs: $1,069
Data:
Median house or condo value ($)
Median house or condo value ($ change since 2000)
Median house or condo value ($) - White
Median house or condo value ($) - Black or African American
Median house or condo value ($) - Asian
Median house or condo value ($) - Hispanic or Latino
Median house or condo value ($) - American Indian and Alaska Native
Median house or condo value ($) - Multirace
Median house or condo value ($) - Other Race
Median price asked for mobile homes ($)
Household density (households per square mile)
Mean house or condo value by units in structure - 1, detached ($)
Mean house or condo value by units in structure - 1, attached ($)
Mean house or condo value by units in structure - 2 ($)
Mean house or condo value by units in structure by units in structure - 3 or 4 ($)
Mean house or condo value by units in structure - 5 or more ($)
Mean house or condo value by units in structure - Boat, RV, van, etc. ($)
Mean house or condo value by units in structure - Mobile home ($)
Median contract rent ($)
Median contract rent - Lower quartile ($)
Median contract rent - Upper quartile ($)
Median gross rent ($)
Urban houses (%)
Rural houses (%)
Houses occupied (%)
Houses occupied (% change since 2000)
Houses owner occupied (%)
Houses owner occupied (% change since 2000)
Houses renter occupied (%)
Houses renter occupied (% change since 2000)
Vacant housing units - For rent (%)
Vacant housing units - For rent (% change since 2000)
Vacant housing units - For sale only (%)
Vacant housing units - For sale only (% change since 2000)
Vacant housing units - Rented or sold, not occupied (%)
Vacant housing units - Rented or sold, not occupied (% change since 2000)
Vacant housing units - For seasonal, recreational, or occasional use (%)
Vacant housing units - For seasonal, recreational, or occasional use (% change since 2000)
Vacant housing units - For migrant workers (%)
Vacant housing units - For migrant workers (% change since 2000)
Vacant housing units - Other vacant (%)
Vacant housing units - Other vacant (% change since 2000)
Median monthly housing costs ($)
Median household income for houses/condos with a mortgage ($)
Median household income for houses/condos without a mortgage ($)
Median household income ($)
Median household income ($) - White
Median household income ($) - Black or African American
Median household income ($) - Asian
Median household income ($) - Hispanic or Latino
Median household income ($) - American Indian and Alaska Native
Median household income ($) - Multirace
Median household income ($) - Other Race
Mortgage status - with mortgage (%)
Mortgage status - with second mortgage (%)
Mortgage status - with home equity loan (%)
Mortgage status - with both second mortgage and home equity loan (%)
Mortgage status - without a mortgage (%)
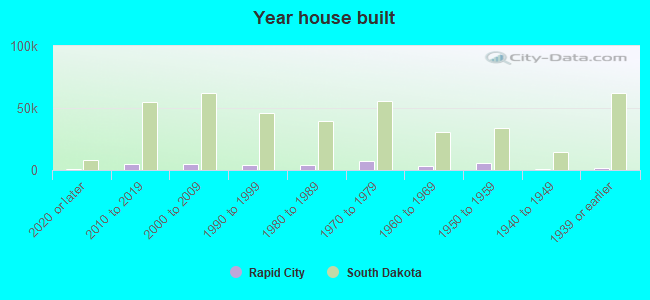
Median year house/condo built
Median year apartment built
Household type by relationship - Male householder living alone (%)
Household type by relationship - Male householder not living alone (%)
Household type by relationship - Female householder living alone (%)
Household type by relationship - Female householder not living alone (%)
Household type by relationship - Opposite-Sex spouse (%)
Household type by relationship - Same-Sex spouse (%)
Household type by relationship - Opposite-Sex unmarried partner (%)
Household type by relationship - Same-Sex unmarried partner (%)
Household type by relationship - In group quarters (%)
Size of family households - 2-person household (%)
Size of family households - 3-person household (%)
Size of family households - 4-person household (%)
Size of family households - 5-person household (%)
Size of family households - 6-person household (%)
Size of family households - 7-or-more-person household (%)
Size of nonfamily households - 1-person household (%)
Size of nonfamily households - 2-person household (%)
Size of nonfamily households - 3-person household (%)
Size of nonfamily households - 4-person household (%)
Size of nonfamily households - 5-person household (%)
Size of nonfamily households - 6-person household (%)
Size of nonfamily households - 7-or-moreperson household (%)
Year house built - Built 2010 or later (%)
Year house built - Built 2000 to 2009 (%)
Year house built - Built 1990 to 1999 (%)
Year house built - Built 1980 to 1989 (%)
Year house built - Built 1970 to 1979 (%)
Year house built - Built 1960 to 1969 (%)
Year house built - Built 1950 to 1959 (%)
Year house built - Built 1940 to 1949 (%)
Year house built - Built 1939 or earlier (%)
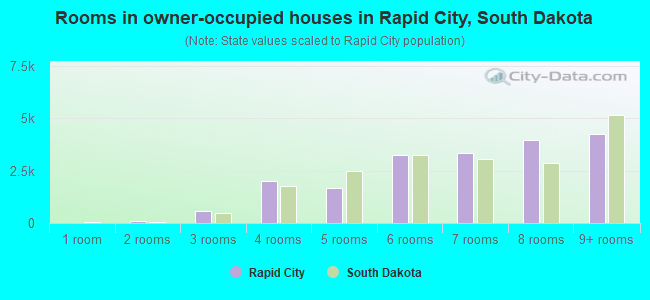
Median number of rooms in houses and condos
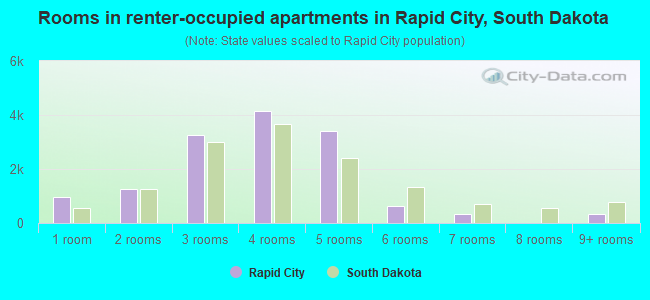
Median number of rooms in apartments
Median number of bedrooms in owner occupied houses
Mean number of bedrooms in owner occupied houses
Median number of bedrooms in renter occupied houses
Mean number of bedrooms in renter occupied houses
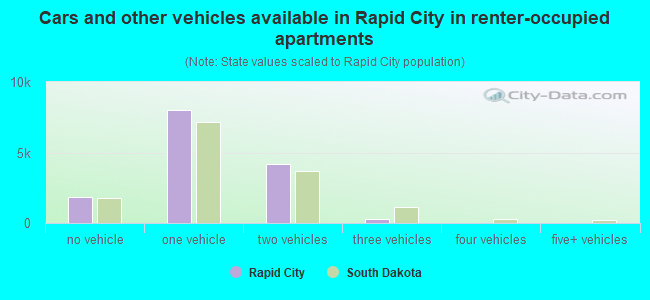
Median number of vehichles in owner occupied houses
Mean number of vehichles in owner occupied houses
Median number of vehichles in renter occupied houses
Mean number of vehichles in renter occupied houses
Rooms in owner-occupied houses - 1 room (%)
Rooms in owner-occupied houses - 2 rooms (%)
Rooms in owner-occupied houses - 3 rooms (%)
Rooms in owner-occupied houses - 4 rooms (%)
Rooms in owner-occupied houses - 5 rooms (%)
Rooms in owner-occupied houses - 6 rooms (%)
Rooms in owner-occupied houses - 7 rooms (%)
Rooms in owner-occupied houses - 8 rooms (%)
Rooms in owner-occupied houses - 9+ rooms (%)
Rooms in renter-occupied houses - 1 room (%)
Rooms in renter-occupied houses - 2 rooms (%)
Rooms in renter-occupied houses - 3 rooms (%)
Rooms in renter-occupied houses - 4 rooms (%)
Rooms in renter-occupied houses - 5 rooms (%)
Rooms in renter-occupied houses - 6 rooms (%)
Rooms in renter-occupied houses - 7 rooms (%)
Rooms in renter-occupied houses - 8 rooms (%)
Rooms in renter-occupied houses - 9+ rooms (%)
Bedrooms in owner-occupied houses - no bedrooms (%)
Bedrooms in owner-occupied houses - 1 bedroom (%)
Bedrooms in owner-occupied houses - 2 bedrooms (%)
Bedrooms in owner-occupied houses - 3 bedrooms (%)
Bedrooms in owner-occupied houses - 4 bedrooms (%)
Bedrooms in owner-occupied houses - 5+ bedrooms (%)
Bedrooms in renter-occupied houses - no bedrooms (%)
Bedrooms in renter-occupied houses - 1 bedroom (%)
Bedrooms in renter-occupied houses - 2 bedrooms (%)
Bedrooms in renter-occupied houses - 3 bedrooms (%)
Bedrooms in renter-occupied houses - 4 bedrooms (%)
Bedrooms in renter-occupied houses - 5+ bedrooms (%)
Vehicles available in owner-occupied houses - no vehicle available (%)
Vehicles available in owner-occupied houses - 1 vehicle available(%)
Vehicles available in owner-occupied houses - 2 Vehicles available (%)
Vehicles available in owner-occupied houses - 3 Vehicles available (%)
Vehicles available in owner-occupied houses - 4 Vehicles available (%)
Vehicles available in owner-occupied houses - 5+ Vehicles available (%)
Vehicles available in renter-occupied houses - no vehicle available (%)
Vehicles available in renter-occupied houses - 1 vehicle available (%)
Vehicles available in renter-occupied houses - 2 Vehicles available (%)
Vehicles available in renter-occupied houses - 3 Vehicles available (%)
Vehicles available in renter-occupied houses - 4 Vehicles available (%)
Vehicles available in renter-occupied houses - 5+ Vehicles available (%)
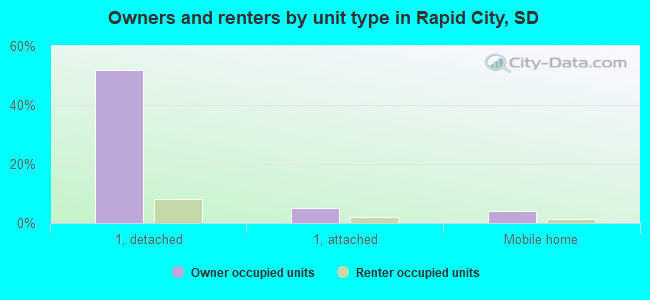
Housing units in structures - 1, detached (%)
Housing units in structures - 1, attached (%)
Housing units in structures - 2 (%)
Housing units in structures - 3 or 4 (%)
Housing units in structures - 5 to 9 (%)
Housing units in structures - 10 to 19 (%)
Housing units in structures - 20 to 49 (%)
Housing units in structures - 50 or more (%)
Housing units in structures - Mobile home (%)
Housing units in structures - Boat, RV, van, etc. (%)
Housing units in structures - Owners - 1, detached (%)
Housing units in structures - Owners - 1, attached (%)
Housing units in structures - Owners - 2 (%)
Housing units in structures - Owners - 3 or 4 (%)
Housing units in structures - Owners - 5 to 9 (%)
Housing units in structures - Owners - 10 to 19 (%)
Housing units in structures - Owners - 20 to 49 (%)
Housing units in structures - Owners - 50 or more (%)
Housing units in structures - Owners - Mobile home (%)
Housing units in structures - Owners - Boat, RV, van, etc. (%)
Housing units in structures - Renters - 1, detached (%)
Housing units in structures - Renters - 1, attached (%)
Housing units in structures - Renters - 2 (%)
Housing units in structures - Renters - 3 or 4 (%)
Housing units in structures - Renters - 5 to 9 (%)
Housing units in structures - Renters - 10 to 19 (%)
Housing units in structures - Renters - 20 to 49 (%)
Housing units in structures - Renters - 50 or more (%)
Housing units in structures - Renters - Mobile home (%)
Housing units in structures - Renters - Boat, RV, van, etc. (%)
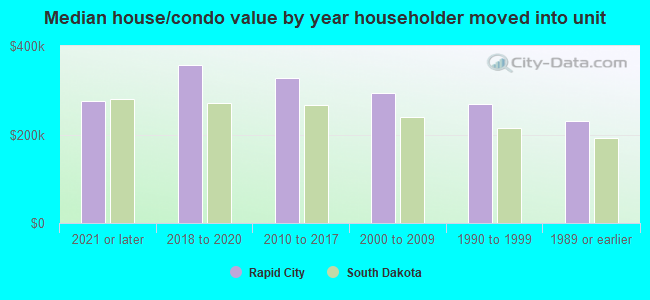
House/condo owner moved in on average (years ago)
Renter moved in on average (years ago)
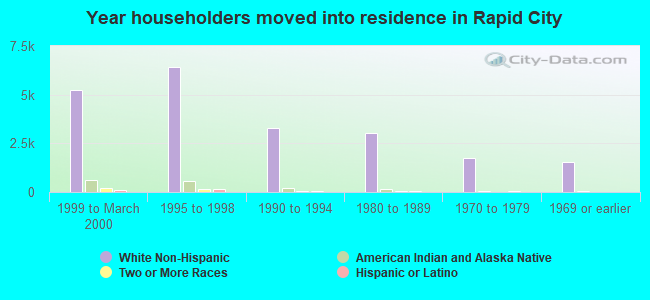
Year householder moved into unit - Moved in 1999 to March 2000 (%)
Year householder moved into unit - Moved in 1999 to March 2000 (%) - White
Year householder moved into unit - Moved in 1999 to March 2000 (%) - Black or African American
Year householder moved into unit - Moved in 1999 to March 2000 (%) - Asian
Year householder moved into unit - Moved in 1999 to March 2000 (%) - Hispanic or Latino
Year householder moved into unit - Moved in 1999 to March 2000 (%) - American Indian and Alaska Native
Year householder moved into unit - Moved in 1999 to March 2000 (%) - Multirace
Year householder moved into unit - Moved in 1999 to March 2000 (%) - Other Race
Year householder moved into unit - Moved in 1995 to 1998 (%)
Year householder moved into unit - Moved in 1995 to 1998 (%) - White
Year householder moved into unit - Moved in 1995 to 1998 (%) - Black or African American
Year householder moved into unit - Moved in 1995 to 1998 (%) - Asian
Year householder moved into unit - Moved in 1995 to 1998 (%) - Hispanic or Latino
Year householder moved into unit - Moved in 1995 to 1998 (%) - American Indian and Alaska Native
Year householder moved into unit - Moved in 1995 to 1998 (%) - Multirace
Year householder moved into unit - Moved in 1995 to 1998 (%) - Other Race
Year householder moved into unit - Moved in 1990 to 1994 (%)
Year householder moved into unit - Moved in 1990 to 1994 (%) - White
Year householder moved into unit - Moved in 1990 to 1994 (%) - Black or African American
Year householder moved into unit - Moved in 1990 to 1994 (%) - Asian
Year householder moved into unit - Moved in 1990 to 1994 (%) - Hispanic or Latino
Year householder moved into unit - Moved in 1990 to 1994 (%) - American Indian and Alaska Native
Year householder moved into unit - Moved in 1990 to 1994 (%) - Multirace
Year householder moved into unit - Moved in 1990 to 1994 (%) - Other Race
Year householder moved into unit - Moved in 1980 to 1989 (%)
Year householder moved into unit - Moved in 1980 to 1989 (%) - White
Year householder moved into unit - Moved in 1980 to 1989 (%) - Black or African American
Year householder moved into unit - Moved in 1980 to 1989 (%) - Asian
Year householder moved into unit - Moved in 1980 to 1989 (%) - Hispanic or Latino
Year householder moved into unit - Moved in 1980 to 1989 (%) - American Indian and Alaska Native
Year householder moved into unit - Moved in 1980 to 1989 (%) - Multirace
Year householder moved into unit - Moved in 1980 to 1989 (%) - Other Race
Year householder moved into unit - Moved in 1970 to 1979 (%)
Year householder moved into unit - Moved in 1970 to 1979 (%) - White
Year householder moved into unit - Moved in 1970 to 1979 (%) - Black or African American
Year householder moved into unit - Moved in 1970 to 1979 (%) - Asian
Year householder moved into unit - Moved in 1970 to 1979 (%) - Hispanic or Latino
Year householder moved into unit - Moved in 1970 to 1979 (%) - American Indian and Alaska Native
Year householder moved into unit - Moved in 1970 to 1979 (%) - Multirace
Year householder moved into unit - Moved in 1970 to 1979 (%) - Other Race
Year householder moved into unit - Moved in 1969 or earlier (%)
Year householder moved into unit - Moved in 1969 or earlier (%) - White
Year householder moved into unit - Moved in 1969 or earlier (%) - Black or African American
Year householder moved into unit - Moved in 1969 or earlier (%) - Asian
Year householder moved into unit - Moved in 1969 or earlier (%) - Hispanic or Latino
Year householder moved into unit - Moved in 1969 or earlier (%) - American Indian and Alaska Native
Year householder moved into unit - Moved in 1969 or earlier (%) - Multirace
Year householder moved into unit - Moved in 1969 or earlier (%) - Other Race
Housing units lacking complete plumbing facilities (%)
Housing units lacking complete kitchen facilities (%)
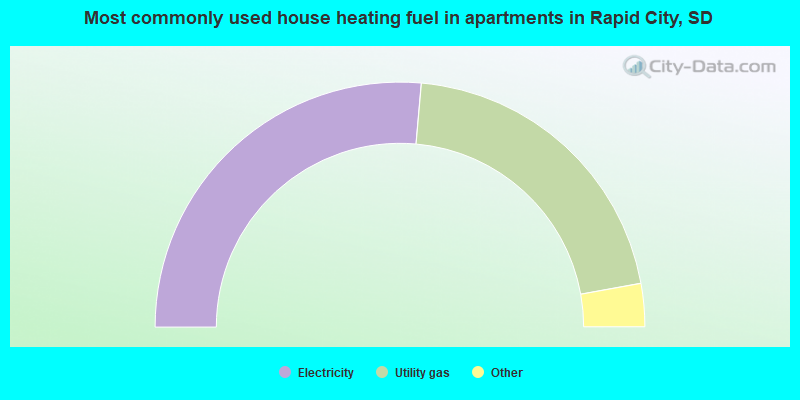
House heating fuel used in houses and condos - Utility gas (%)
House heating fuel used in houses and condos - Bottled, tank, or LP gas (%)
House heating fuel used in houses and condos - Electricity (%)
House heating fuel used in houses and condos - Fuel oil, kerosene, etc. (%)
House heating fuel used in houses and condos - Coal or coke (%)
House heating fuel used in houses and condos - Wood (%)
House heating fuel used in houses and condos - Solar energy (%)
House heating fuel used in houses and condos - Other fuel (%)
House heating fuel used in houses and condos - No fuel used (%)
House heating fuel used in apartments - Utility gas (%)
House heating fuel used in apartments - Bottled, tank, or LP gas (%)
House heating fuel used in apartments - Electricity (%)
House heating fuel used in apartments - Fuel oil, kerosene, etc. (%)
House heating fuel used in apartments - Coal or coke (%)
House heating fuel used in apartments - Wood (%)
House heating fuel used in apartments - Solar energy (%)
House heating fuel used in apartments - Other fuel (%)
House heating fuel used in apartments - No fuel used (%)
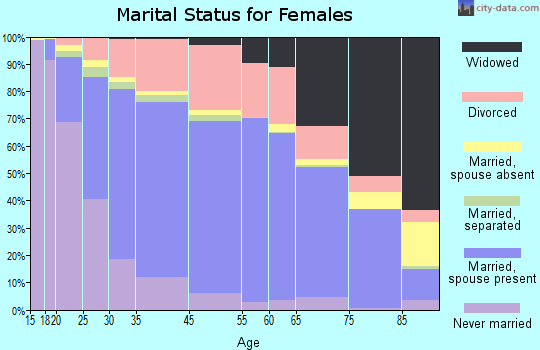
Median year house/condo built: 1978Median year apartment built: 1987Household type by relationship:
Households: 78,833
Male householders: 17,574 (7,047 living alone ), Female householders: 15,837 (5,479 living alone )13,598 spouses (13,525 opposite-sex spouses ), 2,165 unmarried partners , (2,165 opposite-sex unmarried partners ), 19,978 children (16,465 natural , 1,291 adopted , 2,222 stepchildren ), 1,894 grandchildren , 1,007 brothers or sisters , 531 parents , 109 foster children , 499 other relatives , 1,593 non-relatives In group quarters: 4,048
Size of family households: 9,602 2-persons , 4,139 3-persons , 2,863 4-persons , 1,567 5-persons , 280 6-persons , 253 7-or-more-persons .
Size of nonfamily households: 12,526 1-person , 2,141 2-persons , 40 3-persons .
9,824 married couples with children. single-parent households (896 men , 3,812 women ).
94.7% of residents of Rapid City speak English at home. of residents speak Spanish at home (71% speak English very well , 22% speak English well , 7% speak English not well ).of residents speak other Indo-European language at home (90% speak English very well , 7% speak English well , 4% speak English not well ).of residents speak Asian or Pacific Island language at home (51% speak English very well , 33% speak English well , 16% speak English not well ).of residents speak other language at home (83% speak English very well , 14% speak English well , 3% speak English not well ).
Foreign born population: 2,580 (3.3%)of them are naturalized citizens )
Median number of rooms in houses and condos:
Median number of rooms in apartments
Owner-occupied Renter-occupied
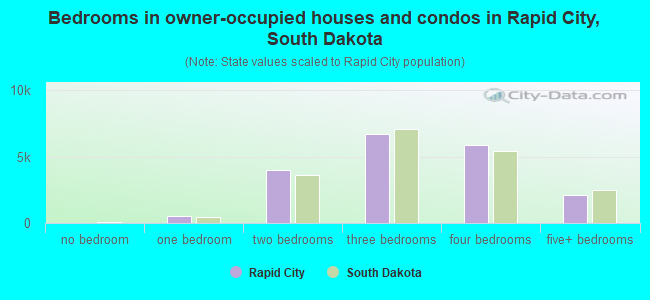
Bedrooms in owner-occupied houses and condos in Rapid City, South Dakota
0 no bedroom 531 1 bedroom 3,972 2 bedrooms 6,679 3 bedrooms 5,849 4 bedrooms 2,096 5+ bedrooms
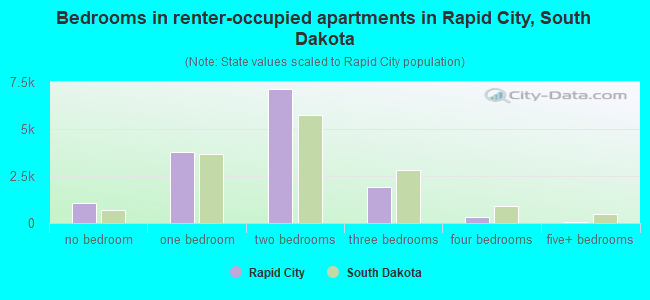
Bedrooms in renter-occupied apartments in Rapid City, South Dakota
1,080 no bedroom 3,802 1 bedroom 7,110 2 bedrooms 1,899 3 bedrooms 332 4 bedrooms 61 5+ bedrooms
Owner-occupied Renter-occupied
Rooms in owner-occupied houses in Rapid City, South Dakota
0 1 room 81 2 rooms 580 3 rooms 1,984 4 rooms 1,660 5 rooms 3,252 6 rooms 3,350 7 rooms 3,962 8 rooms 4,258 9+ rooms
Rooms in renter-occupied apartments in Rapid City, South Dakota
951 1 room 1,244 2 rooms 3,241 3 rooms 4,160 4 rooms 3,400 5 rooms 637 6 rooms 320 7 rooms 0 8 rooms 331 9+ rooms
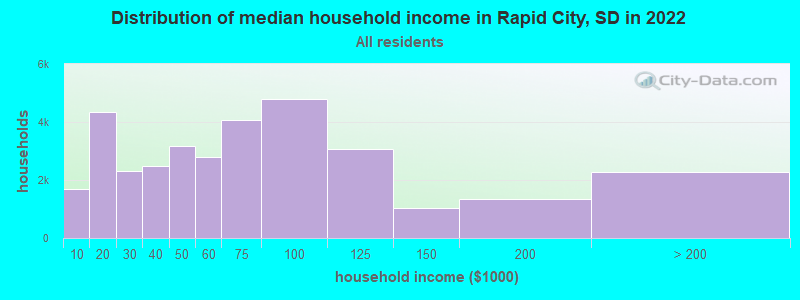
Rapid City, SD household income distribution 1,702 Less than $10,0004,328 $10,000 to $19,9992,323 $20,000 to $29,9992,491 $30,000 to $39,9993,159 $40,000 to $49,9992,791 $50,000 to $59,9994,086 $60,000 to $74,9994,800 $75,000 to $99,9993,057 $100,000 to $124,9991,050 $125,000 to $149,9991,362 $150,000 to $199,9992,262 $200,000 or more
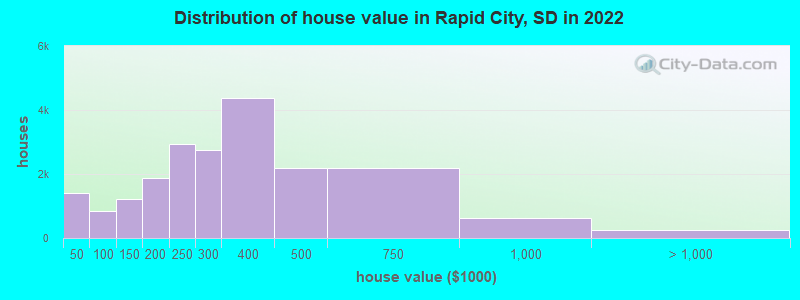
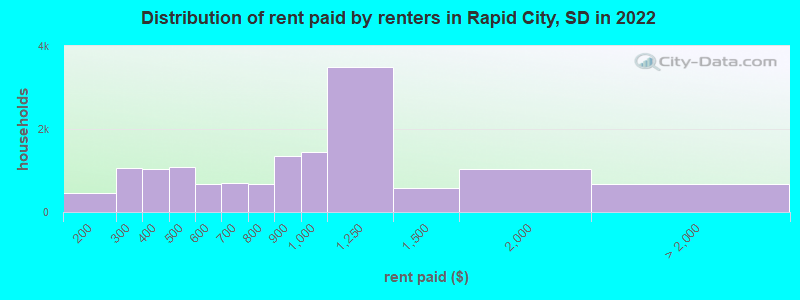
Home value of owner - occupied houses in 2022 in Rapid City, SD 364 Less than $10,000149 $10,000 to $14,999115 $15,000 to $19,999199 $20,000 to $24,99983 $25,000 to $29,999120 $30,000 to $34,99956 $35,000 to $39,999320 $40,000 to $49,999105 $50,000 to $59,999120 $60,000 to $69,99996 $70,000 to $79,999123 $80,000 to $89,99977 $90,000 to $99,999483 $100,000 to $124,999720 $125,000 to $149,999910 $150,000 to $174,999972 $175,000 to $199,9992,934 $200,000 to $249,9992,743 $250,000 to $299,9994,388 $300,000 to $399,9992,185 $400,000 to $499,9992,202 $500,000 to $749,999638 $750,000 to $999,999161 $1,000,000 to $1,499,99967 $1,500,000 to $1,999,99935 $2,000,000 or moreRent paid by renters in 2022 in Rapid City, SD 210 $100 to $149252 $150 to $199674 $200 to $249388 $250 to $299396 $300 to $349632 $350 to $399390 $400 to $449699 $450 to $499231 $500 to $549447 $550 to $599391 $600 to $649300 $650 to $699260 $700 to $749405 $750 to $7991,355 $800 to $8991,441 $900 to $9993,498 $1,000 to $1,249590 $1,250 to $1,4991,045 $1,500 to $1,999232 $2,000 to $2,499161 $3,000 to $3,499287 No cash rent
Percentage of workers working in this county: 93.3%Number of people working at home: 3,951 (10.4% of all workers )
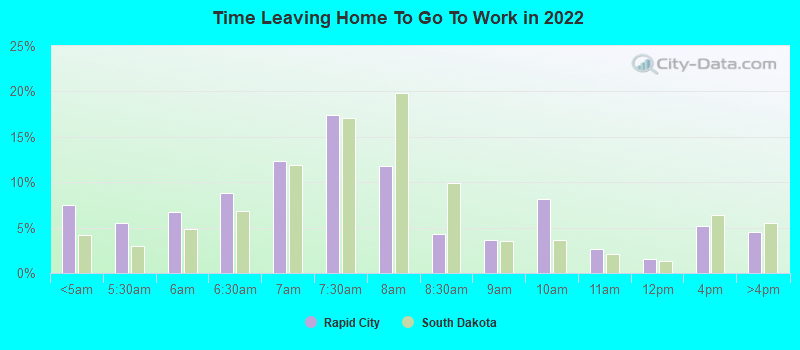
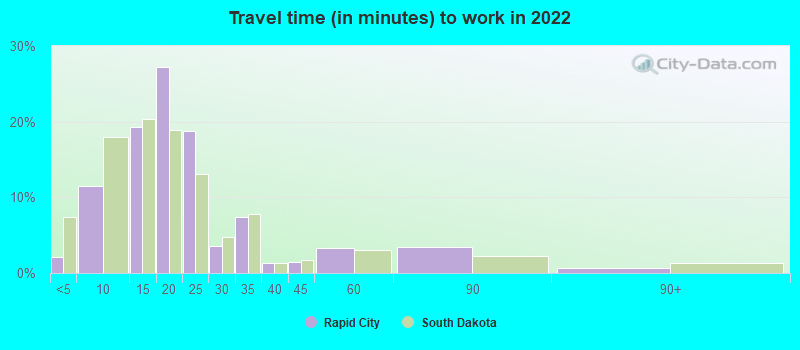
Travel time to work (commute)
Less than 5 minutes: 8225 to 9 minutes: 4,56110 to 14 minutes: 7,65815 to 19 minutes: 9,17620 to 24 minutes: 5,53925 to 29 minutes: 1,49230 to 34 minutes: 2,03035 to 39 minutes: 50940 to 44 minutes: 22745 to 59 minutes: 57660 to 89 minutes: 76290 or more minutes: 302
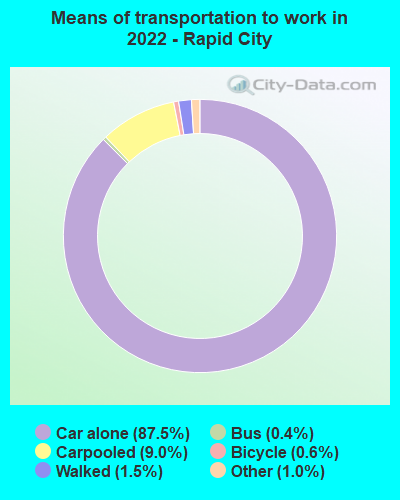
Means of transportation to work:
Drove a car alone: 41,520 (80.3%)Carpooled: 3,638 (7.0%)Bus : 237 (0.5%)Taxi: 750 (1.5%)Bicycle: 178 (0.3%)Walked: 532 (1.0%)Worked at home: 4,608 (8.9%)
Unemployment by race in 2022
Unemployment rate for White non-Hispanic residents 4.5% Males5.3% FemalesUnemployment rate for Black residents 2.0% MalesUnemployment rate for American Indian and Alaska Native residents 3.4% Males12.8% FemalesUnemployment rate for Asian residents 7.6% MalesUnemployment rate for two or more race residents 4.1% Males2.2% FemalesUnemployment rate for Hispanic or Latino residents 1.5% Males5.4% Females
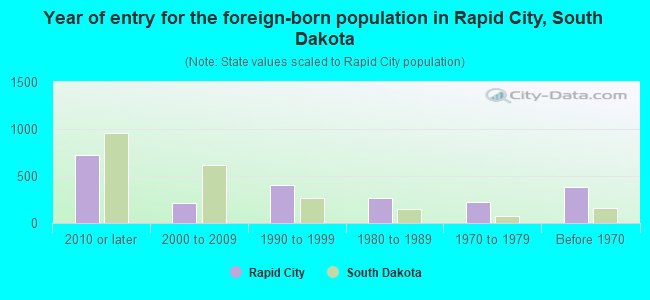
Year of entry for the foreign-born population in Rapid City, South Dakota
725 2010 or later 216 2000 to 2009 407 1990 to 1999 265 1980 to 1989 223 1970 to 1979 382 Before 1970
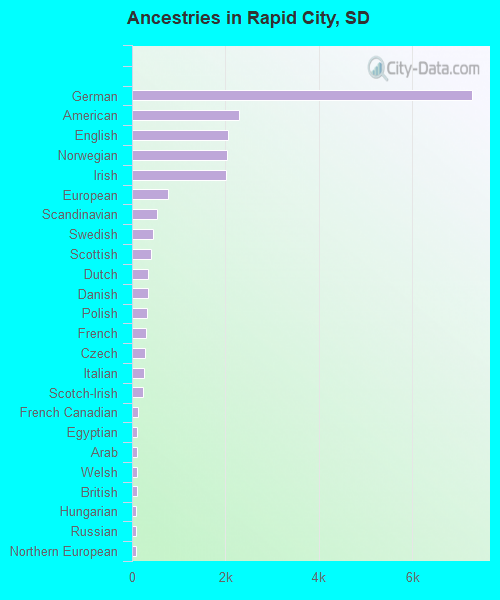
First ancestries reported:
German: 7,275 (23.3%)
American: 2,280 (7.3%)
English: 2,054 (6.6%)
Norwegian: 2,030 (6.5%)
Irish: 2,007 (6.4%)
European: 769 (2.5%)
Scandinavian: 538 (1.7%)
Swedish: 444 (1.4%)
Scottish: 399 (1.3%)
Dutch: 350 (1.1%)
Danish: 334 (1.1%)
Polish: 315 (1.0%)
French: 310 (1.0%)
Czech: 268 (0.9%)
Italian: 261 (0.8%)
Scotch-Irish: 237 (0.8%)
French Canadian: 125 (0.4%)
Egyptian: 113 (0.4%)
Arab: 100 (0.3%)
Welsh: 100 (0.3%)
British: 98 (0.3%)
Hungarian: 89 (0.3%)
Russian: 88 (0.3%)
Northern European: 82 (0.3%)
Finnish: 60 (0.2%)
Jamaican: 59 (0.2%)
Haitian: 41 (0.1%)
Portuguese: 39 (0.1%)
Pennsylvania German: 38 (0.1%)
Icelander: 37 (0.1%)
Swiss: 37 (0.1%)
Eastern European: 35 (0.1%)
Turkish: 33 (0.1%)
Albanian: 31 (0.10%)
Kenyan: 29 (0.09%)
Latvian: 21 (0.07%)
African: 19 (0.06%)
Romanian: 17 (0.05%)
Canadian: 16 (0.05%)
Lebanese: 12 (0.04%)
Lithuanian: 12 (0.04%)
Ethiopian: 12 (0.04%)
German Russian: 11 (0.04%)
Nigerian: 10 (0.03%)
Belgian: 9 (0.03%)
Iranian: 9 (0.03%)
Basque: 6 (0.02%)
Austrian: 2 (0.01%)
Ukrainian: 2 (0.01%)
Most common places of birth for foreign-born residents (%): Philippines Rapid City:
14.9% (265)South Dakota:
4.9% (1,663)
Mexico Rapid City:
11.0% (196)South Dakota:
10.7% (3,642)
Iraq Rapid City:
6.1% (108)South Dakota:
1.2% (393)
Korea Rapid City:
6.0% (107)South Dakota:
2.6% (896)
England Rapid City:
6.0% (107)South Dakota:
1.1% (365)
Egypt Rapid City:
6.0% (107)South Dakota:
1.0% (325)
Germany Rapid City:
4.7% (84)South Dakota:
1.8% (624)
Nepal Rapid City:
4.4% (78)South Dakota:
3.5% (1,180)
Jamaica Rapid City:
4.0% (72)South Dakota:
0.3% (111)
Burma (Myanmar) Rapid City:
3.3% (59)South Dakota:
2.4% (833)
Spain Rapid City:
3.2% (57)South Dakota:
0.2% (70)
China, excluding Hong Kong and Taiwan Rapid City:
2.8% (49)South Dakota:
2.7% (905)
India Rapid City:
2.7% (48)South Dakota:
4.0% (1,373)
Canada Rapid City:
2.7% (48)South Dakota:
3.3% (1,125)
Albania Rapid City:
2.4% (43)South Dakota:
0.4% (130)
Turkey Rapid City:
1.9% (33)South Dakota:
0.1% (37)
United Kingdom, excluding England and Scotland Rapid City:
1.7% (30)South Dakota:
0.6% (215)
Poland Rapid City:
1.6% (29)South Dakota:
0.1% (49)
Japan Rapid City:
1.5% (27)South Dakota:
1.4% (474)
Portugal Rapid City:
1.5% (27)South Dakota:
0.1% (29)
Place of birth for U.S.-born residents:
This state: 42,822Other state: 32,527Northeast: 1,946Midwest: 13,398South: 4,634West: 12,549 81.4% of Rapid City residents lived in the same house 1 years ago.
Out of people who lived in different houses, 32.5% lived in this county.
Out of people who lived in different counties, 36.7% lived in South Dakota.
Rapid City:
81.4%State average:
86.6%
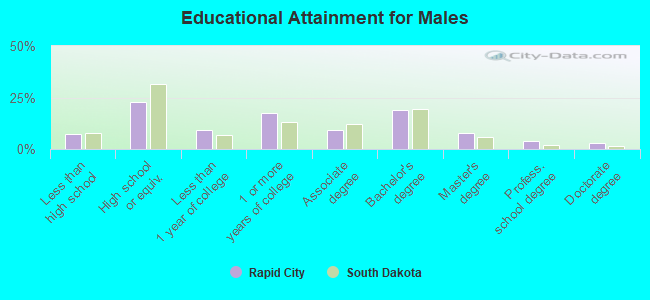
Education attainment for males 25 years and older:
No schooling: 767Nursery to 4th grade: 05th and 6th grade: 877th and 8th grade: 1959th grade: 31610th grade: 46211th grade: 4812th grade, no diploma: 212High school graduate (or equivalency): 6,459Less than 1 year of college: 2,653Some college more than 1 year, no degree: 4,900Associate degree: 2,636Bachelor's degree: 5,379Master's degree: 2,178Professional school degree: 1,051Doctorate degree: 885
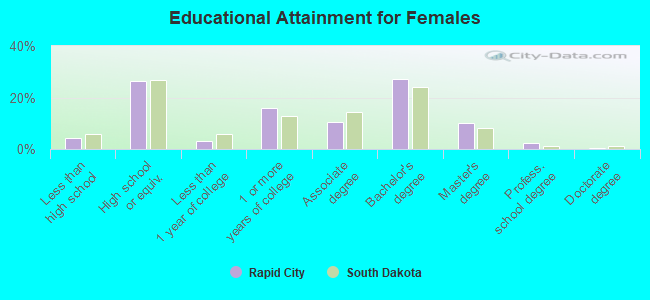
Education attainment for females 25 years and older:
No schooling: 129Nursery to 4th grade: 05th and 6th grade: 07th and 8th grade: 559th grade: 21010th grade: 19511th grade: 37012th grade, no diploma: 182High school graduate (or equivalency): 7,111Less than 1 year of college: 877Some college more than 1 year, no degree: 4,281Associate degree: 2,794Bachelor's degree: 7,287Master's degree: 2,730Professional school degree: 608Doctorate degree: 129
Housing units in structures:
One, detached: 19,709One, attached: 1,317Two: 1,0723 or 4: 1,7525 to 9: 2,34310 to 19: 3,49820 to 49: 2,82350 or more: 2,507Mobile homes: 1,548Median worth of mobile homes: $31,944
Housing units lacking complete plumbing facilities in 2022: 2.2%Housing units lacking complete kitchen facilities in 2022: 3.5%House/condo owner moved in on average 7 years ago
Renter moved in on average 2 years ago
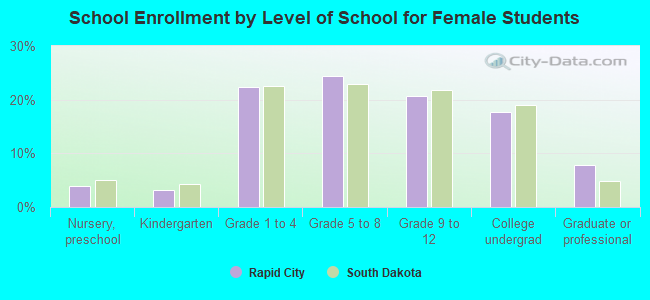
Private vs. public school enrollment:
Students in private schools in grades 1 to 8 (elementary and middle school): 1,286 Here:
16.3%South Dakota:
11.9%
Students in private schools in grades 9 to 12 (high school): 618 Here:
13.8%South Dakota:
7.2%
Students in private undergraduate colleges: 355 Here:
9.0%South Dakota:
10.2%