Jump to a detailed profile or search site with Google Custom Search

Redlands, CA (California) Houses and Residents

Estimated median house or condo value in 2022: $566,400 (it was $152,200 in 2000)
Redlands:

$566,400
California:

$715,900
Lower value quartile - upper value quartile: $430,900 - $719,600

Total population: 70,622 (Urban population: 62,804, Rural population: 868 (43 farm, 825 nonfarm))

Houses: 24,323 (23,315 occupied: 14,405 owner occupied, 8,910 renter occupied)

% of renters here:

38%
State:

44%

Housing density: 686 houses/condos per square mile

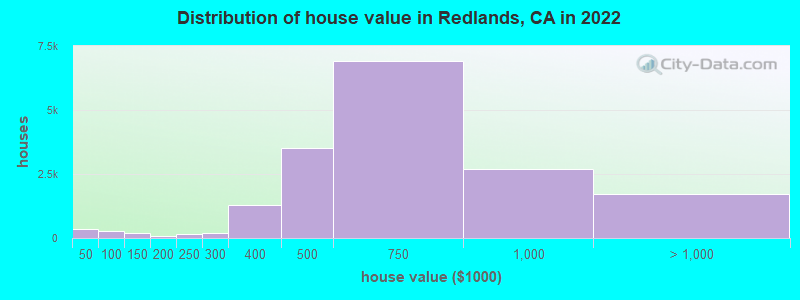
Median price asked for vacant for-sale houses and condos in 2022: $669,530.

Median contract rent in 2022: $1,687 (lower quartile is $1,250, upper quartile is $1,979)


Median rent asked for vacant for-rent units in 2022: $1,533


Median gross rent in Redlands, CA in 2022: $1,880

Housing units in Redlands with a mortgage: 9,324 (742 second mortgage, 44 home equity loan, 438 both second mortgage and home equity loan)
Houses without a mortgage: 68

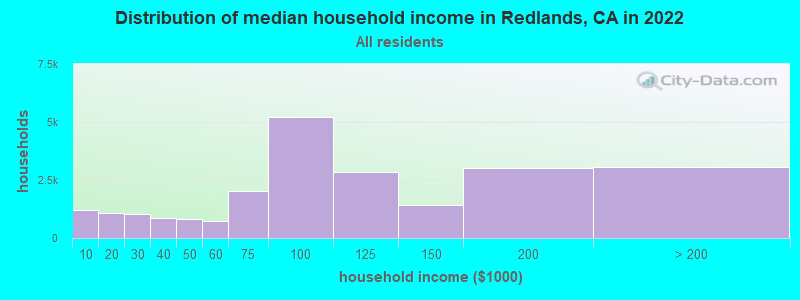
Median household income for houses/condos with a mortgage: $110,628

Median household income for apartments without a mortgage: $111,547

Median monthly housing costs: $1,833

Compare current foreclosures in Redlands, CA:

Check out more offers in Redlands, CA.
Powered by Foreclosure.com

Settings
X
Data:
Loading data...
Based on 2000-2022 data
Loading data...

123
Hide US histogram

Latest news about housing in Redlands, CA collected exclusively by city-data.com from local newspapers, TV, and radio stations

Redlands, California Age and Sex of Residents
Median year house/condo built: 1976

Median year apartment built: 1970

Household type by relationship:

Households: 73,853
  • Male householders: 13,377 (1,835 living alone), Female householders: 9,938 (2,623 living alone)
  • 12,883 spouses (12,848 opposite-sex spouses), 2,595 unmarried partners, (2,595 opposite-sex unmarried partners), 24,042 children (23,035 natural, 364 adopted, 643 stepchildren), 1,377 grandchildren, 1,427 brothers or sisters, 1,093 parents, 0 foster children, 3,030 other relatives, 1,412 non-relatives
  • In group quarters: 2,679

Size of family households: 6,276 2-persons, 4,016 3-persons, 2,709 4-persons, 1,855 5-persons, 926 6-persons, 1,119 7-or-more-persons.

Size of nonfamily households: 4,458 1-person, 1,845 2-persons, 111 3-persons.

10,419 married couples with children.
3,522 single-parent households (1,083 men, 2,439 women).

68.4% of residents of Redlands speak English at home.
21.5% of residents speak Spanish at home (75% speak English very well, 13% speak English well, 8% speak English not well, 4% don't speak English at all).
3.1% of residents speak other Indo-European language at home (73% speak English very well, 18% speak English well, 7% speak English not well, 2% don't speak English at all).
4.7% of residents speak Asian or Pacific Island language at home (52% speak English very well, 34% speak English well, 11% speak English not well, 3% don't speak English at all).
1.3% of residents speak other language at home (80% speak English very well, 16% speak English well, 3% speak English not well).

Foreign born population: 12,582 (17.0%)
(58.2% of them are naturalized citizens)

Median number of rooms in houses and condos:
Here:

6.2
State:

6.0

Median number of rooms in apartments
Here:

4.3
State:

3.9

Owner-occupied Renter-occupied
Bedrooms in owner-occupied houses and condos in Redlands, California
  • Bedrooms in owner-occupied houses and condos in Redlands, California
  • 143no bedroom
  • 341 bedroom
  • 1,4632 bedrooms
  • 6,2943 bedrooms
  • 5,6934 bedrooms
  • 7785+ bedrooms
Bedrooms in renter-occupied apartments in Redlands, California
  • Bedrooms in renter-occupied apartments in Redlands, California
  • 60no bedroom
  • 1,4241 bedroom
  • 4,2522 bedrooms
  • 2,3603 bedrooms
  • 6684 bedrooms
  • 1465+ bedrooms
Owner-occupied Renter-occupied
Cars and other vehicles available in Redlands in owner-occupied houses/condos
  • Cars and other vehicles available in Redlands in owner-occupied houses/condos
  • 205no vehicle
  • 3,2201 vehicle
  • 5,0282 vehicles
  • 2,8923 vehicles
  • 2,1694 vehicles
  • 8915+ vehicles
Cars and other vehicles available in Redlands in renter-occupied apartments
  • Cars and other vehicles available in Redlands in renter-occupied apartments
  • 239no vehicle
  • 2,9581 vehicle
  • 3,5272 vehicles
  • 1,4103 vehicles
  • 7764 vehicles
  • 05+ vehicles
Owner-occupied Renter-occupied
Rooms in owner-occupied houses in Redlands, California
  • Rooms in owner-occupied houses in Redlands, California
  • 831 room
  • 602 rooms
  • 1003 rooms
  • 7754 rooms
  • 3,4335 rooms
  • 3,7896 rooms
  • 2,4447 rooms
  • 1,7008 rooms
  • 2,0219+ rooms
Rooms in renter-occupied apartments in Redlands, California
  • Rooms in renter-occupied apartments in Redlands, California
  • 601 room
  • 4052 rooms
  • 1,5803 rooms
  • 2,9464 rooms
  • 2,5605 rooms
  • 5126 rooms
  • 5027 rooms
  • 3458 rooms
  • 09+ rooms
Year house built
Median 2022 house/condo value by year built
Median house/condo value by year householder moved into unit
Breakdown of mean house values by ages of householders
Owners and renters by unit type in Redlands, CA
  • Redlands, CA household income distribution

  • Distribution of median household income in Redlands, CA in 2022
  • 1,213Less than $10,000
  • 1,063$10,000 to $19,999
  • 1,025$20,000 to $29,999
  • 873$30,000 to $39,999
  • 801$40,000 to $49,999
  • 736$50,000 to $59,999
  • 2,010$60,000 to $74,999
  • 5,205$75,000 to $99,999
  • 2,859$100,000 to $124,999
  • 1,419$125,000 to $149,999
  • 3,030$150,000 to $199,999
  • 3,081$200,000 or more
  • Home value of owner - occupied houses in 2022 in Redlands, CA

  • Distribution of house value in Redlands, CA in 2022
  • 199Less than $10,000
  • 15$10,000 to $14,999
  • 77$15,000 to $19,999
  • 12$25,000 to $29,999
  • 16$30,000 to $34,999
  • 14$35,000 to $39,999
  • 2$40,000 to $49,999
  • 58$50,000 to $59,999
  • 50$60,000 to $69,999
  • 50$70,000 to $79,999
  • 98$80,000 to $89,999
  • 22$90,000 to $99,999
  • 138$100,000 to $124,999
  • 58$125,000 to $149,999
  • 38$150,000 to $174,999
  • 33$175,000 to $199,999
  • 142$200,000 to $249,999
  • 181$250,000 to $299,999
  • 1,286$300,000 to $399,999
  • 3,498$400,000 to $499,999
  • 6,926$500,000 to $749,999
  • 2,687$750,000 to $999,999
  • 1,332$1,000,000 to $1,499,999
  • 187$1,500,000 to $1,999,999
  • 182$2,000,000 or more
  • Rent paid by renters in 2022 in Redlands, CA

  • Distribution of rent paid by renters in Redlands, CA in 2022
  • 38$100 to $149
  • 12$150 to $199
  • 70$200 to $249
  • 134$250 to $299
  • 19$300 to $349
  • 10$350 to $399
  • 166$400 to $449
  • 85$450 to $499
  • 48$500 to $549
  • 51$550 to $599
  • 5$600 to $649
  • 7$650 to $699
  • 50$700 to $749
  • 68$750 to $799
  • 316$800 to $899
  • 295$900 to $999
  • 977$1,000 to $1,249
  • 1,138$1,250 to $1,499
  • 4,197$1,500 to $1,999
  • 2,009$2,000 to $2,499
  • 287$2,500 to $2,999
  • 62$3,000 to $3,499
  • 25$3,500 or more
  • 412No cash rent
Time Leaving Home To Go To Work in 2022

Percentage of workers working in this county: 80.7%
Number of people working at home: 4,855 (14.0% of all workers)

Travel time (in minutes) to work in 2022

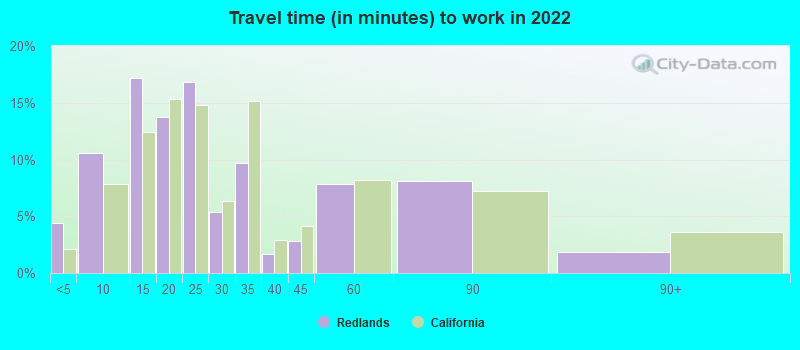
Travel time to work (commute)

  • Less than 5 minutes: 1,317
  • 5 to 9 minutes: 3,695
  • 10 to 14 minutes: 6,224
  • 15 to 19 minutes: 3,563
  • 20 to 24 minutes: 3,613
  • 25 to 29 minutes: 730
  • 30 to 34 minutes: 3,188
  • 35 to 39 minutes: 686
  • 40 to 44 minutes: 564
  • 45 to 59 minutes: 2,565
  • 60 to 89 minutes: 2,470
  • 90 or more minutes: 1,301
Means of transportation to work in 2022 - Redlands

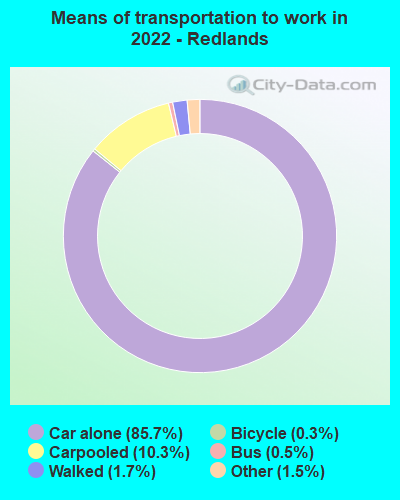
Means of transportation to work:

  • Drove a car alone: 33,254 (75.3%)
  • Carpooled: 4,297 (9.7%)
  • Bus: 201 (0.5%)
  • Long-distance train or commuter rail: 5 (0.0%)
  • Taxi: 644 (1.5%)
  • Bicycle: 114 (0.3%)
  • Walked: 703 (1.6%)
  • Worked at home: 4,855 (11.0%)
Class of Workers in 2022
  • Unemployment by race in 2022
  • Unemployment rate for White non-Hispanic residents
  • 9.1%Males
  • 2.6%Females
  • Unemployment rate for Black residents
  • 24.7%Males
  • 9.5%Females
  • Unemployment rate for Asian residents
  • 3.8%Males
  • 2.1%Females
  • Unemployment rate for other race residents
  • 7.7%Males
  • 7.2%Females
  • Unemployment rate for two or more race residents
  • 12.3%Males
  • Unemployment rate for Hispanic or Latino residents
  • 8.2%Males
  • 3.7%Females
Year of entry for the foreign-born population in Redlands, California
  • Year of entry for the foreign-born population in Redlands, California
  • 2,1702010 or later
  • 2,5522000 to 2009
  • 2,4011990 to 1999
  • 2,4871980 to 1989
  • 1,4321970 to 1979
  • 1,573Before 1970
Ancestries in Redlands, CA

First ancestries reported:

  • English: 1,989 (4.7%)
  • German: 1,618 (3.9%)
  • Irish: 1,300 (3.1%)
  • American: 1,248 (3.0%)
  • European: 1,077 (2.6%)
  • Swedish: 525 (1.2%)
  • Italian: 437 (1.0%)
  • Dutch: 435 (1.0%)
  • French: 407 (1.0%)
  • Norwegian: 356 (0.8%)
  • Polish: 271 (0.6%)
  • Scottish: 251 (0.6%)
  • Romanian: 230 (0.5%)
  • Hungarian: 214 (0.5%)
  • British: 201 (0.5%)
  • Arab: 170 (0.4%)
  • Iranian: 139 (0.3%)
  • Ethiopian: 136 (0.3%)
  • Russian: 134 (0.3%)
  • Egyptian: 131 (0.3%)
  • Nigerian: 131 (0.3%)
  • Jamaican: 127 (0.3%)
  • Welsh: 127 (0.3%)
  • Eastern European: 125 (0.3%)
  • Danish: 108 (0.3%)
  • Canadian: 103 (0.2%)
  • Greek: 89 (0.2%)
  • Swiss: 83 (0.2%)
  • Ghanaian: 81 (0.2%)
  • Portuguese: 78 (0.2%)
  • Northern European: 70 (0.2%)
  • Scandinavian: 68 (0.2%)
  • Syrian: 66 (0.2%)
  • French Canadian: 63 (0.1%)
  • Brazilian: 56 (0.1%)
  • Afghan: 49 (0.1%)
  • Scotch-Irish: 44 (0.1%)
  • Turkish: 44 (0.1%)
  • Haitian: 40 (0.10%)
  • Serbian: 39 (0.09%)
  • Lithuanian: 39 (0.09%)
  • Ukrainian: 31 (0.07%)
  • Belgian: 27 (0.06%)
  • African: 26 (0.06%)
  • Belizean: 21 (0.05%)
  • Slovak: 19 (0.05%)
  • Cape Verdean: 15 (0.04%)
  • Slovene: 15 (0.04%)
  • Yugoslavian: 15 (0.04%)
  • Finnish: 14 (0.03%)
  • Czechoslovakian: 14 (0.03%)
  • Armenian: 13 (0.03%)
  • Australian: 12 (0.03%)
  • Estonian: 11 (0.03%)
  • Luxembourger: 10 (0.02%)
  • Jordanian: 8 (0.02%)
  • Austrian: 4 (0.01%)

Most common places of birth for foreign-born residents (%):

Mexico
Redlands:

35.2% (3,949)
California:

37.2% (3,881,193)

Vietnam
Redlands:

8.0% (897)
California:

4.9% (512,335)

Philippines
Redlands:

5.7% (641)
California:

7.8% (818,297)

India
Redlands:

5.0% (557)
California:

5.2% (539,184)

Korea
Redlands:

4.2% (474)
California:

3.0% (315,248)

China, excluding Hong Kong and Taiwan
Redlands:

3.2% (358)
California:

6.6% (684,672)

England
Redlands:

2.1% (237)
California:

0.6% (57,953)

Syria
Redlands:

1.8% (207)
California:

0.3% (30,949)

Canada
Redlands:

1.8% (204)
California:

1.2% (127,477)

Guatemala
Redlands:

1.6% (180)
California:

2.8% (290,436)

Place of birth for U.S.-born residents:

  • This state: 49,392
  • Other state: 10,992
  • Northeast: 1,396
  • Midwest: 4,197
  • South: 2,634
  • West: 2,765

86.9% of Redlands residents lived in the same house 1 years ago.
   Out of people who lived in different houses, 40.9% lived in this county.
   Out of people who lived in different counties, 77.6% lived in California.


Redlands:

86.9%
State average:

88.9%

Education attainment for males 25 years and older:

  • No schooling: 258
  • Nursery to 4th grade: 0
  • 5th and 6th grade: 296
  • 7th and 8th grade: 37
  • 9th grade: 128
  • 10th grade: 171
  • 11th grade: 240
  • 12th grade, no diploma: 685
  • High school graduate (or equivalency): 5,744
  • Less than 1 year of college: 1,389
  • Some college more than 1 year, no degree: 3,827
  • Associate degree: 1,869
  • Bachelor's degree: 3,495
  • Master's degree: 2,701
  • Professional school degree: 1,112
  • Doctorate degree: 784
Educational Attainment for Males

Education attainment for females 25 years and older:

  • No schooling: 283
  • Nursery to 4th grade: 0
  • 5th and 6th grade: 156
  • 7th and 8th grade: 53
  • 9th grade: 103
  • 10th grade: 99
  • 11th grade: 99
  • 12th grade, no diploma: 162
  • High school graduate (or equivalency): 5,941
  • Less than 1 year of college: 1,142
  • Some college more than 1 year, no degree: 3,256
  • Associate degree: 2,216
  • Bachelor's degree: 4,552
  • Master's degree: 4,057
  • Professional school degree: 593
  • Doctorate degree: 761
Educational Attainment for Females
Redlands marital status for males
Redlands marital status for females

Housing units in structures:

  • One, detached: 17,334
  • One, attached: 988
  • Two: 488
  • 3 or 4: 1,125
  • 5 to 9: 1,426
  • 10 to 19: 718
  • 20 to 49: 365
  • 50 or more: 828
  • Mobile homes: 1,051

Median worth of mobile homes: $121,200

Housing units lacking complete plumbing facilities in 2022: 0.1%

Housing units lacking complete kitchen facilities in 2022: 1.9%

House/condo owner moved in on average 13 years ago

Renter moved in on average 3 years ago

Year householders moved into residence in Redlands
Houses and condos Apartments
Most commonly used house heating fuel in houses and condos in Redlands, CA
  • 82.3%Utility gas
  • 12.8%Electricity
  • 2.3%Bottled, tank, or LP gas
  • 1.0%Solar energy
  • 0.7%No fuel used
  • 0.5%Other fuel
  • 0.3%Wood
Most commonly used house heating fuel in apartments in Redlands, CA
  • 63.4%Utility gas
  • 30.3%Electricity
  • 2.6%Bottled, tank, or LP gas
  • 2.4%No fuel used
  • 0.9%Wood
  • 0.3%Fuel oil, kerosene, etc.
  • 0.2%Other fuel

Private vs. public school enrollment:

Students in private schools in grades 1 to 8 (elementary and middle school): 968
Here:

12.0%
California:

10.5%

Students in private schools in grades 9 to 12 (high school): 390
Here:

10.3%
California:

8.5%

Students in private undergraduate colleges: 1,991
Here:

30.0%
California:

15.9%
School Enrollment by Level of School for Male Students
School Enrollment by Level of School for Female Students
Age and Sex of Sensory-Disabled Noninstitutionalized Residents
Age and Sex of Physically-Disabled Noninstitutionalized Residents
Age and Sex of Mentally-Disabled Noninstitutionalized Residents
Age and Sex of Self-Care Disabled Noninstitutionalized Residents
Age and Sex of Go-Outside-Home Disabled Noninstitutionalized Residents
Age and Sex of Noninstitutionalized Residents with Employment Disability