Housing density: 1,645 houses/condos per square mile
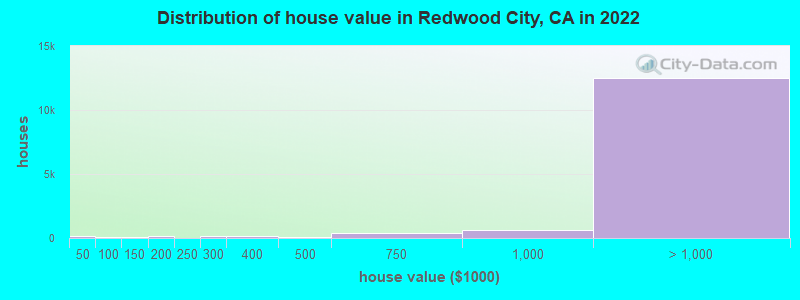
Median price asked for vacant for-sale houses and condos in 2022: $2,205,148.
Median contract rent in 2022: over $2,000 (lower quartile is $1,896, upper quartile is over $2,000)
Median rent asked for vacant for-rent units in 2022: $4,145
Median gross rent in Redwood City, CA in 2022: over $2,000
Housing units in Redwood City with a mortgage: 9,214 (990 second mortgage, 157 home equity loan, 796 both second mortgage and home equity loan) Houses without a mortgage: 46
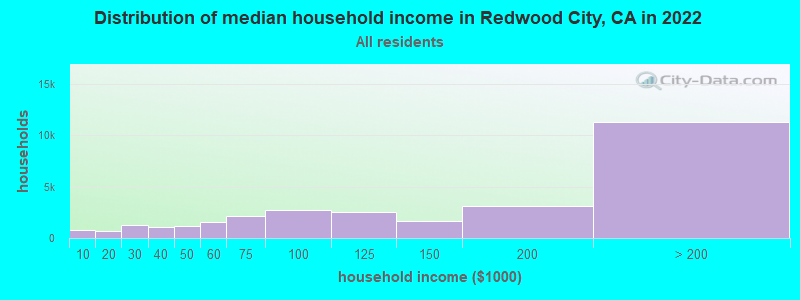
Median household income for houses/condos with a mortgage: $250,001
Median household income for apartments without a mortgage: $102,059
12,070 married couples with children.
3,000 single-parent households (723 men, 2,277 women).
55.1% of residents of Redwood City speak English at home.
25.7% of residents speak Spanish at home (60% speak English very well, 14% speak English well, 18% speak English not well, 8% don't speak English at all).
6.9% of residents speak other Indo-European language at home (80% speak English very well, 16% speak English well, 3% speak English not well, 1% don't speak English at all).
10.3% of residents speak Asian or Pacific Island language at home (69% speak English very well, 24% speak English well, 5% speak English not well, 3% don't speak English at all).
0.6% of residents speak other language at home (67% speak English very well, 26% speak English well, 8% speak English not well).
Foreign born population: 25,691 (31.9%)
(38.6% of them are naturalized citizens)
Percentage of workers working in this county: 75.1% Number of people working at home: 10,799 (26.2% of all workers)
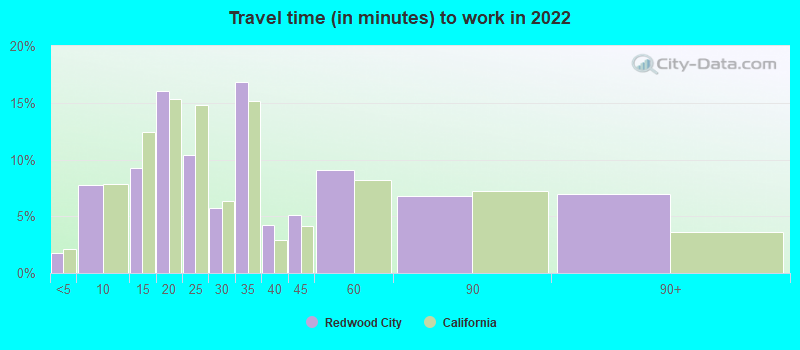
Travel time to work (commute)
Less than 5 minutes: 957
5 to 9 minutes: 2,296
10 to 14 minutes: 4,961
15 to 19 minutes: 6,924
20 to 24 minutes: 3,804
25 to 29 minutes: 2,501
30 to 34 minutes: 4,644
35 to 39 minutes: 1,557
40 to 44 minutes: 489
45 to 59 minutes: 1,213
60 to 89 minutes: 815
90 or more minutes: 316
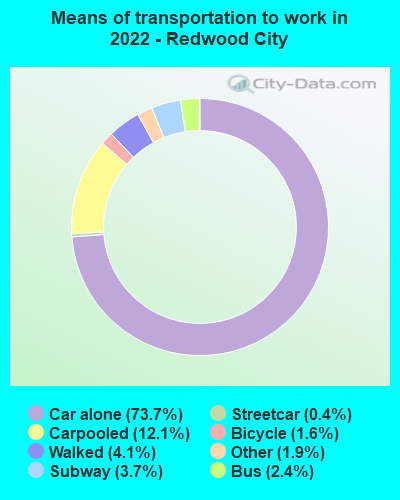
Means of transportation to work:
Drove a car alone: 29,047 (57.8%)
Carpooled: 4,778 (9.5%)
Bus: 961 (1.9%)
Subway or elevated rail: 151 (0.3%)
Long-distance train or commuter rail: 1,461 (2.9%)
Light rail, streetcar or trolley: 30 (0.1%)
Taxi: 736 (1.5%)
Bicycle: 617 (1.2%)
Walked: 1,635 (3.3%)
Worked at home: 10,799 (21.5%)
Unemployment by race in 2022
Unemployment rate for White non-Hispanic residents
0.4%Males
1.6%Females
Unemployment rate for Black residents
3.1%Females
Unemployment rate for American Indian and Alaska Native residents
1.7%Males
12.2%Females
Unemployment rate for Asian residents
1.9%Males
5.1%Females
Unemployment rate for other race residents
2.0%Males
5.2%Females
Unemployment rate for two or more race residents
3.6%Males
1.8%Females
Unemployment rate for Hispanic or Latino residents
2.0%Males
2.2%Females
Year of entry for the foreign-born population in Redwood City, California
8,1522010 or later
6,6302000 to 2009
5,1021990 to 1999
6,3581980 to 1989
3,2801970 to 1979
3,223Before 1970
First ancestries reported:
American: 2,300 (4.8%)
English: 1,505 (3.1%)
Italian: 1,429 (3.0%)
Irish: 1,310 (2.7%)
German: 1,165 (2.4%)
European: 831 (1.7%)
Russian: 564 (1.2%)
Ukrainian: 419 (0.9%)
Iranian: 409 (0.9%)
Polish: 403 (0.8%)
French: 294 (0.6%)
Swedish: 214 (0.4%)
Norwegian: 212 (0.4%)
Scottish: 198 (0.4%)
Dutch: 194 (0.4%)
Eastern European: 184 (0.4%)
Northern European: 180 (0.4%)
Greek: 178 (0.4%)
Lebanese: 176 (0.4%)
West Indian: 174 (0.4%)
Portuguese: 173 (0.4%)
Armenian: 167 (0.3%)
British: 164 (0.3%)
Brazilian: 148 (0.3%)
Jamaican: 137 (0.3%)
Romanian: 127 (0.3%)
Hungarian: 104 (0.2%)
Egyptian: 95 (0.2%)
Maltese: 94 (0.2%)
Turkish: 88 (0.2%)
Danish: 85 (0.2%)
Scotch-Irish: 82 (0.2%)
Serbian: 76 (0.2%)
Austrian: 75 (0.2%)
Palestinian: 72 (0.1%)
Canadian: 71 (0.1%)
French Canadian: 68 (0.1%)
Scandinavian: 57 (0.1%)
Croatian: 52 (0.1%)
Arab: 49 (0.1%)
Swiss: 46 (0.10%)
Ghanaian: 43 (0.09%)
Czech: 43 (0.09%)
Jordanian: 43 (0.09%)
Haitian: 40 (0.08%)
Israeli: 37 (0.08%)
Australian: 37 (0.08%)
Nigerian: 33 (0.07%)
Yugoslavian: 30 (0.06%)
Afghan: 29 (0.06%)
Ethiopian: 27 (0.06%)
African: 26 (0.05%)
Finnish: 24 (0.05%)
Basque: 17 (0.04%)
Pennsylvania German: 15 (0.03%)
Moroccan: 14 (0.03%)
Belgian: 13 (0.03%)
Barbadian: 13 (0.03%)
Iraqi: 10 (0.02%)
Slovak: 9 (0.02%)
Czechoslovakian: 7 (0.01%)
Macedonian: 7 (0.01%)
Welsh: 7 (0.01%)
Latvian: 7 (0.01%)
Slovene: 7 (0.01%)
Carpatho Rusyn: 6 (0.01%)
Syrian: 5 (0.01%)
Bahamian: 4 (0.01%)
Most common places of birth for foreign-born residents (%):
Mexico
Redwood City:
30.8% (8,218)
California:
37.2% (3,881,193)
China, excluding Hong Kong and Taiwan
Redwood City:
10.5% (2,800)
California:
6.6% (684,672)
India
Redwood City:
5.3% (1,425)
California:
5.2% (539,184)
Philippines
Redwood City:
5.3% (1,419)
California:
7.8% (818,297)
Guatemala
Redwood City:
4.5% (1,197)
California:
2.8% (290,436)
El Salvador
Redwood City:
4.3% (1,143)
California:
4.2% (440,287)
Korea
Redwood City:
2.1% (568)
California:
3.0% (315,248)
Iran
Redwood City:
1.9% (510)
California:
2.0% (206,004)
Peru
Redwood City:
1.9% (501)
California:
0.7% (74,025)
Canada
Redwood City:
1.9% (499)
California:
1.2% (127,477)
Nicaragua
Redwood City:
1.7% (447)
California:
0.6% (58,161)
Taiwan
Redwood City:
1.6% (424)
California:
1.7% (176,274)
Japan
Redwood City:
1.6% (421)
California:
1.0% (103,575)
Ukraine
Redwood City:
1.5% (403)
California:
0.6% (60,761)
Russia
Redwood City:
1.5% (403)
California:
0.7% (71,932)
Place of birth for U.S.-born residents:
This state: 40,255
Other state: 12,879
Northeast: 3,914
Midwest: 2,504
South: 3,373
West: 3,088
84.9% of Redwood City residents lived in the same house 1 years ago. Out of people who lived in different houses, 29.7% lived in this county. Out of people who lived in different counties, 69.8% lived in California.
Redwood City:
84.9%
State average:
88.9%
Education attainment for males 25 years and older:
No schooling: 1,024
Nursery to 4th grade: 0
5th and 6th grade: 630
7th and 8th grade: 87
9th grade: 98
10th grade: 182
11th grade: 387
12th grade, no diploma: 292
High school graduate (or equivalency): 3,323
Less than 1 year of college: 2,351
Some college more than 1 year, no degree: 2,478
Associate degree: 1,118
Bachelor's degree: 7,341
Master's degree: 6,555
Professional school degree: 917
Doctorate degree: 1,591
Education attainment for females 25 years and older:
No schooling: 900
Nursery to 4th grade: 188
5th and 6th grade: 461
7th and 8th grade: 508
9th grade: 82
10th grade: 280
11th grade: 111
12th grade, no diploma: 366
High school graduate (or equivalency): 3,195
Less than 1 year of college: 1,270
Some college more than 1 year, no degree: 2,662
Associate degree: 2,023
Bachelor's degree: 8,408
Master's degree: 5,788
Professional school degree: 1,331
Doctorate degree: 503
Housing units in structures:
One, detached: 13,807
One, attached: 3,601
Two: 635
3 or 4: 1,381
5 to 9: 2,193
10 to 19: 3,167
20 to 49: 1,993
50 or more: 4,568
Mobile homes: 648
Boats, RVs, vans, etc.: 41
Median worth of mobile homes: $321,870
Housing units lacking complete plumbing facilities in 2022: 0.5%
Housing units lacking complete kitchen facilities in 2022: 0.1%
House/condo owner moved in on average 15 years ago