Reno, NV (Nevada) Houses and Residents
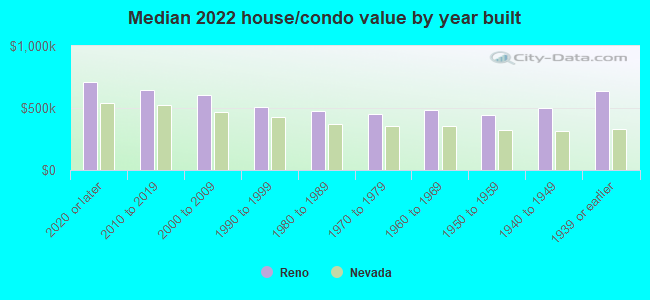
| Reno: | $539,600 |
| Nevada: | $434,700 |
Mean price in 2022:
Detached houses: $638,036
Here: $638,036 State: $549,327 Townhouses or other attached units: $370,628
Here: $370,628 State: $328,893 In 3-to-4-unit structures: $476,148
Here: $476,148 State: $295,216 In 5-or-more-unit structures: $292,416
Here: $292,416 State: $297,847 Mobile homes: $95,952
Here: $95,952 State: $159,995 Occupied boats, RVs, vans, etc.: $54,746
Here: $54,746 State: $92,244
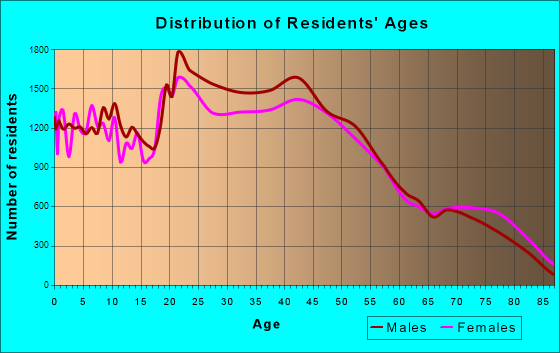
Total population: 236,995 (Urban population: 180,375, Rural population: 283 (all nonfarm))
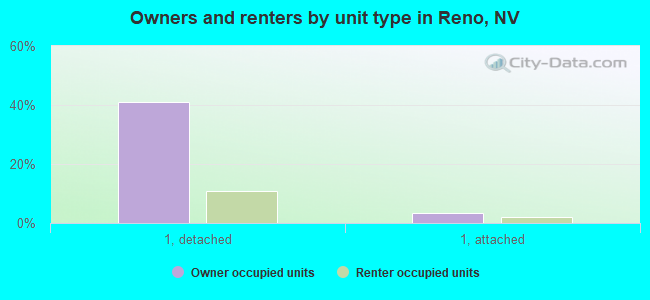
Houses: 123,380 (114,106 occupied: 57,192 owner occupied, 56,914 renter occupied)
| % of renters here: | 50% |
| State: | 40% |
Housing density: 1,785 houses/condos per square mile
Median price asked for vacant for-sale houses and condos in 2022: $609,863.
Median contract rent in 2022: $1,310 (lower quartile is $1,017, upper quartile is $1,756)
Median rent asked for vacant for-rent units in 2022: $2,278
Median gross rent in Reno, NV in 2022: $1,430
Housing units in Reno with a mortgage: 35,644 (2,684 second mortgage, 99 home equity loan, 2,495 both second mortgage and home equity loan)
Houses without a mortgage: 562
Median household income for houses/condos with a mortgage: $116,008
Median household income for apartments without a mortgage: $77,575
Median monthly housing costs: $1,395
Compare current foreclosures in Reno, NV:
| Photo | Address | Area | Beds / Baths | Price | Details |
|---|---|---|---|---|---|

|
#1
Sapphire Canyon Ct
Reno, NV 89508
|
2,114 sq. feet
|
2 baths 4 beds |
show details | |

|
#2
White Sage Dr
Reno, NV 89506
|
1,284 sq. feet
|
2 baths 3 beds |
show details | |

|
#3
Sirius Ct
Reno, NV 89506
|
1,564 sq. feet
|
2 baths 4 beds |
show details | |

|
#4
E Hidden Valley Dr
Reno, NV 89502
|
2,068 sq. feet
|
3 baths 5 beds |
show details | |

|
#5
Green Mountain St
Reno, NV 89506
|
1,192 sq. feet
|
1 baths 3 beds |
show details | |

|
#6
Copper Ridge Circle
Reno, NV 89511
|
- sq. feet
|
3 baths 4 beds |
show details | |

|
#7
Flower St
Reno, NV 89506
|
1,250 sq. feet
|
2 baths 4 beds |
show details | |

|
#8
Welsh Dr
Reno, NV 89506
|
2,222 sq. feet
|
2 baths 4 beds |
show details | |

|
#9
Northridge Ave
Reno, NV 89508
|
1,560 sq. feet
|
2 baths 3 beds |
show details | |

|
#10
Lytton Rd
Reno, NV 89506
|
1,454 sq. feet
|
2 baths 3 beds |
show details |
| Photo | Address | Area | Beds / Baths | Price | Details |
|---|---|---|---|---|---|

|
#11
Hts Dr
Reno, NV 89503
|
2,012 sq. feet
|
2 baths 4 beds |
show details | |

|
#12
Denslowe Dr
Reno, NV 89512
|
1,230 sq. feet
|
2 baths 3 beds |
show details | |

|
#13
Dakota Way
Reno, NV 89506
|
1,988 sq. feet
|
3 baths 4 beds |
show details | |

|
#14
Rayburn Dr
Reno, NV 89503
|
1,308 sq. feet
|
1 baths 3 beds |
show details | |

|
#15
Lotus St
Reno, NV 89506
|
1,080 sq. feet
|
2 baths 3 beds |
show details | |

|
#16
Denali Way
Reno, NV 89506
|
1,583 sq. feet
|
2 baths 3 beds |
show details | |

|
#17
Sutcliffe Dr Trlr
Reno, NV 89510
|
993 sq. feet
|
1 baths 1 beds |
show details | |

|
#18
Terrace Knoll Ct
Reno, NV 89512
|
1,110 sq. feet
|
1 baths 2 beds |
show details | |

|
#19
Butler St
Reno, NV 89512
|
888 sq. feet
|
1 baths 3 beds |
show details | |

|
#20
Emerald Bay Dr
Reno, NV 89521
|
1,765 sq. feet
|
2 baths 4 beds |
show details |
| Photo | Address | Area | Beds / Baths | Price | Details |
|---|---|---|---|---|---|

|
#21
Zeolite Dr
Reno, NV 89506
|
1,827 sq. feet
|
2 baths 4 beds |
show details | |

|
#22
Fossil Ct
Reno, NV 89508
|
1,696 sq. feet
|
2 baths 3 beds |
show details | |

|
#23
Cold Springs Dr
Reno, NV 89508
|
1,456 sq. feet
|
2 baths 3 beds |
show details | |

|
#24
Pin Oak Ct
Reno, NV 89508
|
1,696 sq. feet
|
2 baths 3 beds |
show details | |

|
#25
Moore Ln
Reno, NV 89509
|
3,087 sq. feet
|
2 baths 3 beds |
show details | |

|
#26
Greenwich Way
Reno, NV 89519
|
2,223 sq. feet
|
3 baths 3 beds |
show details | |

|
#27
Zeolite Dr
Reno, NV 89506
|
1,827 sq. feet
|
2 baths 4 beds |
show details | |

|
#28
Bowie Rd
Reno, NV 89503
|
1,215 sq. feet
|
2 baths 3 beds |
show details | |

|
#29
Antelope Valley Rd
Reno, NV 89506
|
1,900 sq. feet
|
2 baths 3 beds |
show details | |

|
#30
Santa Ana Dr
Reno, NV 89502
|
1,815 sq. feet
|
2 baths 3 beds |
show details |
| Photo | Address | Area | Beds / Baths | Price | Details |
|---|---|---|---|---|---|

|
#31
Pisces Cir
Reno, NV 89521
|
1,344 sq. feet
|
2 baths 3 beds |
show details | |

|
#32
Vine Creek Ct
Reno, NV 89506
|
1,468 sq. feet
|
2 baths 3 beds |
show details | |

|
#33
Emerald Pl
Reno, NV 89502
|
1,040 sq. feet
|
1 baths 3 beds |
show details | |

|
#34
Long Hollow Dr
Reno, NV 89521
|
2,945 sq. feet
|
2 baths 4 beds |
show details | |

|
#35
Roberts St
Reno, NV 89502
|
1,842 sq. feet
|
2 baths 4 beds |
show details | |

|
#36
Elko Ave
Reno, NV 89512
|
2,064 sq. feet
|
2 baths 8 beds |
show details | |

|
#37
Meridian Ranch Dr
Reno, NV 89523
|
1,824 sq. feet
|
2 baths 3 beds |
show details | |

|
#38
Red Baron Blvd
Reno, NV 89506
|
1,350 sq. feet
|
2 baths 3 beds |
show details | |

|
#39
Fir Dr
Reno, NV 89506
|
1,151 sq. feet
|
2 baths 3 beds |
show details | |

|
#40
Stardust St
Reno, NV 89503
|
1,336 sq. feet
|
2 baths 3 beds |
show details |
| Photo | Address | Area | Beds / Baths | Price | Details |
|---|---|---|---|---|---|

|
#41
Surf Way
Reno, NV 89503
|
1,354 sq. feet
|
2 baths 3 beds |
show details | |

|
#42
E Patrician Dr
Reno, NV 89506
|
1,007 sq. feet
|
1 baths 3 beds |
show details | |

|
#43
Radford Dr
Reno, NV 89511
|
1,753 sq. feet
|
2 baths 3 beds |
show details | |

|
#44
Auburn Way
Reno, NV 89502
|
1,008 sq. feet
|
1 baths 3 beds |
show details | |

|
#45
Golden Eagle Dr
Reno, NV 89523
|
1,355 sq. feet
|
2 baths 3 beds |
show details | |

|
#46
Ranchita Way
Reno, NV 89502
|
1,634 sq. feet
|
2 baths 3 beds |
show details | |

|
#47
W 12th St
Reno, NV 89503
|
1,515 sq. feet
|
2 baths 3 beds |
show details | |

|
#48
Cassandra Ct
Reno, NV 89523
|
1,553 sq. feet
|
2 baths 3 beds |
show details | |

|
#49
Pin Oak Ct
Reno, NV 89508
|
1,696 sq. feet
|
2 baths 3 beds |
show details | |

|
Check over 1 million property listings on Foreclosure.com!
|
browse all offers | |||

Latest news about housing in Reno, NV collected exclusively by city-data.com from local newspapers, TV, and radio stations


Median year apartment built: 1987
Household type by relationship:
Households: 273,447- Male householders: 60,154 (19,985 living alone), Female householders: 53,952 (18,128 living alone)
41,203 spouses (40,320 opposite-sex spouses), 11,487 unmarried partners, (11,160 opposite-sex unmarried partners), 66,504 children (62,528 natural, 1,149 adopted, 2,827 stepchildren), 3,121 grandchildren, 4,056 brothers or sisters, 4,935 parents, 711 foster children, 4,585 other relatives, 16,620 non-relatives
- In group quarters: 6,119
Size of family households: 28,071 2-persons, 15,551 3-persons, 11,922 4-persons, 6,113 5-persons, 836 6-persons, 1,283 7-or-more-persons.
Size of nonfamily households: 38,113 1-person, 9,059 2-persons, 2,026 3-persons, 958 4-persons, 57 5-persons, 117 6-persons.
27,798 married couples with children.
18,495 single-parent households (6,987 men, 11,508 women).
78.0% of residents of Reno speak English at home.
14.8% of residents speak Spanish at home (65% speak English very well, 16% speak English well, 12% speak English not well, 8% don't speak English at all).
2.4% of residents speak other Indo-European language at home (74% speak English very well, 17% speak English well, 8% speak English not well).
3.9% of residents speak Asian or Pacific Island language at home (70% speak English very well, 17% speak English well, 11% speak English not well, 2% don't speak English at all).
0.6% of residents speak other language at home (66% speak English very well, 24% speak English well, 8% speak English not well, 1% don't speak English at all).
Foreign born population: 41,788 (15.3%)
(43.2% of them are naturalized citizens)
| Here: | 6.1 |
| State: | 6.0 |
| Here: | 3.8 |
| State: | 4.2 |
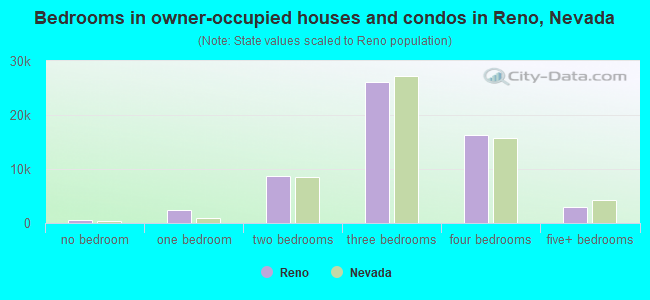
- Bedrooms in owner-occupied houses and condos in Reno, Nevada
- 572no bedroom
- 2,3571 bedroom
- 8,7532 bedrooms
- 26,1523 bedrooms
- 16,3354 bedrooms
- 3,0235+ bedrooms
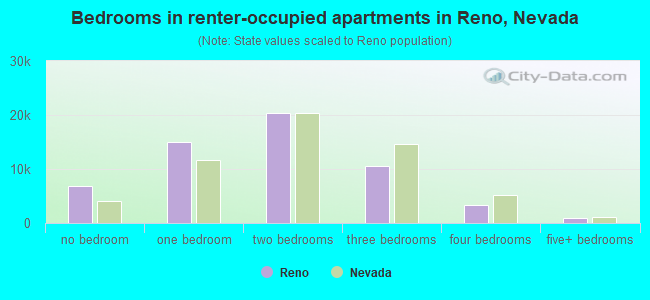
- Bedrooms in renter-occupied apartments in Reno, Nevada
- 6,820no bedroom
- 14,9961 bedroom
- 20,4182 bedrooms
- 10,5003 bedrooms
- 3,2784 bedrooms
- 9025+ bedrooms
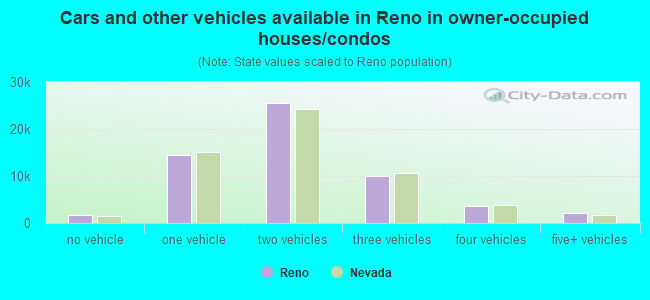
- Cars and other vehicles available in Reno in owner-occupied houses/condos
- 1,676no vehicle
- 14,4861 vehicle
- 25,4762 vehicles
- 9,9363 vehicles
- 3,5734 vehicles
- 2,0455+ vehicles
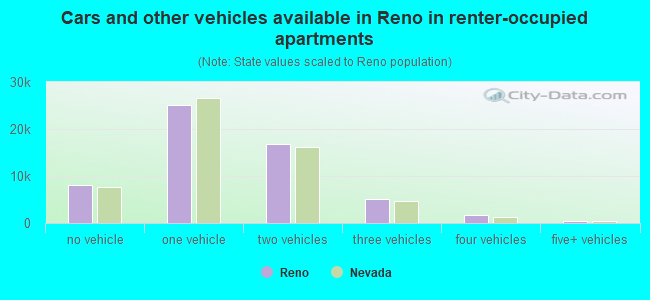
- Cars and other vehicles available in Reno in renter-occupied apartments
- 8,049no vehicle
- 25,0131 vehicle
- 16,7472 vehicles
- 5,0453 vehicles
- 1,6524 vehicles
- 4085+ vehicles
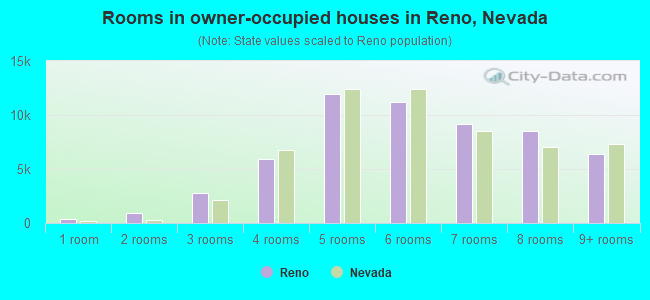
- Rooms in owner-occupied houses in Reno, Nevada
- 3841 room
- 9492 rooms
- 2,7343 rooms
- 5,9224 rooms
- 11,9505 rooms
- 11,1706 rooms
- 9,1867 rooms
- 8,5498 rooms
- 6,3489+ rooms
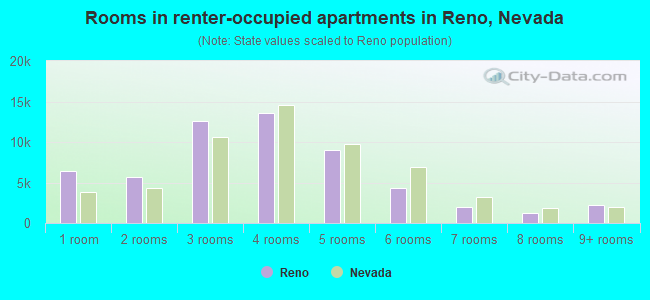
- Rooms in renter-occupied apartments in Reno, Nevada
- 6,4551 room
- 5,6202 rooms
- 12,5403 rooms
- 13,5784 rooms
- 9,0495 rooms
- 4,2866 rooms
- 1,9927 rooms
- 1,2258 rooms
- 2,1699+ rooms
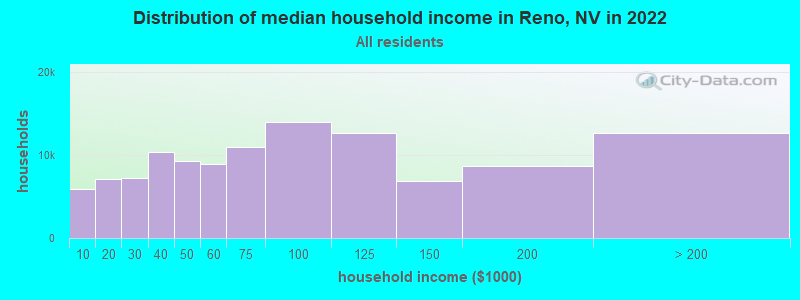
Reno, NV household income distribution

- 5,908Less than $10,000
- 7,047$10,000 to $19,999
- 7,262$20,000 to $29,999
- 10,353$30,000 to $39,999
- 9,196$40,000 to $49,999
- 8,846$50,000 to $59,999
- 10,928$60,000 to $74,999
- 13,938$75,000 to $99,999
- 12,571$100,000 to $124,999
- 6,864$125,000 to $149,999
- 8,598$150,000 to $199,999
- 12,595$200,000 or more
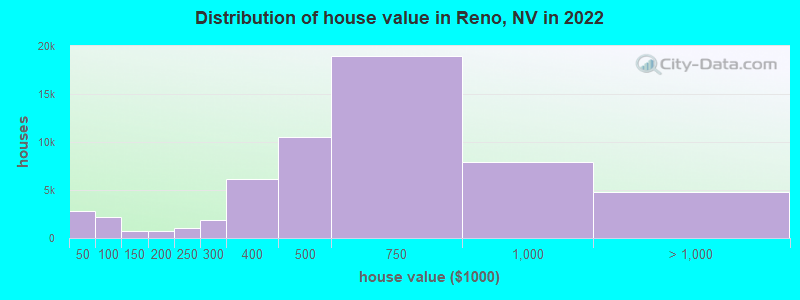
Home value of owner - occupied houses in 2022 in Reno, NV
-
- 1,198Less than $10,000
- 53$10,000 to $14,999
- 271$15,000 to $19,999
- 317$20,000 to $24,999
- 137$25,000 to $29,999
- 256$30,000 to $34,999
- 135$35,000 to $39,999
- 449$40,000 to $49,999
- 765$50,000 to $59,999
- 326$60,000 to $69,999
- 455$80,000 to $89,999
- 188$90,000 to $99,999
- 725$100,000 to $124,999
- 52$125,000 to $149,999
- 478$150,000 to $174,999
- 254$175,000 to $199,999
- 1,034$200,000 to $249,999
- 1,839$250,000 to $299,999
- 6,127$300,000 to $399,999
- 10,524$400,000 to $499,999
- 18,998$500,000 to $749,999
- 7,869$750,000 to $999,999
- 3,303$1,000,000 to $1,499,999
- 493$1,500,000 to $1,999,999
- 946$2,000,000 or more
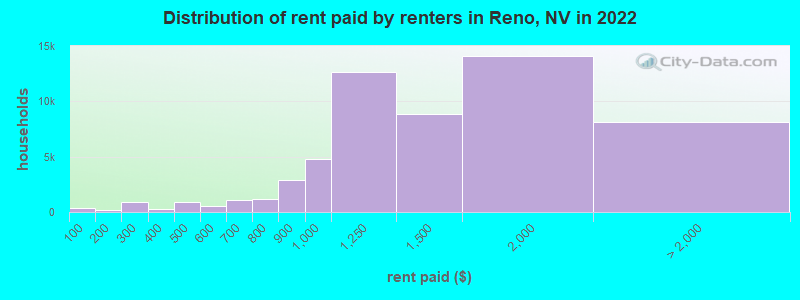
Rent paid by renters in 2022 in Reno, NV
-
- 366Less than $100
- 168$150 to $199
- 450$200 to $249
- 468$250 to $299
- 245$300 to $349
- 68$350 to $399
- 883$400 to $449
- 204$500 to $549
- 300$550 to $599
- 338$600 to $649
- 749$650 to $699
- 332$700 to $749
- 847$750 to $799
- 2,930$800 to $899
- 4,788$900 to $999
- 12,669$1,000 to $1,249
- 8,888$1,250 to $1,499
- 14,102$1,500 to $1,999
- 4,609$2,000 to $2,499
- 1,209$2,500 to $2,999
- 1,037$3,000 to $3,499
- 242$3,500 or more
- 1,022No cash rent
Percentage of workers working in this county: 94.1%
Number of people working at home: 13,884 (9.7% of all workers)
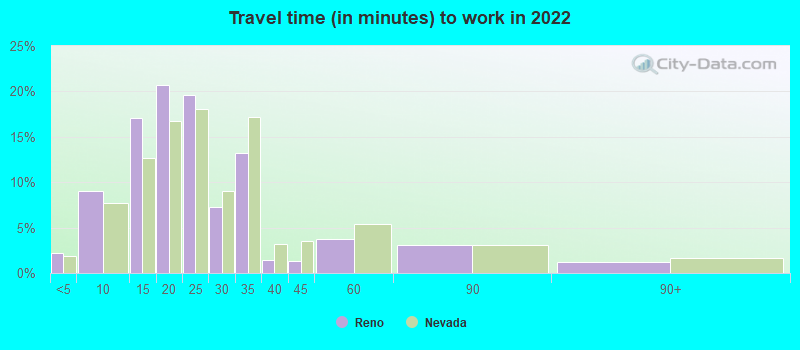
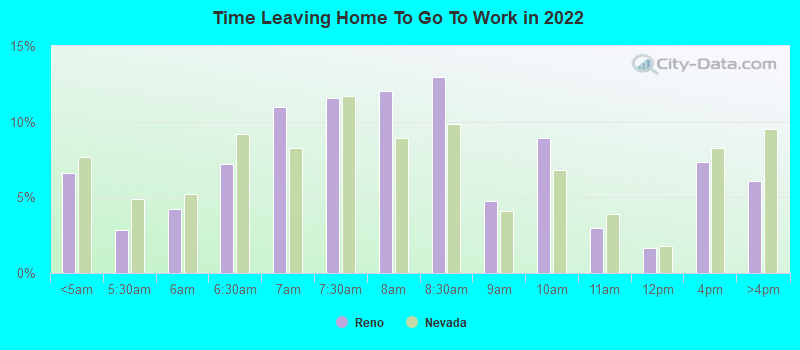
Travel time to work (commute)
- Less than 5 minutes: 3,226
- 5 to 9 minutes: 14,103
- 10 to 14 minutes: 23,934
- 15 to 19 minutes: 28,022
- 20 to 24 minutes: 25,921
- 25 to 29 minutes: 7,910
- 30 to 34 minutes: 14,472
- 35 to 39 minutes: 2,389
- 40 to 44 minutes: 1,521
- 45 to 59 minutes: 4,078
- 60 to 89 minutes: 3,259
- 90 or more minutes: 996
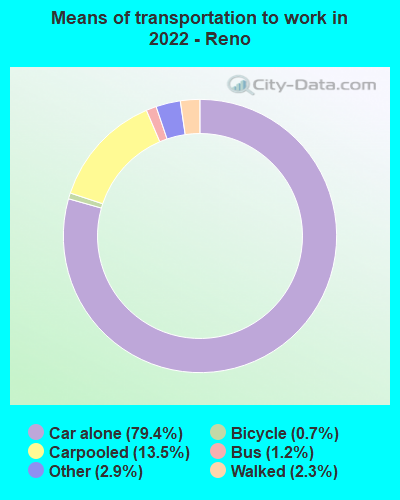
Means of transportation to work:
- Drove a car alone: 122,012 (72.8%)
- Carpooled: 20,824 (12.4%)
- Bus: 1,775 (1.1%)
- Taxi: 4,483 (2.7%)
- Bicycle: 1,129 (0.7%)
- Walked: 3,524 (2.1%)
- Worked at home: 13,884 (8.3%)
- Unemployment by race in 2022
- Unemployment rate for White non-Hispanic residents
- 2.8%Males
- 8.0%Females
- Unemployment rate for Black residents
- 16.4%Males
- 3.8%Females
- Unemployment rate for American Indian and Alaska Native residents
- 4.5%Males
- 3.9%Females
- Unemployment rate for Asian residents
- 1.6%Males
- 7.8%Females
- Unemployment rate for other race residents
- 3.4%Males
- 11.1%Females
- Unemployment rate for two or more race residents
- 3.7%Males
- 8.7%Females
- Unemployment rate for Hispanic or Latino residents
- 4.1%Males
- 9.7%Females
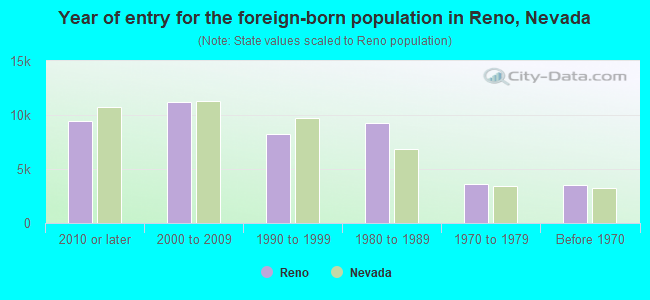
- Year of entry for the foreign-born population in Reno, Nevada
- 9,4682010 or later
- 11,2102000 to 2009
- 8,2451990 to 1999
- 9,2331980 to 1989
- 3,5971970 to 1979
- 3,540Before 1970
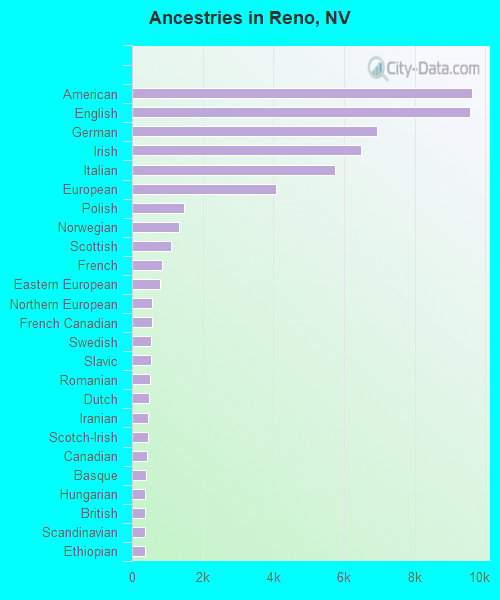
First ancestries reported:
- American: 9,626 (6.9%)
- English: 9,558 (6.8%)
- German: 6,941 (5.0%)
- Irish: 6,488 (4.6%)
- Italian: 5,756 (4.1%)
- European: 4,078 (2.9%)
- Polish: 1,467 (1.1%)
- Norwegian: 1,324 (0.9%)
- Scottish: 1,113 (0.8%)
- French: 854 (0.6%)
- Eastern European: 782 (0.6%)
- Northern European: 559 (0.4%)
- French Canadian: 559 (0.4%)
- Swedish: 547 (0.4%)
- Slavic: 538 (0.4%)
- Romanian: 510 (0.4%)
- Dutch: 473 (0.3%)
- Iranian: 454 (0.3%)
- Scotch-Irish: 440 (0.3%)
- Canadian: 414 (0.3%)
- Basque: 407 (0.3%)
- Hungarian: 375 (0.3%)
- British: 367 (0.3%)
- Scandinavian: 367 (0.3%)
- Ethiopian: 361 (0.3%)
- Swiss: 358 (0.3%)
- Portuguese: 349 (0.3%)
- Nigerian: 325 (0.2%)
- Armenian: 312 (0.2%)
- Czech: 311 (0.2%)
- African: 291 (0.2%)
- Lebanese: 284 (0.2%)
- Russian: 284 (0.2%)
- Greek: 281 (0.2%)
- Kenyan: 206 (0.1%)
- Croatian: 197 (0.1%)
- Danish: 197 (0.1%)
- Lithuanian: 193 (0.1%)
- Haitian: 181 (0.1%)
- Welsh: 147 (0.1%)
- Finnish: 137 (0.10%)
- Serbian: 130 (0.09%)
- Austrian: 124 (0.09%)
- Trinidadian and Tobagonian: 118 (0.08%)
- Syrian: 98 (0.07%)
- Ukrainian: 91 (0.07%)
- Liberian: 88 (0.06%)
- Zimbabwean: 67 (0.05%)
- Australian: 65 (0.05%)
- Yugoslavian: 65 (0.05%)
- Jamaican: 64 (0.05%)
- Bulgarian: 59 (0.04%)
- Assyrian: 53 (0.04%)
- Brazilian: 38 (0.03%)
- Latvian: 34 (0.02%)
- Macedonian: 33 (0.02%)
- Slovene: 31 (0.02%)
- Belgian: 30 (0.02%)
- Slovak: 29 (0.02%)
- Czechoslovakian: 26 (0.02%)
- Moroccan: 25 (0.02%)
- Maltese: 17 (0.01%)
- Cajun: 16 (0.01%)
- Arab: 14 (0.01%)
- Iraqi: 13 (0.01%)
- Icelander: 11 (0.01%)
- Celtic: 10 (0.01%)
- New Zealander: 8 (0.01%)
- Israeli: 7 (0.01%)
Most common places of birth for foreign-born residents (%):
| Reno: | 33.8% (14,437) |
| Nevada: | 36.8% (218,248) |
| Reno: | 15.0% (6,399) |
| Nevada: | 15.5% (91,628) |
| Reno: | 6.3% (2,670) |
| Nevada: | 4.0% (23,923) |
| Reno: | 4.5% (1,915) |
| Nevada: | 2.4% (14,384) |
| Reno: | 3.9% (1,654) |
| Nevada: | 1.5% (9,074) |
| Reno: | 2.3% (981) |
| Nevada: | 3.3% (19,621) |
| Reno: | 2.3% (965) |
| Nevada: | 1.9% (11,407) |
| Reno: | 1.8% (782) |
| Nevada: | 0.9% (5,149) |
| Reno: | 1.6% (703) |
| Nevada: | 2.0% (11,718) |
| Reno: | 1.6% (683) |
| Nevada: | 0.2% (1,128) |
Place of birth for U.S.-born residents:
- This state: 87,134
- Other state: 137,925
- Northeast: 10,304
- Midwest: 18,339
- South: 15,105
- West: 94,177
83.4% of Reno residents lived in the same house 1 years ago.
Out of people who lived in different houses, 40.3% lived in this county.
Out of people who lived in different counties, 30.7% lived in Nevada.
| Reno: | 83.4% |
| State average: | 86.4% |
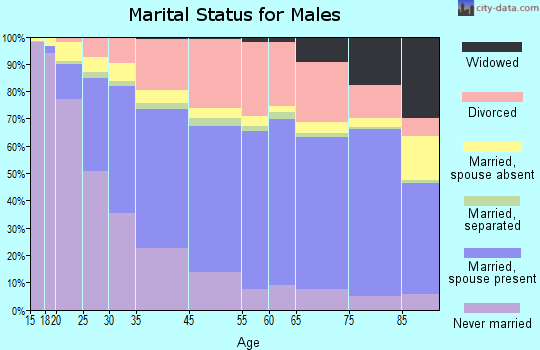
Education attainment for males 25 years and older:
- No schooling: 2,357
- Nursery to 4th grade: 1,559
- 5th and 6th grade: 1,503
- 7th and 8th grade: 1,362
- 9th grade: 954
- 10th grade: 1,544
- 11th grade: 728
- 12th grade, no diploma: 1,510
- High school graduate (or equivalency): 22,462
- Less than 1 year of college: 7,577
- Some college more than 1 year, no degree: 16,528
- Associate degree: 9,024
- Bachelor's degree: 18,290
- Master's degree: 7,058
- Professional school degree: 3,502
- Doctorate degree: 2,370

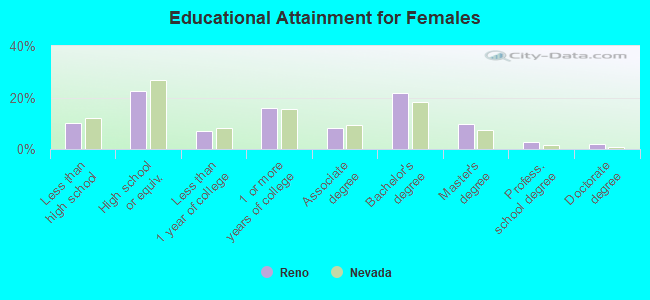
Education attainment for females 25 years and older:
- No schooling: 2,100
- Nursery to 4th grade: 280
- 5th and 6th grade: 1,169
- 7th and 8th grade: 729
- 9th grade: 1,371
- 10th grade: 1,991
- 11th grade: 693
- 12th grade, no diploma: 1,080
- High school graduate (or equivalency): 21,028
- Less than 1 year of college: 6,485
- Some college more than 1 year, no degree: 14,750
- Associate degree: 7,487
- Bachelor's degree: 20,218
- Master's degree: 9,088
- Professional school degree: 2,460
- Doctorate degree: 1,704
Housing units in structures:
- One, detached: 62,840
- One, attached: 6,204
- Two: 2,037
- 3 or 4: 9,216
- 5 to 9: 9,667
- 10 to 19: 9,278
- 20 to 49: 6,477
- 50 or more: 12,925
- Mobile homes: 4,345
- Boats, RVs, vans, etc.: 391
Median worth of mobile homes: $58,200
Housing units lacking complete kitchen facilities in 2022: 2.4%
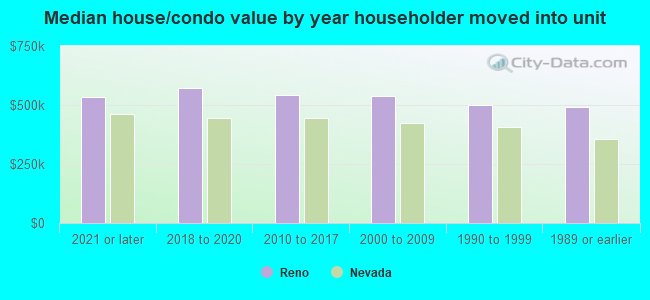
House/condo owner moved in on average 8 years ago
Renter moved in on average 2 years ago
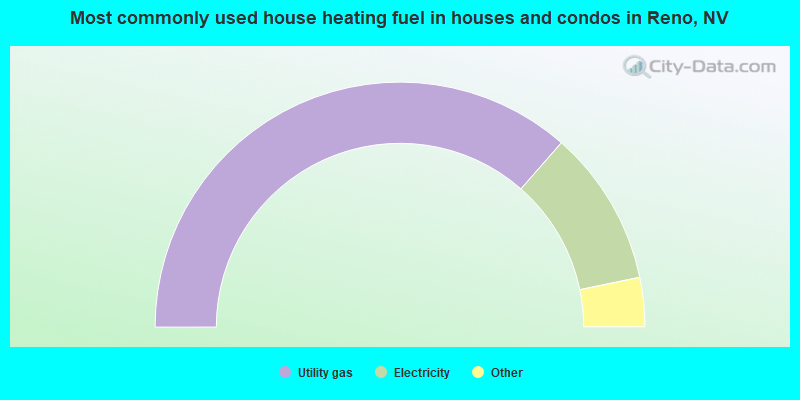
- 72.9%Utility gas
- 20.6%Electricity
- 2.4%Fuel oil, kerosene, etc.
- 1.7%Bottled, tank, or LP gas
- 1.5%Wood
- 0.4%Other fuel
- 0.3%Solar energy
- 0.1%No fuel used
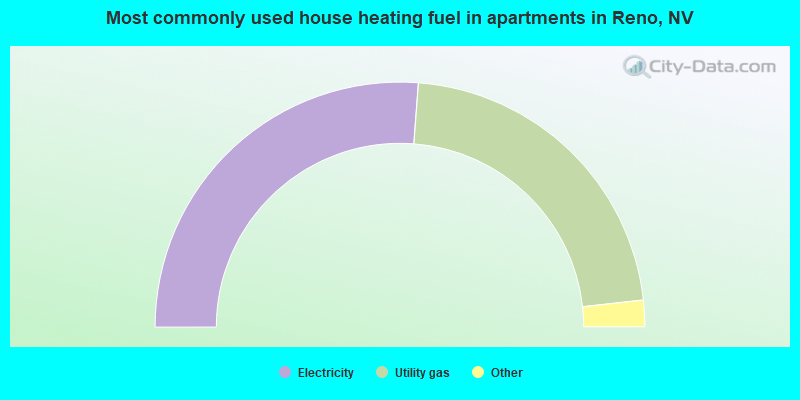
- 52.4%Electricity
- 44.1%Utility gas
- 2.1%Bottled, tank, or LP gas
- 0.8%No fuel used
- 0.3%Other fuel
- 0.2%Fuel oil, kerosene, etc.
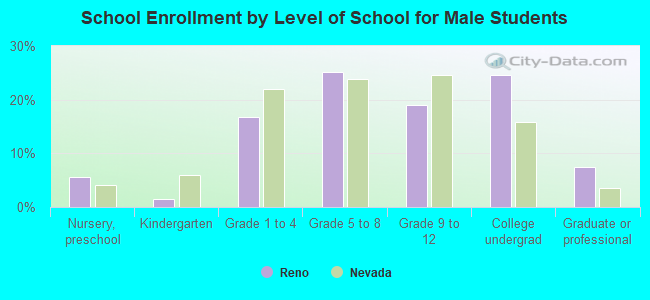
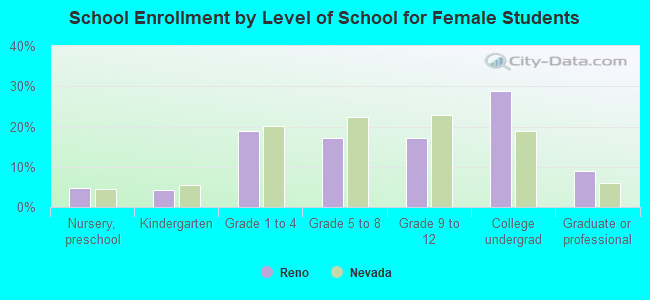
Private vs. public school enrollment:
| Here: | 11.1% |
| Nevada: | 12.9% |
| Here: | 6.8% |
| Nevada: | 6.9% |
| Here: | 5.8% |
| Nevada: | 16.0% |