Rensselaer, NY (New York) Houses and Residents
| Rensselaer: | $224,972 |
| New York: | $400,400 |
Mean price in 2022:
Detached houses: $198,946
Here: $198,946 State: $476,719 Townhouses or other attached units: $231,668
Here: $231,668 State: $699,270 In 2-unit structures: $199,662
Here: $199,662 State: $713,077 In 3-to-4-unit structures: $389,237
Here: $389,237 State: $764,568 In 5-or-more-unit structures: $219,863
Here: $219,863 State: $912,009
Total population: 9,471 (Urban population: 7,786, Rural population: 0)
Houses: 4,965 (4,364 occupied: 1,846 owner occupied, 2,507 renter occupied)
| % of renters here: | 58% |
| State: | 46% |
Housing density: 1,650 houses/condos per square mile
Median price asked for vacant for-sale houses and condos in 2022 in this county: $148,286.
Median contract rent in 2022: $956 (lower quartile is $660, upper quartile is $1,495)
Median rent asked for vacant for-rent units in 2022: $959
Median gross rent in Rensselaer, NY in 2022: $1,148
Housing units in Rensselaer with a mortgage: 1,186 (65 second mortgage, 0 home equity loan, 72 both second mortgage and home equity loan)
Houses without a mortgage: 242
Median household income for houses/condos with a mortgage: $113,843
Median household income for apartments without a mortgage: $65,331
Median monthly housing costs: $1,132
Compare current foreclosures in Rensselaer, NY:
| Photo | Address | Area | Beds / Baths | Price | Details |
|---|---|---|---|---|---|

|
#1
2nd Ave
Rensselaer, NY 12144
|
1,648 sq. feet
|
1 baths 3 beds |
show details | |

|
#2
Broadway
Rensselaer, NY 12144
|
1,285 sq. feet
|
1 baths 3 beds |
show details | |

|
#3
Catskill Ave
Rensselaer, NY 12144
|
1,248 sq. feet
|
1 baths 2 beds |
show details | |

|
#4
Wisconsin Ave
Rensselaer, NY 12144
|
1,432 sq. feet
|
3 baths 5 beds |
show details | |

|
#5
Mann Ave
Rensselaer, NY 12144
|
1,876 sq. feet
|
1 baths 3 beds |
show details | |

|
#6
Adams Ave
Rensselaer, NY 12144
|
1,228 sq. feet
|
1 baths 3 beds |
show details | |

|
#7
3rd Ave
Rensselaer, NY 12144
|
2,120 sq. feet
|
2 baths 4 beds |
show details | |

|
#8
Catskill Ave
Rensselaer, NY 12144
|
1,008 sq. feet
|
1 baths 2 beds |
show details | |

|
#9
Pinehurst Ave # 2
Rensselaer, NY 12144
|
1,944 sq. feet
|
2 baths 4 beds |
show details | |

|
#10
Cambridge Ave
Rensselaer, NY 12144
|
1,218 sq. feet
|
1 baths 3 beds |
show details |
| Photo | Address | Area | Beds / Baths | Price | Details |
|---|---|---|---|---|---|

|
#11
Orchard Ave
Rensselaer, NY 12144
|
1,250 sq. feet
|
1 baths 2 beds |
show details | |

|
#12
Rose Ln
Rensselaer, NY 12144
|
2,164 sq. feet
|
2 baths 4 beds |
show details | |

|
#13
Broadway
Rensselaer, NY 12144
|
2,000 sq. feet
|
2 baths 2 beds |
show details | |

|
#14
Spring Ave
Rensselaer, NY 12144
|
607 sq. feet
|
1 baths 2 beds |
show details | |

|
#15
3rd St
Rensselaer, NY 12144
|
1,688 sq. feet
|
2 baths 3 beds |
show details | |

|
#16
Delaware Ave
Rensselaer, NY 12144
|
1,568 sq. feet
|
1 baths 2 beds |
show details | |

|
#17
Brackwyck Dr
Rensselaer, NY 12144
|
1,232 sq. feet
|
1 baths 3 beds |
show details | |

|
#18
Falcon Chase
Rensselaer, NY 12144
|
1,566 sq. feet
|
2 baths 3 beds |
show details | |

|
#19
Valley View Blvd Apt 1324
Rensselaer, NY 12144
|
- sq. feet
|
- baths - beds |
show details | |

|
#20
Fox Holw
Rensselaer, NY 12144
|
- sq. feet
|
- baths - beds |
show details |
| Photo | Address | Area | Beds / Baths | Price | Details |
|---|---|---|---|---|---|

|
#21
Broadway
Rensselaer, NY 12144
|
- sq. feet
|
- baths - beds |
show details | |

|
#22
Fox Holw
Rensselaer, NY 12144
|
- sq. feet
|
- baths - beds |
show details | |

|
#23
Catskill Ave # 11
Rensselaer, NY 12144
|
- sq. feet
|
- baths - beds |
show details | |

|
#24
Broadway
Rensselaer, NY 12144
|
- sq. feet
|
- baths - beds |
show details | |

|
#25
River Rd
Rensselaer, NY 12144
|
- sq. feet
|
- baths - beds |
show details | |

|
#26
1st St
Rensselaer, NY 12144
|
- sq. feet
|
- baths - beds |
show details | |

|
#27
Sherwood Ave # 1
Rensselaer, NY 12144
|
- sq. feet
|
- baths - beds |
show details | |

|
#28
Fox Holw # J
Rensselaer, NY 12144
|
- sq. feet
|
- baths - beds |
show details | |

|
#29
Ridge Rd
Rensselaer, NY 12144
|
- sq. feet
|
- baths - beds |
show details | |

|
#30
Van Dyke Dr S
Rensselaer, NY 12144
|
- sq. feet
|
- baths - beds |
show details |
| Photo | Address | Area | Beds / Baths | Price | Details |
|---|---|---|---|---|---|

|
#31
2nd Ave
Rensselaer, NY 12144
|
- sq. feet
|
- baths - beds |
show details | |

|
Check over 1 million property listings on Foreclosure.com!
|
browse all offers | |||

Latest news about housing in Rensselaer, NY collected exclusively by city-data.com from local newspapers, TV, and radio stations

 | Waterfront apartments open in Rensselaer, with views of the Albany skyline (2 replies) |
| Inno has arrived in Albany. Here's what to expect... (104 replies) |
| looking for a rental for a young professional in Albany (1 reply) |
| Neighborhood revitalization/gentrification (187 replies) |
| Why don't Homes in upscale areas sell? (34 replies) |
| Neighborhoods in Rensselaer/Troy area (2 replies) |

Median year apartment built: 1983
Household type by relationship:
Households: 9,189- Male householders: 2,066 (882 living alone), Female householders: 2,247 (927 living alone)
1,327 spouses (1,327 opposite-sex spouses), 482 unmarried partners, (482 opposite-sex unmarried partners), 2,268 children (2,137 natural, 31 adopted, 99 stepchildren), 158 grandchildren, 88 brothers or sisters, 141 parents, 13 foster children, 103 other relatives, 260 non-relatives
- In group quarters: 29
Size of family households: 945 2-persons, 445 3-persons, 386 4-persons, 107 5-persons, 59 6-persons.
Size of nonfamily households: 1,932 1-person, 495 2-persons, 52 3-persons.
1,008 married couples with children.
661 single-parent households (341 men, 320 women).
88.0% of residents of Rensselaer speak English at home.
2.6% of residents speak Spanish at home (67% speak English very well, 22% speak English well, 11% speak English not well).
2.2% of residents speak other Indo-European language at home (95% speak English very well, 5% speak English not well).
5.6% of residents speak Asian or Pacific Island language at home (39% speak English very well, 28% speak English well, 28% speak English not well, 5% don't speak English at all).
1.4% of residents speak other language at home (75% speak English very well, 11% speak English well, 14% don't speak English at all).
Foreign born population: 706 (7.7%)
(76.5% of them are naturalized citizens)
| Here: | 5.9 |
| State: | 6.3 |
| Here: | 4.1 |
| State: | 3.8 |

- Bedrooms in owner-occupied houses and condos in Rensselaer, New York
- 13no bedroom
- 671 bedroom
- 5382 bedrooms
- 8333 bedrooms
- 1704 bedrooms
- 2255+ bedrooms

- Bedrooms in renter-occupied apartments in Rensselaer, New York
- 44no bedroom
- 7781 bedroom
- 1,0882 bedrooms
- 4833 bedrooms
- 1144 bedrooms
- 05+ bedrooms

- Cars and other vehicles available in Rensselaer in owner-occupied houses/condos
- 120no vehicle
- 6461 vehicle
- 8442 vehicles
- 1143 vehicles
- 1214 vehicles
- 05+ vehicles

- Cars and other vehicles available in Rensselaer in renter-occupied apartments
- 586no vehicle
- 1,2261 vehicle
- 5192 vehicles
- 1193 vehicles
- 574 vehicles
- 05+ vehicles

- Rooms in owner-occupied houses in Rensselaer, New York
- 131 room
- 02 rooms
- 503 rooms
- 1904 rooms
- 3665 rooms
- 5366 rooms
- 2357 rooms
- 778 rooms
- 3799+ rooms

- Rooms in renter-occupied apartments in Rensselaer, New York
- 441 room
- 1702 rooms
- 5193 rooms
- 7714 rooms
- 4685 rooms
- 2536 rooms
- 1527 rooms
- 458 rooms
- 859+ rooms


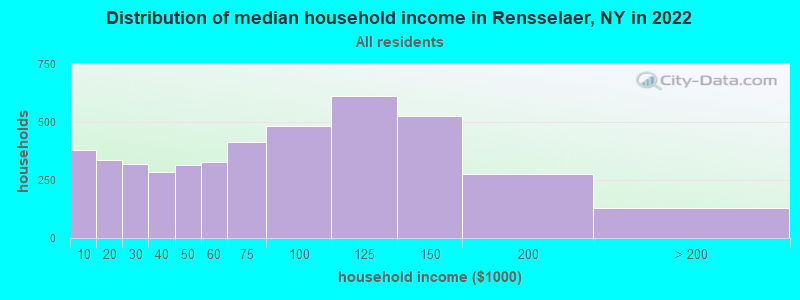
Rensselaer, NY household income distribution

- 378Less than $10,000
- 336$10,000 to $19,999
- 321$20,000 to $29,999
- 283$30,000 to $39,999
- 313$40,000 to $49,999
- 328$50,000 to $59,999
- 415$60,000 to $74,999
- 484$75,000 to $99,999
- 614$100,000 to $124,999
- 525$125,000 to $149,999
- 278$150,000 to $199,999
- 131$200,000 or more
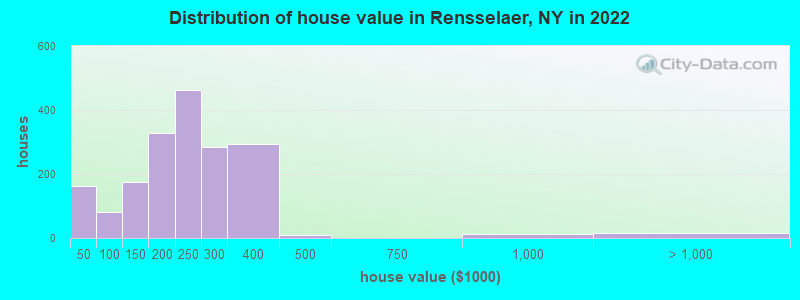
Home value of owner - occupied houses in 2022 in Rensselaer, NY
-
- 120Less than $10,000
- 17$20,000 to $24,999
- 25$25,000 to $29,999
- 20$50,000 to $59,999
- 18$60,000 to $69,999
- 26$70,000 to $79,999
- 6$80,000 to $89,999
- 9$90,000 to $99,999
- 52$100,000 to $124,999
- 121$125,000 to $149,999
- 215$150,000 to $174,999
- 112$175,000 to $199,999
- 463$200,000 to $249,999
- 284$250,000 to $299,999
- 292$300,000 to $399,999
- 8$400,000 to $499,999
- 11$750,000 to $999,999
- 14$1,000,000 to $1,499,999
Rent paid by renters in 2022 in Rensselaer, NY
-
- 51$100 to $149
- 369$150 to $199
- 42$200 to $249
- 50$250 to $299
- 6$300 to $349
- 8$400 to $449
- 51$500 to $549
- 55$550 to $599
- 95$600 to $649
- 26$650 to $699
- 122$750 to $799
- 271$800 to $899
- 150$900 to $999
- 313$1,000 to $1,249
- 240$1,250 to $1,499
- 691$1,500 to $1,999
- 5$2,000 to $2,499
- 12$2,500 to $2,999
- 82No cash rent


Percentage of workers working in this county: 53.1%
Number of people working at home: 605 (12.4% of all workers)
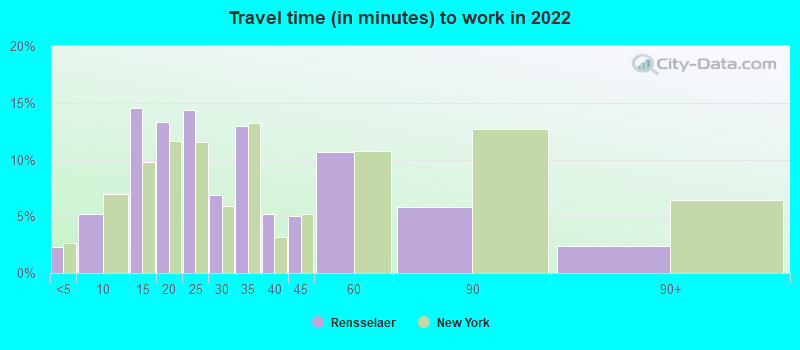
Travel time to work (commute)
- Less than 5 minutes: 256
- 5 to 9 minutes: 485
- 10 to 14 minutes: 739
- 15 to 19 minutes: 680
- 20 to 24 minutes: 785
- 25 to 29 minutes: 107
- 30 to 34 minutes: 545
- 35 to 39 minutes: 131
- 40 to 44 minutes: 133
- 45 to 59 minutes: 90
- 60 to 89 minutes: 115
- 90 or more minutes: 114
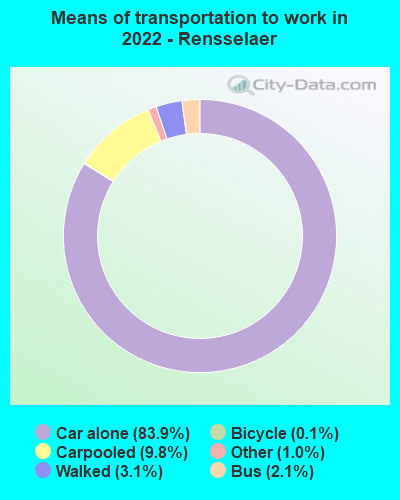
Means of transportation to work:
- Drove a car alone: 3,378 (73.6%)
- Carpooled: 419 (9.1%)
- Bus: 87 (1.9%)
- Taxi: 47 (1.0%)
- Bicycle: 6 (0.1%)
- Walked: 125 (2.7%)
- Worked at home: 566 (12.3%)

- Unemployment by race in 2022
- Unemployment rate for White non-Hispanic residents
- 2.6%Males
- 3.2%Females

- Year of entry for the foreign-born population in Rensselaer, New York
- 3592010 or later
- 1362000 to 2009
- 621990 to 1999
- 461980 to 1989
- 451970 to 1979
- 114Before 1970
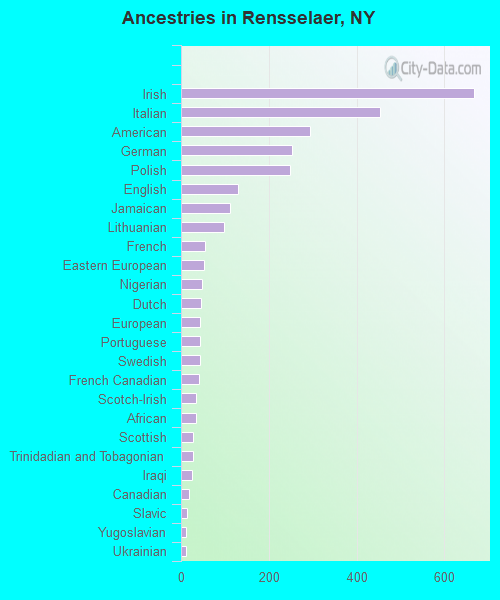
First ancestries reported:
- Irish: 668 (16.9%)
- Italian: 453 (11.5%)
- American: 294 (7.4%)
- German: 252 (6.4%)
- Polish: 248 (6.3%)
- English: 130 (3.3%)
- Jamaican: 112 (2.8%)
- Lithuanian: 99 (2.5%)
- French: 54 (1.4%)
- Eastern European: 53 (1.3%)
- Nigerian: 48 (1.2%)
- Dutch: 46 (1.2%)
- European: 44 (1.1%)
- Portuguese: 43 (1.1%)
- Swedish: 43 (1.1%)
- French Canadian: 40 (1.0%)
- Scotch-Irish: 35 (0.9%)
- African: 34 (0.9%)
- Scottish: 27 (0.7%)
- Trinidadian and Tobagonian: 27 (0.7%)
- Iraqi: 25 (0.6%)
- Canadian: 19 (0.5%)
- Slavic: 13 (0.3%)
- Yugoslavian: 12 (0.3%)
- Ukrainian: 11 (0.3%)
- Egyptian: 8 (0.2%)
- Russian: 8 (0.2%)
Most common places of birth for foreign-born residents (%):
| Rensselaer: | 31.0% (221) |
| New York: | 0.4% (16,179) |
| Rensselaer: | 13.4% (96) |
| New York: | 0.3% (14,037) |
| Rensselaer: | 7.0% (50) |
| New York: | 0.7% (33,746) |
| Rensselaer: | 5.9% (42) |
| New York: | 9.1% (410,910) |
| Rensselaer: | 5.7% (41) |
| New York: | 0.8% (33,869) |
| Rensselaer: | 4.9% (35) |
| New York: | 0.6% (25,517) |
| Rensselaer: | 3.6% (26) |
| New York: | 5.0% (227,557) |
| Rensselaer: | 3.6% (26) |
| New York: | 2.0% (91,428) |
| Rensselaer: | 3.6% (26) |
| New York: | 1.3% (59,107) |
| Rensselaer: | 3.5% (25) |
| New York: | 0.2% (8,010) |
| Rensselaer: | 3.4% (24) |
| New York: | 1.7% (78,421) |
| Rensselaer: | 3.4% (24) |
| New York: | 1.8% (81,374) |
| Rensselaer: | 3.1% (22) |
| New York: | 0.1% (6,152) |
| Rensselaer: | 2.4% (17) |
| New York: | 0.4% (19,133) |
| Rensselaer: | 1.8% (13) |
| New York: | 3.8% (172,129) |
Place of birth for U.S.-born residents:
- This state: 7,379
- Other state: 888
- Northeast: 315
- Midwest: 102
- South: 291
- West: 179
85.5% of Rensselaer residents lived in the same house 1 years ago.
Out of people who lived in different houses, 39.8% lived in this county.
Out of people who lived in different counties, 96.0% lived in New York.
| Rensselaer: | 85.5% |
| State average: | 89.6% |
Education attainment for males 25 years and older:
- No schooling: 126
- Nursery to 4th grade: 27
- 5th and 6th grade: 68
- 7th and 8th grade: 0
- 9th grade: 5
- 10th grade: 44
- 11th grade: 52
- 12th grade, no diploma: 28
- High school graduate (or equivalency): 959
- Less than 1 year of college: 224
- Some college more than 1 year, no degree: 489
- Associate degree: 446
- Bachelor's degree: 768
- Master's degree: 133
- Professional school degree: 93
- Doctorate degree: 5

Education attainment for females 25 years and older:
- No schooling: 314
- Nursery to 4th grade: 0
- 5th and 6th grade: 0
- 7th and 8th grade: 41
- 9th grade: 7
- 10th grade: 211
- 11th grade: 39
- 12th grade, no diploma: 14
- High school graduate (or equivalency): 858
- Less than 1 year of college: 151
- Some college more than 1 year, no degree: 523
- Associate degree: 434
- Bachelor's degree: 711
- Master's degree: 294
- Professional school degree: 7
- Doctorate degree: 47


Housing units in structures:
- One, detached: 1,466
- One, attached: 450
- Two: 795
- 3 or 4: 1,030
- 5 to 9: 344
- 10 to 19: 310
- 20 to 49: 139
- 50 or more: 389
- Mobile homes: 38
House/condo owner moved in on average 18 years ago
Renter moved in on average 1 years ago

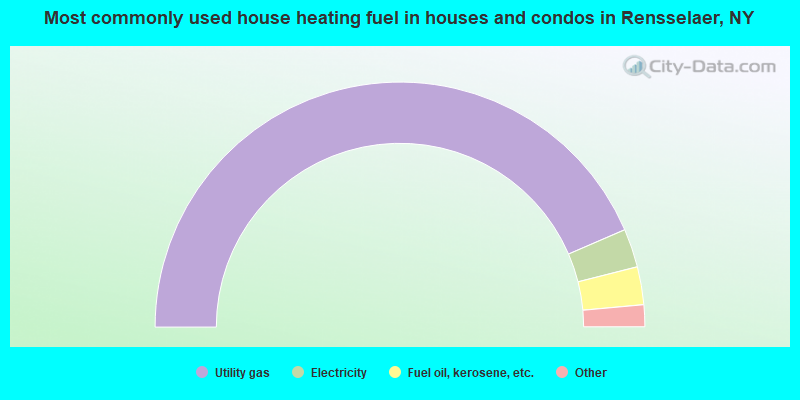
- 87.1%Utility gas
- 5.1%Electricity
- 5.0%Fuel oil, kerosene, etc.
- 1.4%Bottled, tank, or LP gas
- 0.8%Solar energy
- 0.7%No fuel used
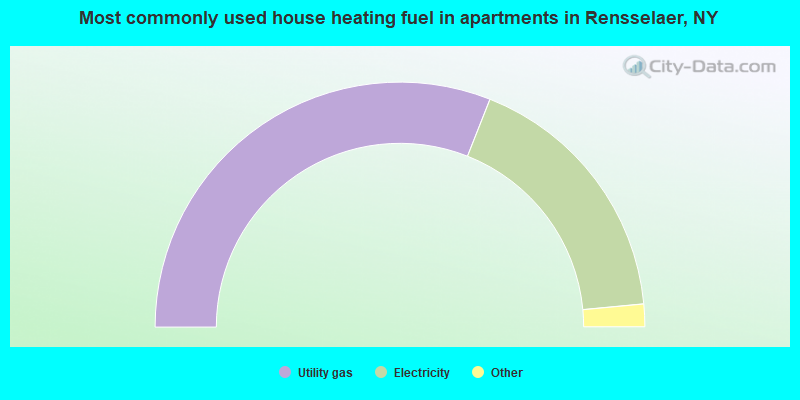
- 62.0%Utility gas
- 35.0%Electricity
- 1.7%No fuel used
- 0.8%Bottled, tank, or LP gas
- 0.5%Fuel oil, kerosene, etc.
Private vs. public school enrollment:
| Here: | 10.1% |
| New York: | 15.6% |
| Here: | 0.0% |
| New York: | 15.0% |
| Here: | 20.9% |
| New York: | 39.2% |


