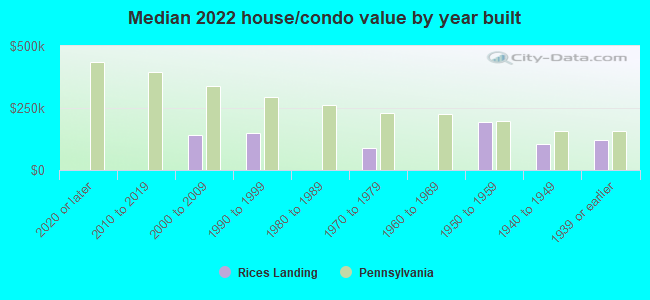
Rices Landing, PA (Pennsylvania) Houses and Residents
| Rices Landing: | $135,665 |
| Pennsylvania: | $245,500 |
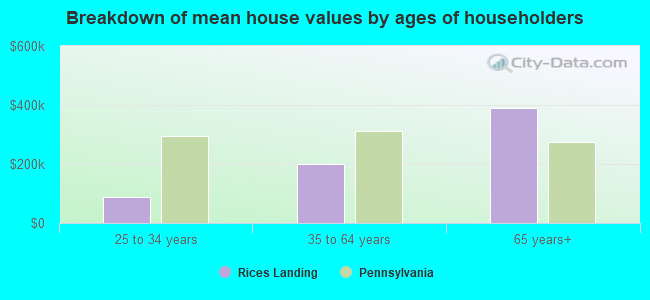
Mean price in 2022:
Detached houses: $142,196
Here: $142,196 State: $317,202 Mobile homes: $140,987
Here: $140,987 State: $92,414
Total population: 449 (Urban population: 0, Rural population: 440 (all nonfarm))
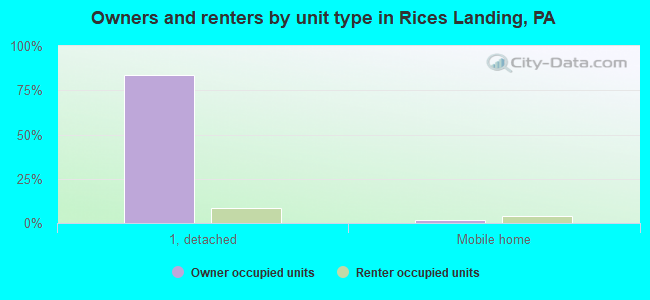
Houses: 236 (192 occupied: 177 owner occupied, 16 renter occupied)
| % of renters here: | 8% |
| State: | 31% |
Housing density: 306 houses/condos per square mile
Median price asked for vacant for-sale houses and condos in 2022 in this county: $92,466.
Median contract rent in 2022: $554 (lower quartile is $505, upper quartile is $731)
Median rent asked for vacant for-rent units in 2022: $332
Median gross rent in Rices Landing, PA in 2022: $904
Housing units in Rices Landing with a mortgage: 110 (6 second mortgage, 0 home equity loan, 0 both second mortgage and home equity loan)
Houses without a mortgage: 8
Median household income for houses/condos with a mortgage: $108,089
Median household income for apartments without a mortgage: $114,315
Median monthly housing costs: $878
Compare current foreclosures near Rices Landing, PA:
| Photo | Address | Area | Beds / Baths | Price | Details |
|---|---|---|---|---|---|

|
#1
Jacobs Ferry Rd
Rices Landing, PA 15357
|
- sq. feet
|
2 baths 3 beds |
show details | |

|
#2
Maple St
Rices Landing, PA 15357
|
- sq. feet
|
- baths - beds |
show details | |

|
#3
Carmichaels St
Rices Landing, PA 15357
|
- sq. feet
|
- baths - beds |
show details | |

|
#4
Coal St
Dunlevy, PA 15432
|
1,740 sq. feet
|
1 baths 3 beds |
$119,500
|
show details |

|
#5
Casey Drive
New Salem, PA 15468
|
- sq. feet
|
1 baths 1 beds |
$244,900
|
show details |

|
#6
Main St
Uniontown, PA 15401
|
1,137 sq. feet
|
1 baths 3 beds |
$25,000
|
show details |

|
#7
Stevenson St
Ronco, PA 15476
|
- sq. feet
|
2 baths 4 beds |
$16,500
|
show details |

|
#8
Hillcrest Dr
California, PA 15419
|
1,677 sq. feet
|
1 baths 3 beds |
show details | |

|
#9
Hutchinson St
Uniontown, PA 15401
|
1,928 sq. feet
|
2 baths 4 beds |
show details | |

|
#10
Blind Ln
Belle Vernon, PA 15012
|
1,218 sq. feet
|
1 baths 3 beds |
show details |
| Photo | Address | Area | Beds / Baths | Price | Details |
|---|---|---|---|---|---|

|
#11
Old Mcclellandtown Rd
Mc Clellandtown, PA 15458
|
- sq. feet
|
1 baths 3 beds |
show details | |

|
#12
Low Hill Rd
Brownsville, PA 15417
|
1,239 sq. feet
|
1 baths 3 beds |
show details | |

|
#13
Wall St
Republic, PA 15475
|
868 sq. feet
|
1 baths 2 beds |
show details | |

|
#14
Grant Ave
Monessen, PA 15062
|
1,159 sq. feet
|
1 baths 2 beds |
show details | |

|
#15
Scott St
Charleroi, PA 15022
|
1,045 sq. feet
|
1 baths 2 beds |
show details | |

|
#16
Brothers Rd
Charleroi, PA 15022
|
- sq. feet
|
- baths - beds |
$29,900
|
show details |

|
#17
N Eighty Eight Rd
Clarksville, PA 15322
|
1,691 sq. feet
|
1 baths 4 beds |
show details | |

|
#18
1st St
Uniontown, PA 15401
|
1,850 sq. feet
|
2 baths 4 beds |
show details | |

|
#19
Spaulding St
Uniontown, PA 15401
|
- sq. feet
|
2 baths 2 beds |
show details | |

|
#20
Morgantown Rd
Smithfield, PA 15478
|
1,552 sq. feet
|
2 baths 3 beds |
show details |
| Photo | Address | Area | Beds / Baths | Price | Details |
|---|---|---|---|---|---|

|
#21
Bethlehem Street
Fredericktown, PA 15333
|
- sq. feet
|
2 baths 3 beds |
show details | |

|
#22
3rd Street
Isabella, PA 15447
|
854 sq. feet
|
1 baths 2 beds |
show details | |

|
#23
Woodstock Ave
Hopwood, PA 15445
|
- sq. feet
|
2 baths 4 beds |
show details | |

|
#24
State St
Charleroi, PA 15022
|
1,976 sq. feet
|
2 baths 3 beds |
show details | |

|
#25
Pine Knob Rd
Hopwood, PA 15445
|
1,565 sq. feet
|
1 baths 3 beds |
show details | |

|
#26
Corwin St
Roscoe, PA 15477
|
- sq. feet
|
- baths - beds |
$34,900
|
show details |

|
#27
Newton Ave
Fredericktown, PA 15333
|
1,739 sq. feet
|
2 baths 3 beds |
show details | |

|
#28
Lafayette St
Uniontown, PA 15401
|
1,270 sq. feet
|
2 baths 2 beds |
show details | |

|
#29
Oakland Ave
Uniontown, PA 15401
|
2,764 sq. feet
|
2 baths 4 beds |
show details | |

|
#30
Grandview Way
Charleroi, PA 15022
|
1,560 sq. feet
|
1 baths 3 beds |
show details |
| Photo | Address | Area | Beds / Baths | Price | Details |
|---|---|---|---|---|---|

|
#31
Humbert Ln
Uniontown, PA 15401
|
2,212 sq. feet
|
1 baths 3 beds |
show details | |

|
#32
Center St
Fayette City, PA 15438
|
1,953 sq. feet
|
1 baths 3 beds |
show details | |

|
#33
National Pike
Uniontown, PA 15401
|
1,550 sq. feet
|
3 baths 4 beds |
show details | |

|
#34
Carnation St
Uniontown, PA 15401
|
993 sq. feet
|
1 baths 2 beds |
show details | |

|
#35
Phillips St
Charleroi, PA 15022
|
1,632 sq. feet
|
1 baths 3 beds |
show details | |

|
#36
Main St
Bentleyville, PA 15314
|
1,608 sq. feet
|
1 baths 2 beds |
show details | |

|
#37
Cross Ridge Rd
Coal Center, PA 15423
|
1,032 sq. feet
|
1 baths 2 beds |
show details | |

|
#38
Twin Bridges Rd
Charleroi, PA 15022
|
1,188 sq. feet
|
1 baths 3 beds |
show details | |

|
#39
Haddenville Rd
Uniontown, PA 15401
|
1,742 sq. feet
|
2 baths 3 beds |
show details | |

|
#40
Scott St
Charleroi, PA 15022
|
924 sq. feet
|
1 baths 2 beds |
show details |
| Photo | Address | Area | Beds / Baths | Price | Details |
|---|---|---|---|---|---|

|
#41
Farm Rd
Uniontown, PA 15401
|
1,344 sq. feet
|
2 baths 3 beds |
show details | |

|
#42
Dixon Blvd
Uniontown, PA 15401
|
868 sq. feet
|
1 baths 2 beds |
show details | |

|
#43
Spring St
Bentleyville, PA 15314
|
1,172 sq. feet
|
1 baths 2 beds |
show details | |

|
#44
Washington Dr
Fayette City, PA 15438
|
1,164 sq. feet
|
1 baths 3 beds |
show details | |

|
#45
Woodlawn Ave
Uniontown, PA 15401
|
996 sq. feet
|
1 baths 2 beds |
show details | |

|
#46
State St
Charleroi, PA 15022
|
1,924 sq. feet
|
2 baths 3 beds |
show details | |

|
#47
Colvin Rd
Charleroi, PA 15022
|
1,120 sq. feet
|
1 baths 2 beds |
show details | |

|
#48
Moninger Rd
Washington, PA 15301
|
980 sq. feet
|
1 baths 2 beds |
show details | |

|
#49
Industry Ln
Uniontown, PA 15401
|
5,840 sq. feet
|
1 baths 3 beds |
show details | |

|
Check over 1 million property listings on Foreclosure.com!
|
browse all offers | |||


 | Greene County (Rices Landing, Jefferson) (1 reply) |

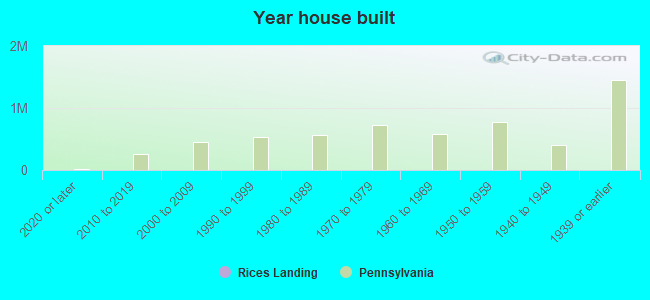
Median year apartment built: 1940
Household type by relationship:
Households: 482- Male householders: 72 (13 living alone), Female householders: 116 (14 living alone)
109 spouses (109 opposite-sex spouses), 15 unmarried partners, (13 opposite-sex unmarried partners), 133 children (127 natural, 0 adopted, 5 stepchildren), 13 grandchildren, 6 brothers or sisters, 8 parents, 0 foster children, 1 other relatives, 0 non-relatives
Size of family households: 55 2-persons, 16 3-persons, 56 4-persons, 14 5-persons, 1 6-persons, 1 7-or-more-persons.
Size of nonfamily households: 29 1-person, 16 2-persons.
95 married couples with children.
2 single-parent households (0 men, 2 women).
97.7% of residents of Rices Landing speak English at home.
0.2% of residents speak Spanish at home (100% speak English very well).
0.7% of residents speak other language at home (100% speak English very well).
| Here: | 7.5 |
| State: | 6.8 |
| Here: | 5.8 |
| State: | 4.3 |
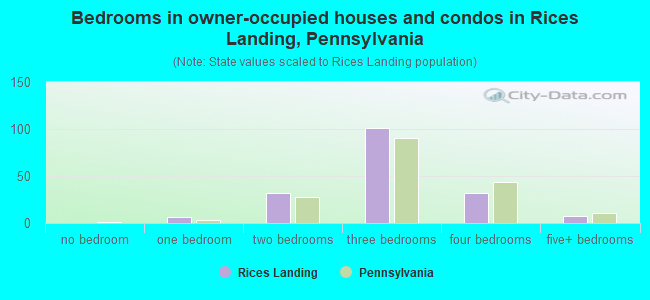
- Bedrooms in owner-occupied houses and condos in Rices Landing, Pennsylvania
- 0no bedroom
- 61 bedroom
- 322 bedrooms
- 1013 bedrooms
- 324 bedrooms
- 75+ bedrooms
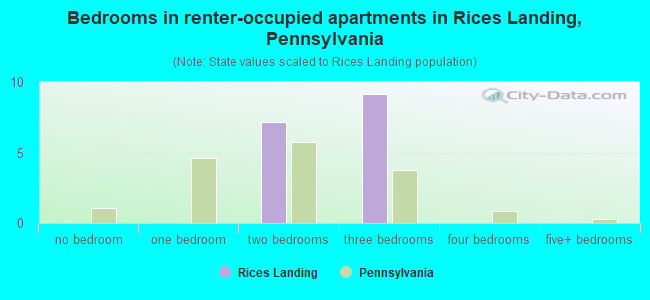
- Bedrooms in renter-occupied apartments in Rices Landing, Pennsylvania
- 0no bedroom
- 01 bedroom
- 72 bedrooms
- 93 bedrooms
- 04 bedrooms
- 05+ bedrooms
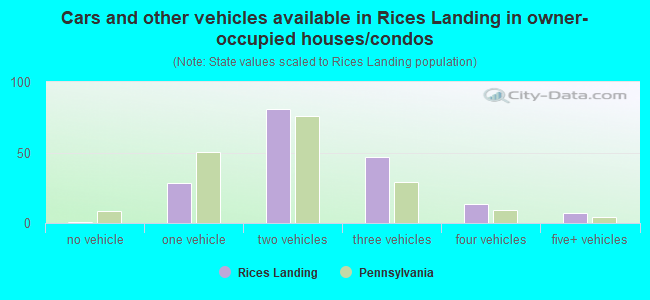
- Cars and other vehicles available in Rices Landing in owner-occupied houses/condos
- 1no vehicle
- 291 vehicle
- 812 vehicles
- 473 vehicles
- 134 vehicles
- 75+ vehicles
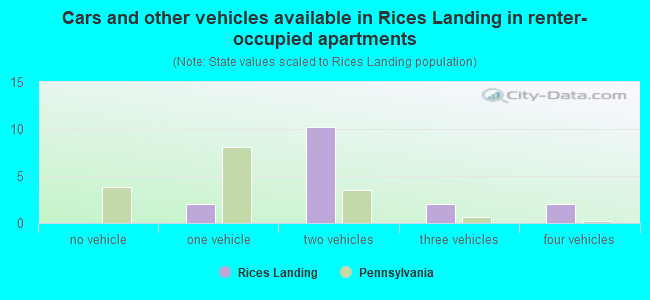
- Cars and other vehicles available in Rices Landing in renter-occupied apartments
- 0no vehicle
- 21 vehicle
- 102 vehicles
- 23 vehicles
- 24 vehicles
- 05+ vehicles
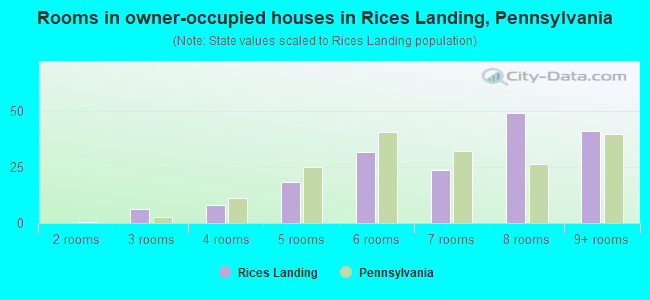
- Rooms in owner-occupied houses in Rices Landing, Pennsylvania
- 01 room
- 02 rooms
- 63 rooms
- 84 rooms
- 185 rooms
- 326 rooms
- 237 rooms
- 498 rooms
- 419+ rooms
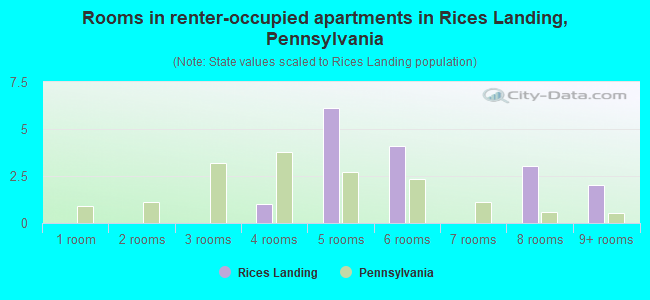
- Rooms in renter-occupied apartments in Rices Landing, Pennsylvania
- 01 room
- 02 rooms
- 03 rooms
- 14 rooms
- 65 rooms
- 46 rooms
- 07 rooms
- 38 rooms
- 29+ rooms
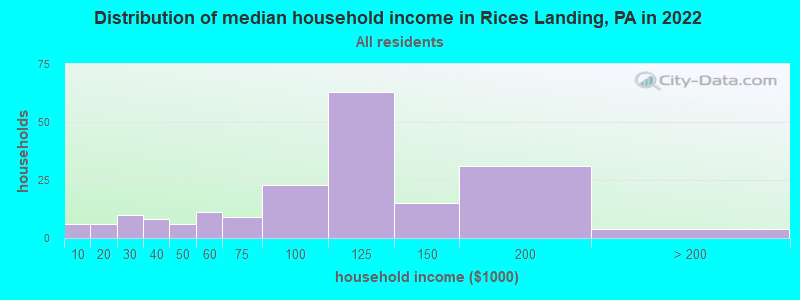
Rices Landing, PA household income distribution

- 6Less than $10,000
- 6$10,000 to $19,999
- 10$20,000 to $29,999
- 8$30,000 to $39,999
- 6$40,000 to $49,999
- 11$50,000 to $59,999
- 9$60,000 to $74,999
- 23$75,000 to $99,999
- 63$100,000 to $124,999
- 15$125,000 to $149,999
- 31$150,000 to $199,999
- 4$200,000 or more
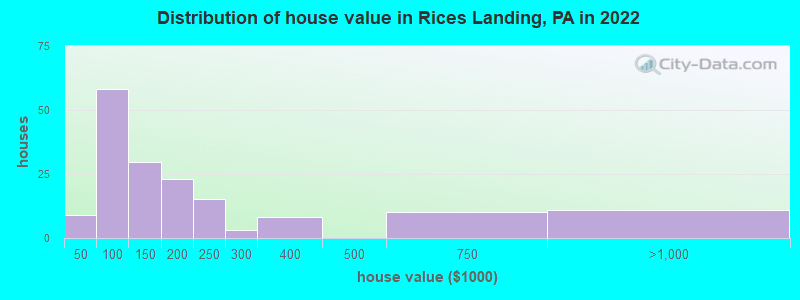
Home value of owner - occupied houses in 2022 in Rices Landing, PA
-
- 2$10,000 to $14,999
- 1$15,000 to $19,999
- 2$20,000 to $24,999
- 0$25,000 to $29,999
- 1$30,000 to $34,999
- 1$40,000 to $49,999
- 10$70,000 to $79,999
- 35$80,000 to $89,999
- 10$90,000 to $99,999
- 14$100,000 to $124,999
- 15$125,000 to $149,999
- 13$150,000 to $174,999
- 9$175,000 to $199,999
- 15$200,000 to $249,999
- 3$250,000 to $299,999
- 8$300,000 to $399,999
- 10$500,000 to $749,999
- 11$750,000 to $999,999
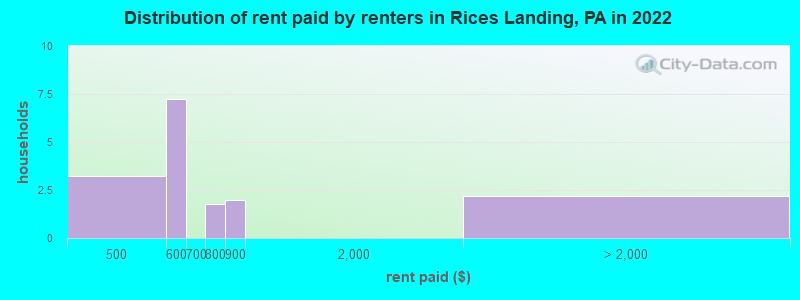
Rent paid by renters in 2022 in Rices Landing, PA
-
- 2$400 to $449
- 0$450 to $499
- 4$500 to $549
- 2$550 to $599
- 1$700 to $749
- 1$800 to $899
- 2No cash rent
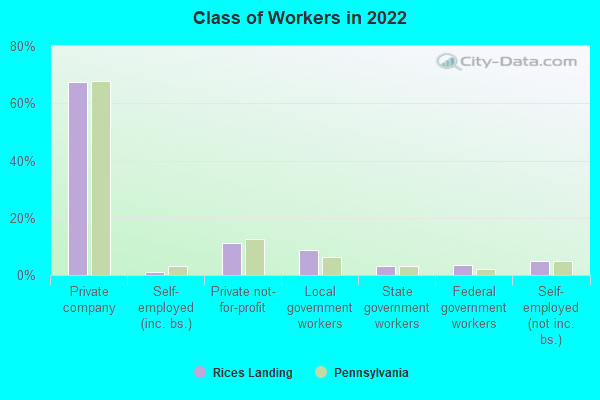
Percentage of workers working in this county: 69.3%
Number of people working at home: 20 (7.1% of all workers)
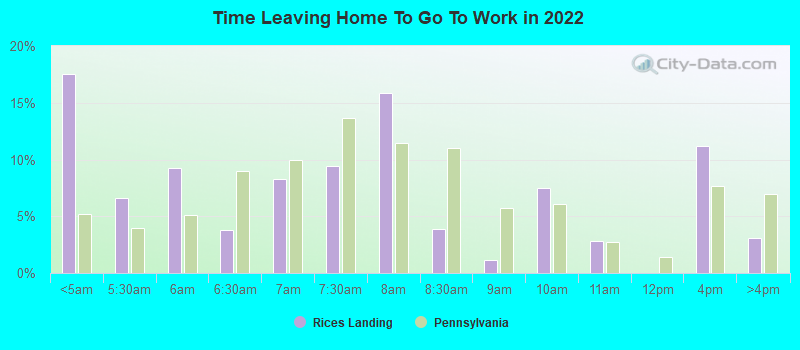
Travel time to work (commute)
- Less than 5 minutes: 10
- 5 to 9 minutes: 40
- 10 to 14 minutes: 23
- 15 to 19 minutes: 11
- 20 to 24 minutes: 47
- 25 to 29 minutes: 19
- 30 to 34 minutes: 13
- 35 to 39 minutes: 20
- 40 to 44 minutes: 4
- 45 to 59 minutes: 51
- 60 to 89 minutes: 8
- 90 or more minutes: 0
Means of transportation to work:
- Drove a car alone: 159 (85.0%)
- Carpooled: 19 (10.2%)
- Walked: 3 (1.6%)
- Other means: 2 (1.1%)
- Worked at home: 4 (2.1%)
- Unemployment by race in 2022
- Unemployment rate for White non-Hispanic residents
- 1.9%Males
- 2.0%Females
- Unemployment rate for two or more race residents
- 26.6%Males
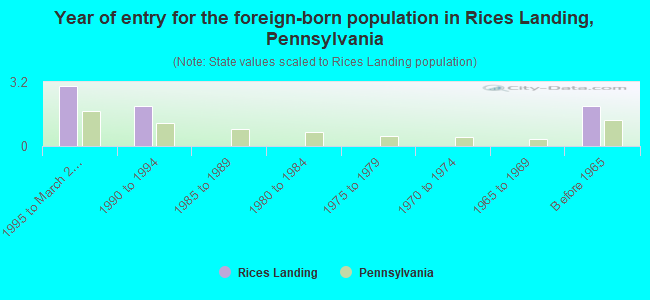
- Year of entry for the foreign-born population in Rices Landing, Pennsylvania
- 31995 to March 2000
- 21990 to 1994
- 01985 to 1989
- 01980 to 1984
- 01975 to 1979
- 01970 to 1974
- 01965 to 1969
- 2Before 1965
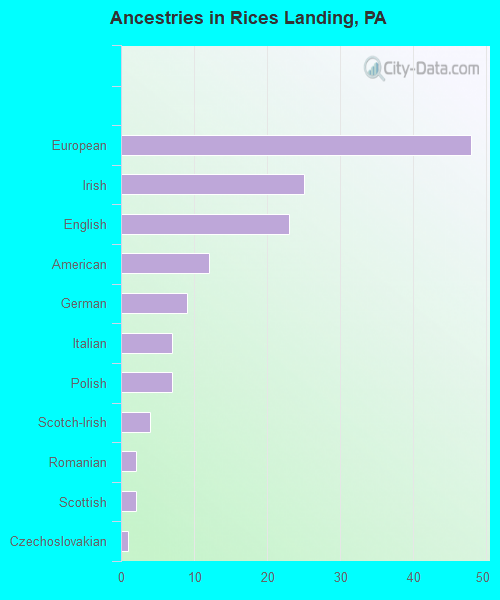
First ancestries reported:
- European: 48 (30.5%)
- Irish: 25 (15.9%)
- English: 23 (14.6%)
- American: 12 (7.6%)
- German: 9 (5.7%)
- Italian: 7 (4.4%)
- Polish: 7 (4.4%)
- Scotch-Irish: 4 (2.5%)
- Romanian: 2 (1.3%)
- Scottish: 2 (1.3%)
- Czechoslovakian: 1 (0.6%)
Most common places of birth for foreign-born residents (%):
| Rices Landing: | 57.1% (4) |
| Pennsylvania: | 7.4% (37,541) |
| Rices Landing: | 28.6% (2) |
| Pennsylvania: | 4.6% (23,171) |
Place of birth for U.S.-born residents:
- This state: 330
- Other state: 151
- Northeast: 10
- Midwest: 30
- South: 87
- West: 23
97.7% of Rices Landing residents lived in the same house 1 years ago.
Out of people who lived in different houses, 38.1% lived in this county.
Out of people who lived in different counties, 75.0% lived in Pennsylvania.
| Rices Landing: | 97.7% |
| State average: | 89.3% |
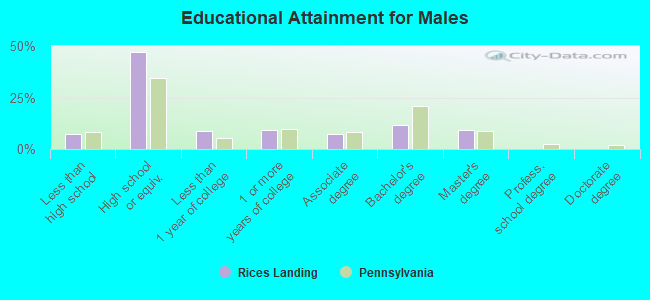
Education attainment for males 25 years and older:
- No schooling: 0
- Nursery to 4th grade: 0
- 5th and 6th grade: 0
- 7th and 8th grade: 0
- 9th grade: 0
- 10th grade: 0
- 11th grade: 1
- 12th grade, no diploma: 10
- High school graduate (or equivalency): 72
- Less than 1 year of college: 13
- Some college more than 1 year, no degree: 14
- Associate degree: 11
- Bachelor's degree: 18
- Master's degree: 14
- Professional school degree: 0
- Doctorate degree: 0
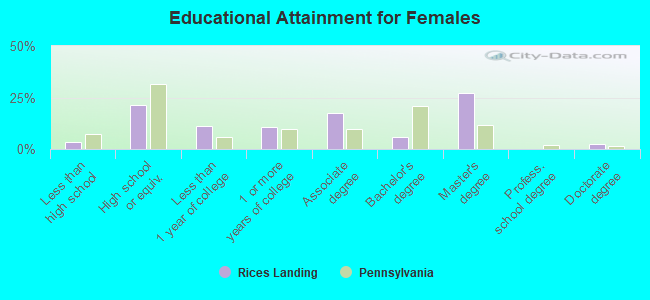
Education attainment for females 25 years and older:
- No schooling: 1
- Nursery to 4th grade: 0
- 5th and 6th grade: 0
- 7th and 8th grade: 0
- 9th grade: 0
- 10th grade: 5
- 11th grade: 0
- 12th grade, no diploma: 0
- High school graduate (or equivalency): 36
- Less than 1 year of college: 19
- Some college more than 1 year, no degree: 18
- Associate degree: 29
- Bachelor's degree: 10
- Master's degree: 46
- Professional school degree: 0
- Doctorate degree: 4


Housing units in structures:
- One, detached: 207
- Two: 4
- 3 or 4: 4
- Mobile homes: 21
Median worth of mobile homes: $152,709
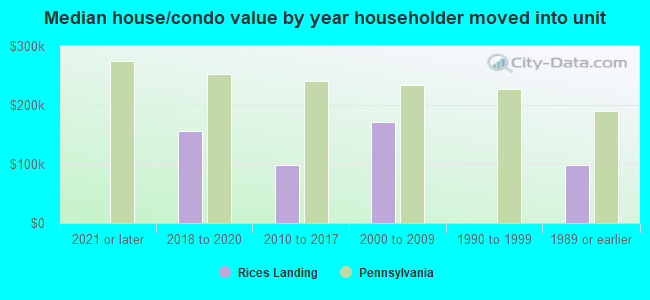
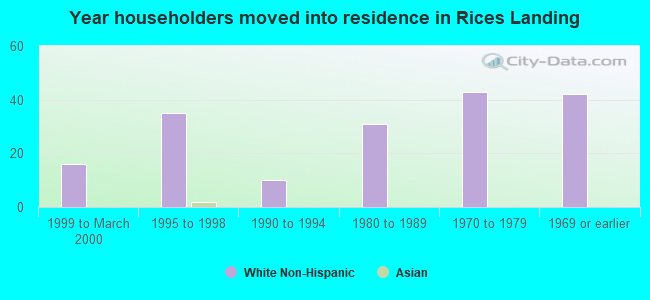
House/condo owner moved in on average 9 years ago
Renter moved in on average 5 years ago
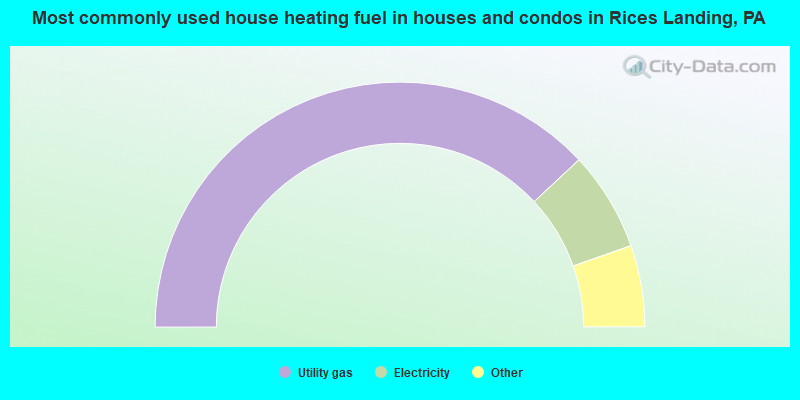
- 76.4%Utility gas
- 13.2%Electricity
- 3.4%Fuel oil, kerosene, etc.
- 3.4%No fuel used
- 2.3%Other fuel
- 1.1%Wood
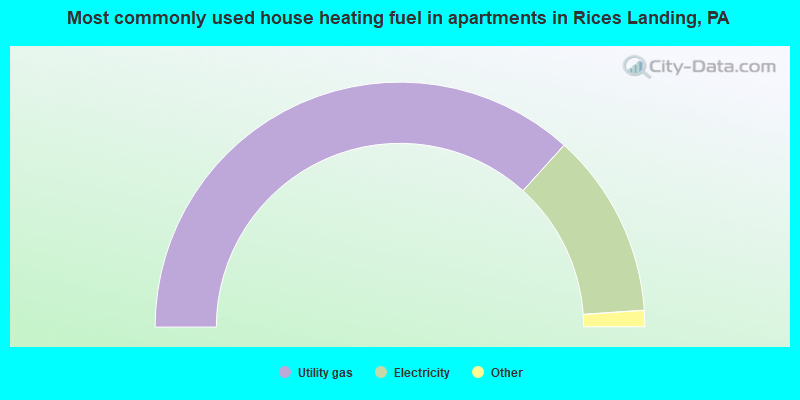
- 75.0%Utility gas
- 25.0%Electricity
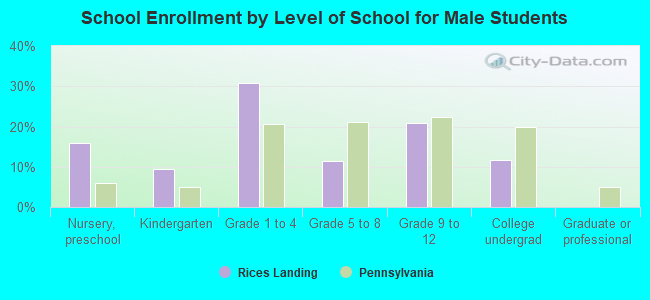
Private vs. public school enrollment:
| Here: | 0.0% |
| Pennsylvania: | 15.7% |
| Here: | 0.0% |
| Pennsylvania: | 13.4% |
| Here: | 35.7% |
| Pennsylvania: | 39.8% |