Richlands, NC (North Carolina) Houses and Residents
| Richlands: | $227,388 |
| North Carolina: | $280,600 |
Total population: 1,674 (Urban population: 0, Rural population: 940 (all nonfarm))
Houses: 910 (811 occupied: 546 owner occupied, 291 renter occupied)
| % of renters here: | 35% |
| State: | 33% |
Housing density: 766 houses/condos per square mile
Median price asked for vacant for-sale houses and condos in 2022: $112,509.
Median contract rent in 2022: $669 (lower quartile is $443, upper quartile is $1,034)
Median rent asked for vacant for-rent units in 2022: $1,907
Median gross rent in Richlands, NC in 2022: $889
Housing units in Richlands with a mortgage: 481 (13 second mortgage, 0 home equity loan, 10 both second mortgage and home equity loan)
Houses without a mortgage: 14
Median household income for houses/condos with a mortgage: $61,586
Median household income for apartments without a mortgage: $67,233
Median monthly housing costs: $1,090
Compare current foreclosures near Richlands, NC:
| Photo | Address | Area | Beds / Baths | Price | Details |
|---|---|---|---|---|---|

|
#1
Dillard Ln
Richlands, NC 28574
|
1,592 sq. feet
|
3 baths 4 beds |
show details | |

|
#2
Francktown Rd
Richlands, NC 28574
|
1,830 sq. feet
|
2 baths 3 beds |
show details | |

|
#3
Poults Dr
Richlands, NC 28574
|
- sq. feet
|
3 baths 3 beds |
show details | |

|
#4
New St
Richlands, NC 28574
|
832 sq. feet
|
1 baths 2 beds |
show details | |

|
#5
Angels Haven Ln
Richlands, NC 28574
|
2,417 sq. feet
|
3 baths 3 beds |
show details | |

|
#6
Busch Dr
Richlands, NC 28574
|
1,512 sq. feet
|
2 baths 3 beds |
show details | |

|
#7
New St
Richlands, NC 28574
|
2,088 sq. feet
|
2 baths 5 beds |
show details | |

|
#8
Pineview Rd
Richlands, NC 28574
|
1,620 sq. feet
|
2 baths 3 beds |
show details | |

|
#9
Cypress Knee Dr
Richlands, NC 28574
|
1,674 sq. feet
|
2 baths 3 beds |
show details | |

|
#10
Fowler Manning Rd
Richlands, NC 28574
|
1,753 sq. feet
|
2 baths 3 beds |
show details |
| Photo | Address | Area | Beds / Baths | Price | Details |
|---|---|---|---|---|---|

|
#11
Annie Rd
Richlands, NC 28574
|
1,168 sq. feet
|
2 baths 3 beds |
show details | |

|
#12
Harmony Way
Richlands, NC 28574
|
1,302 sq. feet
|
2 baths 3 beds |
show details | |

|
#13
Kinston Hwy
Richlands, NC 28574
|
1,657 sq. feet
|
1 baths 3 beds |
show details | |

|
#14
Bannermans Mill Rd
Richlands, NC 28574
|
1,681 sq. feet
|
1 baths 2 beds |
show details | |

|
#15
Nine Mile Rd
Richlands, NC 28574
|
2,044 sq. feet
|
1 baths 3 beds |
show details | |

|
#16
Five Mile Rd
Richlands, NC 28574
|
- sq. feet
|
- baths - beds |
show details | |

|
#17
Trophy Ridge Dr
Richlands, NC 28574
|
- sq. feet
|
- baths - beds |
show details | |

|
#18
Hinson Ln
Richlands, NC 28574
|
- sq. feet
|
- baths - beds |
show details | |

|
#19
Easton Dr
Richlands, NC 28574
|
- sq. feet
|
- baths - beds |
show details | |

|
#20
Classy Ct
Richlands, NC 28574
|
- sq. feet
|
- baths - beds |
show details |
| Photo | Address | Area | Beds / Baths | Price | Details |
|---|---|---|---|---|---|

|
#21
Quail Ln
Richlands, NC 28574
|
- sq. feet
|
- baths - beds |
show details | |

|
#22
Pony Farm Rd
Jacksonville, NC 28540
|
1,675 sq. feet
|
1 baths 3 beds |
show details | |

|
#23
Decatur Rd
Jacksonville, NC 28540
|
2,059 sq. feet
|
3 baths 4 beds |
show details | |

|
#24
Old Comfort Hwy
Trenton, NC 28585
|
1,812 sq. feet
|
2 baths 3 beds |
show details | |

|
#25
Williams St
Jacksonville, NC 28540
|
1,314 sq. feet
|
1 baths 3 beds |
show details | |

|
#26
Barn St
Jacksonville, NC 28540
|
1,216 sq. feet
|
1 baths 3 beds |
show details | |

|
#27
Mill River Rd
Jacksonville, NC 28540
|
1,550 sq. feet
|
2 baths 3 beds |
show details | |

|
#28
Brentwood Ave
Jacksonville, NC 28540
|
2,054 sq. feet
|
3 baths 3 beds |
show details | |

|
#29
E Parker St
Beulaville, NC 28518
|
1,792 sq. feet
|
2 baths 3 beds |
show details | |

|
#30
Walnut Dr
Jacksonville, NC 28540
|
1,040 sq. feet
|
2 baths 3 beds |
show details |
| Photo | Address | Area | Beds / Baths | Price | Details |
|---|---|---|---|---|---|

|
#31
Country Club Rd
Jacksonville, NC 28546
|
1,431 sq. feet
|
2 baths 3 beds |
show details | |

|
#32
Myna Dr
Jacksonville, NC 28540
|
1,301 sq. feet
|
2 baths 3 beds |
show details | |

|
#33
Cypress Creek Rd
Chinquapin, NC 28521
|
1,080 sq. feet
|
2 baths 2 beds |
show details | |

|
#34
Horse Shoe Bnd
Jacksonville, NC 28546
|
1,312 sq. feet
|
2 baths 3 beds |
show details | |

|
#35
Kitty Noecker Rd
Pink Hill, NC 28572
|
1,820 sq. feet
|
2 baths 3 beds |
show details | |

|
#36
Loyd Ln
Beulaville, NC 28518
|
2,206 sq. feet
|
2 baths 4 beds |
show details | |

|
#37
N Bryan Rd
Jacksonville, NC 28546
|
1,405 sq. feet
|
2 baths 3 beds |
show details | |

|
#38
Briarneck Rd
Jacksonville, NC 28540
|
2,356 sq. feet
|
2 baths 3 beds |
show details | |

|
#39
Briarneck Rd
Jacksonville, NC 28540
|
1,768 sq. feet
|
2 baths 4 beds |
show details | |

|
#40
Carolina Pines Dr
Jacksonville, NC 28546
|
1,317 sq. feet
|
2 baths 3 beds |
show details |
| Photo | Address | Area | Beds / Baths | Price | Details |
|---|---|---|---|---|---|

|
#41
Providence Dr
Jacksonville, NC 28546
|
1,816 sq. feet
|
2 baths 3 beds |
show details | |

|
#42
Willie Kellum Rd
Jacksonville, NC 28546
|
1,857 sq. feet
|
2 baths 3 beds |
show details | |

|
#43
Bordeaux St
Jacksonville, NC 28540
|
800 sq. feet
|
1 baths 2 beds |
show details | |

|
#44
Mill River Rd
Jacksonville, NC 28540
|
1,098 sq. feet
|
1 baths 3 beds |
show details | |

|
#45
Elwood Rd
Jacksonville, NC 28546
|
1,982 sq. feet
|
3 baths 3 beds |
show details | |

|
#46
Pueblo Dr
Jacksonville, NC 28546
|
882 sq. feet
|
2 baths 2 beds |
show details | |

|
#47
Arlington Ct
Jacksonville, NC 28546
|
1,538 sq. feet
|
2 baths 3 beds |
show details | |

|
#48
Long Acre Dr
Jacksonville, NC 28546
|
1,578 sq. feet
|
2 baths 3 beds |
show details | |

|
#49
Forest Grove Ave
Jacksonville, NC 28540
|
1,323 sq. feet
|
2 baths 2 beds |
show details | |

|
Check over 1 million property listings on Foreclosure.com!
|
browse all offers | |||

Latest news about housing in Richlands, NC collected exclusively by city-data.com from local newspapers, TV, and radio stations

 | Want to retire near Havelock flooding advice needed (10 replies) |
| Moving to NC...? (11 replies) |
| Seeking any advice-moving to New Bern area.... (5 replies) |
| Husband has new job in Wilmington but family in richlands. (2 replies) |
| Thinking of Coastal NC-relocating (9 replies) |
| Jacksonville -Southwest HS- (4 replies) |

Median year apartment built: 1985
Household type by relationship:
Households: 2,622- Male householders: 338 (61 living alone), Female householders: 458 (101 living alone)
452 spouses (452 opposite-sex spouses), 131 unmarried partners, (131 opposite-sex unmarried partners), 923 children (870 natural, 4 adopted, 48 stepchildren), 46 grandchildren, 45 brothers or sisters, 50 parents, 0 foster children, 135 other relatives, 38 non-relatives
Size of family households: 176 2-persons, 138 3-persons, 104 4-persons, 37 5-persons, 45 6-persons, 41 7-or-more-persons.
Size of nonfamily households: 180 1-person, 93 2-persons, 12 3-persons.
727 married couples with children.
124 single-parent households (5 men, 119 women).
92.7% of residents of Richlands speak English at home.
5.8% of residents speak Spanish at home (100% speak English very well).
0.4% of residents speak other Indo-European language at home (45% speak English very well, 55% speak English well).
0.2% of residents speak Asian or Pacific Island language at home (50% speak English very well, 50% speak English well).
Foreign born population: 19 (0.7%)
(10.5% of them are naturalized citizens)
| Here: | 6.6 |
| State: | 6.4 |
| Here: | 4.1 |
| State: | 4.4 |

- Bedrooms in owner-occupied houses and condos in Richlands, North Carolina
- 0no bedroom
- 01 bedroom
- 942 bedrooms
- 2153 bedrooms
- 1914 bedrooms
- 465+ bedrooms

- Bedrooms in renter-occupied apartments in Richlands, North Carolina
- 0no bedroom
- 211 bedroom
- 1582 bedrooms
- 553 bedrooms
- 584 bedrooms
- 05+ bedrooms

- Cars and other vehicles available in Richlands in owner-occupied houses/condos
- 2no vehicle
- 1211 vehicle
- 1812 vehicles
- 1863 vehicles
- 524 vehicles
- 45+ vehicles

- Cars and other vehicles available in Richlands in renter-occupied apartments
- 35no vehicle
- 1351 vehicle
- 952 vehicles
- 153 vehicles
- 64 vehicles
- 55+ vehicles

- Rooms in owner-occupied houses in Richlands, North Carolina
- 01 room
- 02 rooms
- 423 rooms
- 254 rooms
- 955 rooms
- 1026 rooms
- 1047 rooms
- 748 rooms
- 1069+ rooms

- Rooms in renter-occupied apartments in Richlands, North Carolina
- 01 room
- 02 rooms
- 293 rooms
- 1364 rooms
- 485 rooms
- 156 rooms
- 157 rooms
- 08 rooms
- 499+ rooms


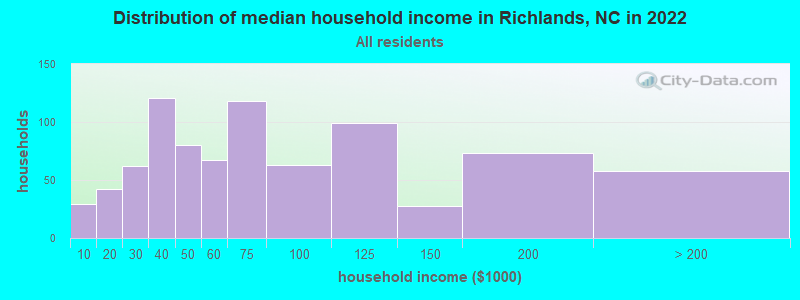
Richlands, NC household income distribution

- 29Less than $10,000
- 42$10,000 to $19,999
- 62$20,000 to $29,999
- 121$30,000 to $39,999
- 80$40,000 to $49,999
- 67$50,000 to $59,999
- 118$60,000 to $74,999
- 63$75,000 to $99,999
- 99$100,000 to $124,999
- 28$125,000 to $149,999
- 73$150,000 to $199,999
- 58$200,000 or more
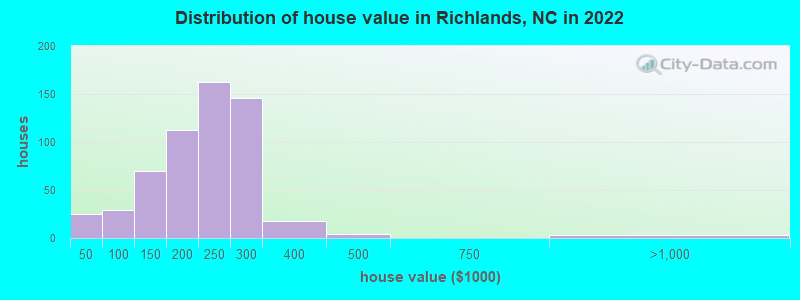
Home value of owner - occupied houses in 2022 in Richlands, NC
-
- 10Less than $10,000
- 1$15,000 to $19,999
- 0$25,000 to $29,999
- 12$35,000 to $39,999
- 2$70,000 to $79,999
- 13$80,000 to $89,999
- 13$90,000 to $99,999
- 31$100,000 to $124,999
- 38$125,000 to $149,999
- 20$150,000 to $174,999
- 92$175,000 to $199,999
- 161$200,000 to $249,999
- 146$250,000 to $299,999
- 18$300,000 to $399,999
- 3$400,000 to $499,999
- 2$750,000 to $999,999
Rent paid by renters in 2022 in Richlands, NC
-
- 3Less than $100
- 7$100 to $149
- 30$150 to $199
- 7$250 to $299
- 2$300 to $349
- 34$450 to $499
- 1$500 to $549
- 6$550 to $599
- 12$600 to $649
- 16$700 to $749
- 9$800 to $899
- 24$900 to $999
- 22$1,000 to $1,249
- 35$1,250 to $1,499
- 2$1,500 to $1,999
- 5No cash rent


Percentage of workers working in this county: 72.6%
Number of people working at home: 101 (9.4% of all workers)
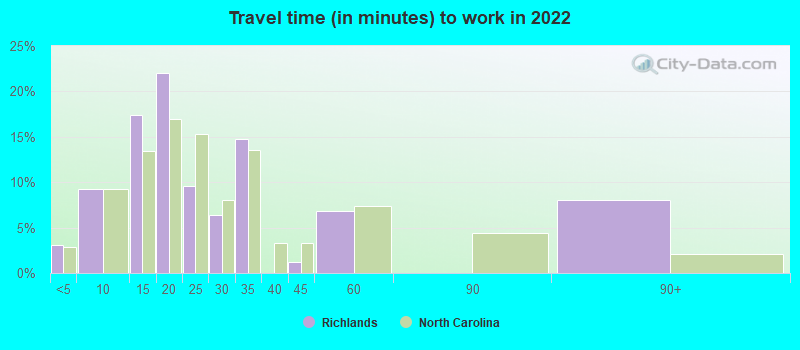
Travel time to work (commute)
- Less than 5 minutes: 43
- 5 to 9 minutes: 53
- 10 to 14 minutes: 77
- 15 to 19 minutes: 44
- 20 to 24 minutes: 98
- 25 to 29 minutes: 131
- 30 to 34 minutes: 197
- 35 to 39 minutes: 18
- 40 to 44 minutes: 17
- 45 to 59 minutes: 60
- 60 to 89 minutes: 105
- 90 or more minutes: 76
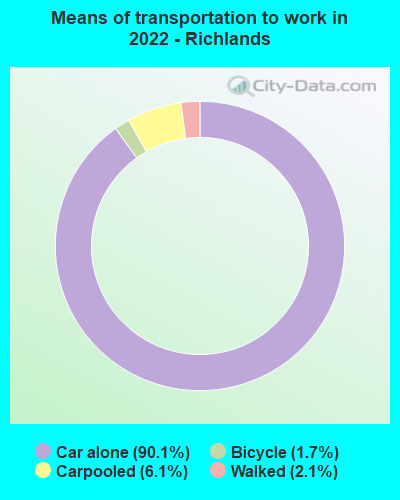
Means of transportation to work:
- Drove a car alone: 1,139 (80.7%)
- Carpooled: 80 (5.7%)
- Bicycle: 24 (1.7%)
- Walked: 28 (2.0%)
- Worked at home: 101 (7.2%)

- Unemployment by race in 2022
- Unemployment rate for White non-Hispanic residents
- 10.5%Males
- 12.1%Females
- Unemployment rate for Black residents
- 19.0%Females
- Unemployment rate for two or more race residents
- 23.4%Females

- Year of entry for the foreign-born population in Richlands, North Carolina
- 182010 or later
- 02000 to 2009
- 01990 to 1999
- 71980 to 1989
- 11970 to 1979
- 4Before 1970

First ancestries reported:
- English: 73 (8.7%)
- American: 66 (7.8%)
- German: 56 (6.7%)
- Irish: 34 (4.0%)
- Italian: 30 (3.6%)
- British: 29 (3.4%)
- Russian: 25 (3.0%)
- European: 10 (1.2%)
- French Canadian: 6 (0.7%)
- African: 5 (0.6%)
- Scottish: 4 (0.5%)
- Polish: 3 (0.4%)
- Scotch-Irish: 2 (0.2%)
- Bermudan: 1 (0.1%)
Most common places of birth for foreign-born residents (%):
| Richlands: | 82.4% (14) |
| North Carolina: | 1.8% (15,534) |
| Richlands: | 5.9% (1) |
| North Carolina: | 0.5% (4,315) |
| Richlands: | 5.9% (1) |
| North Carolina: | 3.8% (33,379) |
Place of birth for U.S.-born residents:
- This state: 887
- Other state: 1,631
- Northeast: 306
- Midwest: 389
- South: 363
- West: 567
79.0% of Richlands residents lived in the same house 1 years ago.
Out of people who lived in different houses, 27.8% lived in this county.
Out of people who lived in different counties, 86.4% lived in North Carolina.
| Richlands: | 79.0% |
| State average: | 87.3% |
Education attainment for males 25 years and older:
- No schooling: 1
- Nursery to 4th grade: 10
- 5th and 6th grade: 8
- 7th and 8th grade: 0
- 9th grade: 7
- 10th grade: 41
- 11th grade: 0
- 12th grade, no diploma: 7
- High school graduate (or equivalency): 312
- Less than 1 year of college: 41
- Some college more than 1 year, no degree: 165
- Associate degree: 41
- Bachelor's degree: 56
- Master's degree: 125
- Professional school degree: 3
- Doctorate degree: 4

Education attainment for females 25 years and older:
- No schooling: 10
- Nursery to 4th grade: 0
- 5th and 6th grade: 7
- 7th and 8th grade: 4
- 9th grade: 0
- 10th grade: 31
- 11th grade: 1
- 12th grade, no diploma: 8
- High school graduate (or equivalency): 143
- Less than 1 year of college: 43
- Some college more than 1 year, no degree: 167
- Associate degree: 35
- Bachelor's degree: 167
- Master's degree: 96
- Professional school degree: 0
- Doctorate degree: 1


Housing units in structures:
- One, detached: 768
- One, attached: 33
- Two: 7
- 3 or 4: 40
- 5 to 9: 14
- 10 to 19: 10
- 20 to 49: 5
- Mobile homes: 31
House/condo owner moved in on average 2 years ago
Renter moved in on average 4 years ago

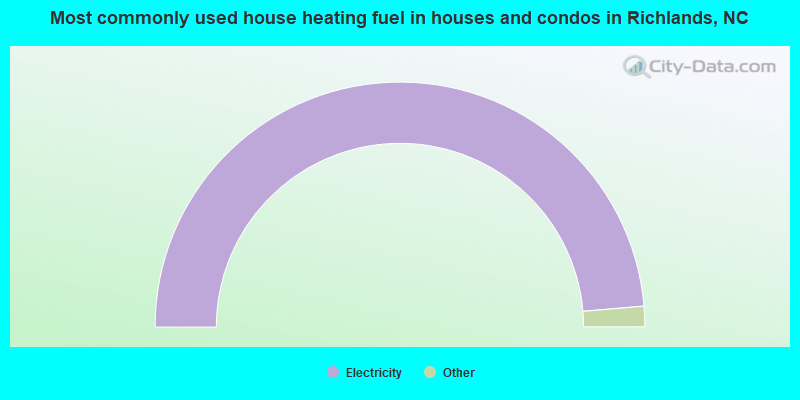
- 97.5%Electricity
- 1.8%Bottled, tank, or LP gas
- 0.4%Fuel oil, kerosene, etc.
- 0.4%No fuel used
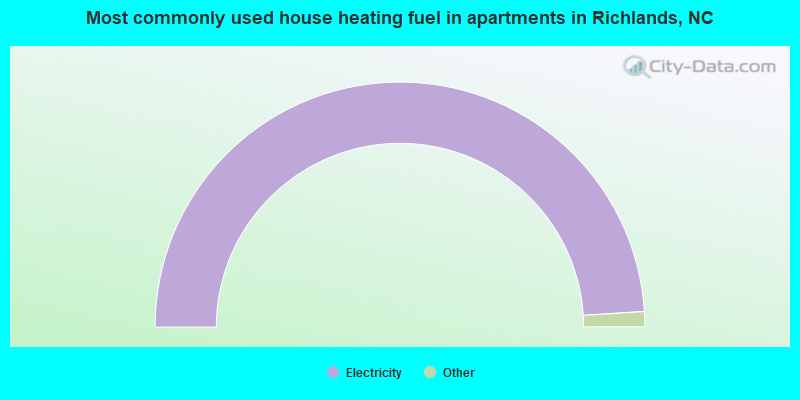
- 98.2%Electricity
- 1.1%Utility gas
- 0.7%Bottled, tank, or LP gas
Private vs. public school enrollment:
| Here: | 26.6% |
| North Carolina: | 13.8% |
| Here: | 9.0% |
| North Carolina: | 11.9% |
| Here: | 10.9% |
| North Carolina: | 19.3% |


