Richmond, CA (California) Houses and Residents
| Richmond: | $646,300 |
| California: | $715,900 |
Mean price in 2022:
Detached houses: $741,720
Here: $741,720 State: $988,808 Townhouses or other attached units: $614,314
Here: $614,314 State: $838,546 In 2-unit structures: $505,500
Here: $505,500 State: $1,138,100 In 3-to-4-unit structures: $1,161,367
Here: $1,161,367 State: $824,253 In 5-or-more-unit structures: $1,161,991
Here: $1,161,991 State: $730,996 Mobile homes: $355,006
Here: $355,006 State: $184,506 Occupied boats, RVs, vans, etc.: $467,679
Here: $467,679 State: $204,957
Total population: 108,565 (Urban population: 98,749, Rural population: 967 (all nonfarm))
Houses: 41,362 (39,931 occupied: 22,149 owner occupied, 17,782 renter occupied)
| % of renters here: | 45% |
| State: | 44% |
Housing density: 1,380 houses/condos per square mile
Median price asked for vacant for-sale houses and condos in 2022: $183,530.
Median contract rent in 2022: $1,601 (lower quartile is $1,164, upper quartile is over $2,000)
Median rent asked for vacant for-rent units in 2022: $1,700
Median gross rent in Richmond, CA in 2022: $1,766
Housing units in Richmond with a mortgage: 14,932 (1,052 second mortgage, 0 home equity loan, 1,052 both second mortgage and home equity loan)
Houses without a mortgage: 248
Median household income for houses/condos with a mortgage: $130,441
Median household income for apartments without a mortgage: $75,644
Median monthly housing costs: $1,876
Compare current foreclosures in Richmond, CA:
| Photo | Address | Area | Beds / Baths | Price | Details |
|---|---|---|---|---|---|

|
#1
2nd St
Richmond, CA 94801
|
887 sq. feet
|
1 baths 3 beds |
$349,900
|
show details |

|
#2
Kelsey St
Richmond, CA 94801
|
1,080 sq. feet
|
3 baths 4 beds |
show details | |

|
#3
S 37th St
Richmond, CA 94804
|
1,352 sq. feet
|
1 baths 2 beds |
show details | |

|
#4
36th St
Richmond, CA 94805
|
1,116 sq. feet
|
1 baths 2 beds |
show details | |

|
#5
Lincoln Ave
Richmond, CA 94804
|
795 sq. feet
|
1 baths 2 beds |
show details | |

|
#6
11th St
Richmond, CA 94801
|
874 sq. feet
|
1 baths 2 beds |
show details | |

|
#7
Bell Ct
Richmond, CA 94804
|
1,281 sq. feet
|
1 baths 3 beds |
show details | |

|
#8
S 41st St
Richmond, CA 94804
|
1,188 sq. feet
|
1 baths 4 beds |
show details | |

|
#9
Nevin Ave
Richmond, CA 94804
|
896 sq. feet
|
1 baths 2 beds |
show details | |

|
#10
Dunn Ave
Richmond, CA 94801
|
1,042 sq. feet
|
1 baths 3 beds |
show details |
| Photo | Address | Area | Beds / Baths | Price | Details |
|---|---|---|---|---|---|

|
#11
22nd St
Richmond, CA 94801
|
1,164 sq. feet
|
1 baths 3 beds |
show details | |

|
#12
Northshore Dr # 2
Richmond, CA 94804
|
2,053 sq. feet
|
3 baths 3 beds |
show details | |

|
#13
Coalinga Ave
Richmond, CA 94801
|
1,008 sq. feet
|
1 baths 3 beds |
show details | |

|
#14
Fleming Ave
Richmond, CA 94804
|
1,096 sq. feet
|
2 baths 3 beds |
show details | |

|
#15
Garvin Ave
Richmond, CA 94801
|
2,290 sq. feet
|
2 baths 4 beds |
show details | |

|
#16
S 55th St
Richmond, CA 94804
|
1,425 sq. feet
|
1 baths 4 beds |
show details | |

|
#17
7th St # A
Richmond, CA 94801
|
1,438 sq. feet
|
3 baths 3 beds |
show details | |

|
#18
S 39th St
Richmond, CA 94804
|
1,346 sq. feet
|
2 baths 3 beds |
show details | |

|
#19
Ralston Ave
Richmond, CA 94805
|
2,240 sq. feet
|
2 baths 5 beds |
show details | |

|
#20
12th St
Richmond, CA 94801
|
1,045 sq. feet
|
1 baths 3 beds |
show details |
| Photo | Address | Area | Beds / Baths | Price | Details |
|---|---|---|---|---|---|

|
#21
Lincoln Ave
Richmond, CA 94804
|
795 sq. feet
|
1 baths 2 beds |
show details | |

|
#22
Clinton Ave
Richmond, CA 94804
|
1,503 sq. feet
|
2 baths 3 beds |
show details | |

|
#23
Florida Ave
Richmond, CA 94804
|
928 sq. feet
|
1 baths 3 beds |
show details | |

|
#24
Pennsylvania Ave
Richmond, CA 94801
|
1,022 sq. feet
|
1 baths 2 beds |
show details | |

|
#25
S 22nd St
Richmond, CA 94804
|
1,848 sq. feet
|
1 baths 3 beds |
show details | |

|
#26
42nd St
Richmond, CA 94805
|
1,183 sq. feet
|
1 baths 2 beds |
show details | |

|
#27
Mclaughlin St
Richmond, CA 94805
|
1,022 sq. feet
|
1 baths 3 beds |
show details | |

|
#28
Mclaughlin St
Richmond, CA 94805
|
1,067 sq. feet
|
1 baths 2 beds |
show details | |

|
#29
Marina Way
Richmond, CA 94801
|
1,497 sq. feet
|
3 baths 3 beds |
show details | |

|
#30
3rd St
Richmond, CA 94801
|
1,050 sq. feet
|
2 baths 4 beds |
show details |
| Photo | Address | Area | Beds / Baths | Price | Details |
|---|---|---|---|---|---|

|
#31
Highland Ave
Richmond, CA 94804
|
1,219 sq. feet
|
2 baths 4 beds |
show details | |

|
#32
33rd St
Richmond, CA 94804
|
1,543 sq. feet
|
2 baths 3 beds |
show details | |

|
#33
Coalinga Ave
Richmond, CA 94801
|
1,008 sq. feet
|
1 baths 3 beds |
show details | |

|
#34
32nd St
Richmond, CA 94804
|
1,113 sq. feet
|
1 baths 2 beds |
show details | |

|
#35
Clinton Ave
Richmond, CA 94804
|
1,584 sq. feet
|
1 baths 3 beds |
show details | |

|
#36
Monterey St
Richmond, CA 94804
|
1,627 sq. feet
|
2 baths 3 beds |
show details | |

|
#37
16th St
Richmond, CA 94801
|
1,336 sq. feet
|
1 baths 3 beds |
show details | |

|
#38
16th St
Richmond, CA 94801
|
963 sq. feet
|
1 baths 2 beds |
show details | |

|
#39
Columbia Ave
Richmond, CA 94804
|
534 sq. feet
|
1 baths 1 beds |
show details | |

|
#40
S 39th St
Richmond, CA 94804
|
1,346 sq. feet
|
2 baths 3 beds |
show details |
| Photo | Address | Area | Beds / Baths | Price | Details |
|---|---|---|---|---|---|

|
#41
Andrade Ave
Richmond, CA 94804
|
1,529 sq. feet
|
2 baths 3 beds |
show details | |

|
#42
Overend Ave
Richmond, CA 94804
|
1,208 sq. feet
|
1 baths 3 beds |
show details | |

|
#43
6th St
Richmond, CA 94801
|
1,531 sq. feet
|
2 baths 3 beds |
show details | |

|
#44
Pinnacle Ct Apt 304
Richmond, CA 94801
|
1,544 sq. feet
|
2 baths 2 beds |
show details | |

|
#45
Maritime Way
Richmond, CA 94804
|
1,712 sq. feet
|
3 baths 3 beds |
show details | |

|
#46
Reid Ln
Richmond, CA 94801
|
2,055 sq. feet
|
2 baths 4 beds |
show details | |

|
#47
Arlington Blvd
Richmond, CA 94805
|
1,909 sq. feet
|
2 baths 4 beds |
show details | |

|
#48
Olive Ave
Richmond, CA 94805
|
684 sq. feet
|
1 baths 2 beds |
show details | |

|
#49
Merced St
Richmond, CA 94804
|
1,390 sq. feet
|
2 baths 3 beds |
show details | |

|
Check over 1 million property listings on Foreclosure.com!
|
browse all offers | |||

Latest news about housing in Richmond, CA collected exclusively by city-data.com from local newspapers, TV, and radio stations


Median year apartment built: 1966
Household type by relationship:
Households: 114,287- Male householders: 19,583 (4,179 living alone), Female householders: 20,348 (6,248 living alone)
16,016 spouses (15,848 opposite-sex spouses), 5,062 unmarried partners, (4,669 opposite-sex unmarried partners), 32,163 children (30,128 natural, 507 adopted, 1,528 stepchildren), 4,337 grandchildren, 1,617 brothers or sisters, 3,247 parents, 112 foster children, 5,100 other relatives, 5,381 non-relatives
- In group quarters: 1,321
Size of family households: 7,506 2-persons, 5,236 3-persons, 5,470 4-persons, 3,184 5-persons, 2,342 6-persons, 1,348 7-or-more-persons.
Size of nonfamily households: 10,427 1-person, 3,974 2-persons, 259 3-persons, 185 4-persons.
10,230 married couples with children.
6,342 single-parent households (1,660 men, 4,682 women).
45.8% of residents of Richmond speak English at home.
37.1% of residents speak Spanish at home (49% speak English very well, 25% speak English well, 17% speak English not well, 9% don't speak English at all).
4.8% of residents speak other Indo-European language at home (54% speak English very well, 21% speak English well, 19% speak English not well, 6% don't speak English at all).
9.6% of residents speak Asian or Pacific Island language at home (46% speak English very well, 38% speak English well, 11% speak English not well, 6% don't speak English at all).
2.7% of residents speak other language at home (66% speak English very well, 26% speak English well, 8% don't speak English at all).
Foreign born population: 41,508 (36.3%)
(50.4% of them are naturalized citizens)
| Here: | 5.6 |
| State: | 6.0 |
| Here: | 4.1 |
| State: | 3.9 |

- Bedrooms in owner-occupied houses and condos in Richmond, California
- 197no bedroom
- 1,3351 bedroom
- 5,9172 bedrooms
- 9,2153 bedrooms
- 4,3414 bedrooms
- 1,1445+ bedrooms

- Bedrooms in renter-occupied apartments in Richmond, California
- 1,586no bedroom
- 3,8001 bedroom
- 7,4782 bedrooms
- 3,8403 bedrooms
- 8284 bedrooms
- 2505+ bedrooms

- Cars and other vehicles available in Richmond in owner-occupied houses/condos
- 784no vehicle
- 7,2551 vehicle
- 6,9302 vehicles
- 4,1623 vehicles
- 1,6004 vehicles
- 1,4185+ vehicles

- Cars and other vehicles available in Richmond in renter-occupied apartments
- 1,536no vehicle
- 6,2111 vehicle
- 6,4602 vehicles
- 2,8093 vehicles
- 5344 vehicles
- 2325+ vehicles

- Rooms in owner-occupied houses in Richmond, California
- 1211 room
- 4802 rooms
- 1,4393 rooms
- 2,9294 rooms
- 5,7715 rooms
- 5,3786 rooms
- 3,0917 rooms
- 1,2108 rooms
- 1,7309+ rooms

- Rooms in renter-occupied apartments in Richmond, California
- 1,2871 room
- 6662 rooms
- 3,4053 rooms
- 5,7024 rooms
- 4,0595 rooms
- 1,3976 rooms
- 6797 rooms
- 1008 rooms
- 4879+ rooms


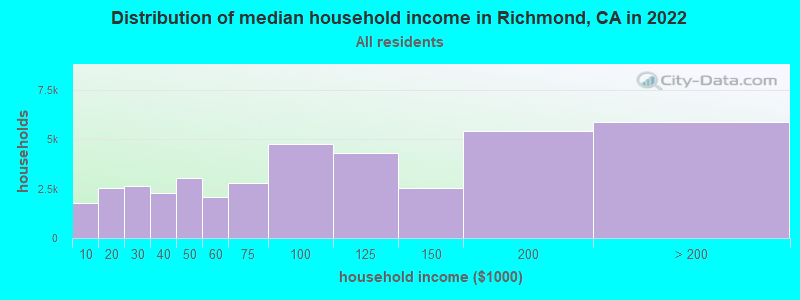
Richmond, CA household income distribution

- 1,769Less than $10,000
- 2,554$10,000 to $19,999
- 2,622$20,000 to $29,999
- 2,254$30,000 to $39,999
- 3,016$40,000 to $49,999
- 2,092$50,000 to $59,999
- 2,789$60,000 to $74,999
- 4,762$75,000 to $99,999
- 4,295$100,000 to $124,999
- 2,506$125,000 to $149,999
- 5,402$150,000 to $199,999
- 5,870$200,000 or more
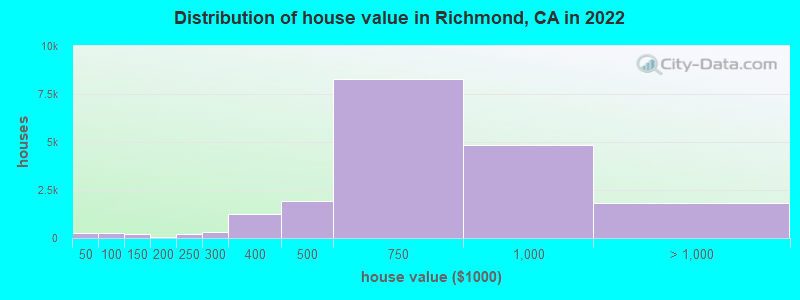
Home value of owner - occupied houses in 2022 in Richmond, CA
-
- 189Less than $10,000
- 41$10,000 to $14,999
- 10$15,000 to $19,999
- 9$25,000 to $29,999
- 18$35,000 to $39,999
- 5$40,000 to $49,999
- 55$50,000 to $59,999
- 34$60,000 to $69,999
- 40$70,000 to $79,999
- 73$80,000 to $89,999
- 27$90,000 to $99,999
- 197$100,000 to $124,999
- 12$125,000 to $149,999
- 73$150,000 to $174,999
- 4$175,000 to $199,999
- 183$200,000 to $249,999
- 321$250,000 to $299,999
- 1,239$300,000 to $399,999
- 1,926$400,000 to $499,999
- 8,292$500,000 to $749,999
- 4,827$750,000 to $999,999
- 1,369$1,000,000 to $1,499,999
- 147$1,500,000 to $1,999,999
- 321$2,000,000 or more
Rent paid by renters in 2022 in Richmond, CA
-
- 83Less than $100
- 17$100 to $149
- 59$150 to $199
- 549$200 to $249
- 303$250 to $299
- 247$300 to $349
- 208$350 to $399
- 321$400 to $449
- 181$450 to $499
- 93$500 to $549
- 236$550 to $599
- 30$600 to $649
- 319$650 to $699
- 38$700 to $749
- 123$750 to $799
- 328$800 to $899
- 334$900 to $999
- 2,166$1,000 to $1,249
- 2,327$1,250 to $1,499
- 4,221$1,500 to $1,999
- 2,933$2,000 to $2,499
- 1,752$2,500 to $2,999
- 742$3,000 to $3,499
- 331$3,500 or more
- 701No cash rent


Percentage of workers working in this county: 46.0%
Number of people working at home: 7,087 (13.1% of all workers)
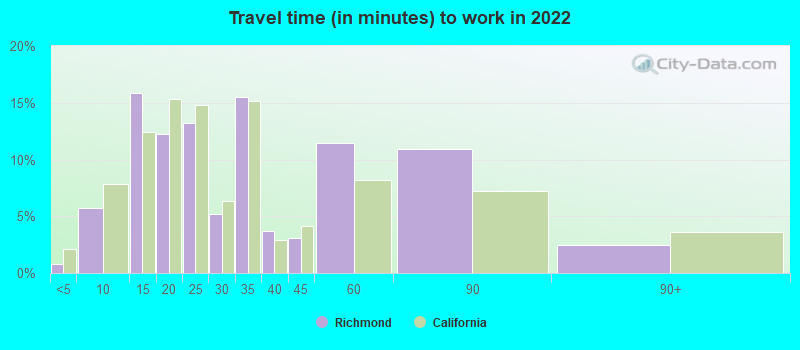
Travel time to work (commute)
- Less than 5 minutes: 680
- 5 to 9 minutes: 1,471
- 10 to 14 minutes: 4,843
- 15 to 19 minutes: 5,927
- 20 to 24 minutes: 4,816
- 25 to 29 minutes: 1,729
- 30 to 34 minutes: 8,022
- 35 to 39 minutes: 2,201
- 40 to 44 minutes: 3,926
- 45 to 59 minutes: 4,340
- 60 to 89 minutes: 7,545
- 90 or more minutes: 1,427
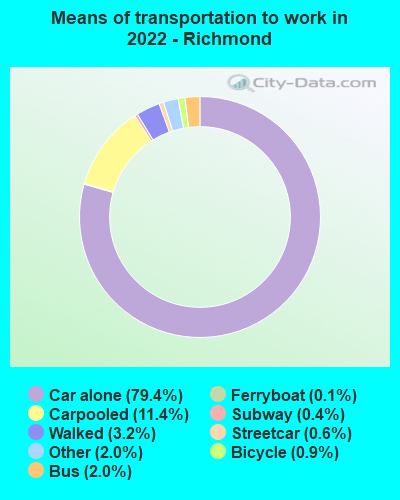
Means of transportation to work:
- Drove a car alone: 31,579 (67.4%)
- Carpooled: 4,526 (9.7%)
- Bus: 778 (1.7%)
- Subway or elevated rail: 243 (0.5%)
- Long-distance train or commuter rail: 150 (0.3%)
- Ferryboat: 45 (0.1%)
- Taxi: 796 (1.7%)
- Bicycle: 358 (0.8%)
- Walked: 1,278 (2.7%)
- Worked at home: 7,087 (15.1%)

- Unemployment by race in 2022
- Unemployment rate for White non-Hispanic residents
- 3.6%Males
- 1.2%Females
- Unemployment rate for Black residents
- 9.2%Males
- 8.4%Females
- Unemployment rate for American Indian and Alaska Native residents
- 3.8%Males
- 3.5%Females
- Unemployment rate for Asian residents
- 0.9%Males
- 10.5%Females
- Unemployment rate for other race residents
- 5.6%Males
- 9.0%Females
- Unemployment rate for two or more race residents
- 7.7%Males
- Unemployment rate for Hispanic or Latino residents
- 6.2%Males
- 3.5%Females

- Year of entry for the foreign-born population in Richmond, California
- 11,8172010 or later
- 9,7982000 to 2009
- 9,6771990 to 1999
- 9,1451980 to 1989
- 3,5321970 to 1979
- 2,078Before 1970

First ancestries reported:
- Brazilian: 1,719 (2.1%)
- European: 1,234 (1.5%)
- African: 1,044 (1.3%)
- Irish: 731 (0.9%)
- English: 670 (0.8%)
- German: 640 (0.8%)
- American: 553 (0.7%)
- Italian: 412 (0.5%)
- Kenyan: 386 (0.5%)
- Ethiopian: 365 (0.5%)
- Portuguese: 288 (0.4%)
- Polish: 275 (0.3%)
- Arab: 246 (0.3%)
- Iranian: 203 (0.3%)
- Russian: 138 (0.2%)
- French: 129 (0.2%)
- Israeli: 110 (0.1%)
- Moroccan: 83 (0.1%)
- Dutch: 82 (0.1%)
- Nigerian: 81 (0.1%)
- Scotch-Irish: 80 (0.10%)
- Scottish: 73 (0.09%)
- Scandinavian: 69 (0.09%)
- Norwegian: 69 (0.09%)
- Finnish: 68 (0.08%)
- Welsh: 64 (0.08%)
- Greek: 58 (0.07%)
- British: 51 (0.06%)
- Northern European: 48 (0.06%)
- Eastern European: 46 (0.06%)
- Swedish: 43 (0.05%)
- Jamaican: 34 (0.04%)
- Lebanese: 30 (0.04%)
- Afghan: 30 (0.04%)
- Ukrainian: 29 (0.04%)
- Slovak: 28 (0.03%)
- Lithuanian: 26 (0.03%)
- Bulgarian: 25 (0.03%)
- Latvian: 21 (0.03%)
- Turkish: 21 (0.03%)
- Croatian: 15 (0.02%)
- Luxembourger: 14 (0.02%)
- Canadian: 14 (0.02%)
- Albanian: 14 (0.02%)
- Belgian: 13 (0.02%)
- Basque: 13 (0.02%)
- Swiss: 13 (0.02%)
- Assyrian: 8 (0.01%)
- Syrian: 8 (0.01%)
- Serbian: 8 (0.01%)
- Egyptian: 8 (0.01%)
- French Canadian: 8 (0.01%)
- Danish: 8 (0.01%)
- Hungarian: 7 (0.01%)
- Australian: 6 (0.01%)
- Icelander: 6 (0.01%)
- Czech: 5 (0.01%)
- Estonian: 5 (0.01%)
Most common places of birth for foreign-born residents (%):
| Richmond: | 34.4% (13,672) |
| California: | 37.2% (3,881,193) |
| Richmond: | 13.7% (5,419) |
| California: | 4.2% (440,287) |
| Richmond: | 6.2% (2,448) |
| California: | 2.8% (290,436) |
| Richmond: | 5.2% (2,079) |
| California: | 7.8% (818,297) |
| Richmond: | 5.0% (1,967) |
| California: | 6.6% (684,672) |
| Richmond: | 4.7% (1,846) |
| California: | 0.5% (53,222) |
| Richmond: | 2.6% (1,020) |
| California: | 0.6% (58,161) |
| Richmond: | 2.2% (884) |
| California: | 4.9% (512,335) |
| Richmond: | 2.1% (815) |
| California: | 1.0% (105,215) |
| Richmond: | 1.8% (733) |
| California: | 0.6% (66,590) |
| Richmond: | 1.7% (672) |
| California: | 5.2% (539,184) |
| Richmond: | 1.7% (656) |
| California: | 0.5% (48,911) |
| Richmond: | 1.5% (612) |
| California: | 0.2% (16,541) |
Place of birth for U.S.-born residents:
- This state: 54,167
- Other state: 15,986
- Northeast: 3,736
- Midwest: 2,762
- South: 7,448
- West: 2,040
91.2% of Richmond residents lived in the same house 1 years ago.
Out of people who lived in different houses, 31.9% lived in this county.
Out of people who lived in different counties, 87.7% lived in California.
| Richmond: | 91.2% |
| State average: | 88.9% |
Education attainment for males 25 years and older:
- No schooling: 2,146
- Nursery to 4th grade: 923
- 5th and 6th grade: 1,612
- 7th and 8th grade: 419
- 9th grade: 1,153
- 10th grade: 318
- 11th grade: 994
- 12th grade, no diploma: 866
- High school graduate (or equivalency): 7,984
- Less than 1 year of college: 1,652
- Some college more than 1 year, no degree: 5,182
- Associate degree: 3,768
- Bachelor's degree: 8,049
- Master's degree: 3,346
- Professional school degree: 510
- Doctorate degree: 357

Education attainment for females 25 years and older:
- No schooling: 1,926
- Nursery to 4th grade: 928
- 5th and 6th grade: 893
- 7th and 8th grade: 649
- 9th grade: 1,093
- 10th grade: 473
- 11th grade: 848
- 12th grade, no diploma: 1,096
- High school graduate (or equivalency): 8,803
- Less than 1 year of college: 2,525
- Some college more than 1 year, no degree: 5,961
- Associate degree: 3,042
- Bachelor's degree: 8,553
- Master's degree: 3,637
- Professional school degree: 563
- Doctorate degree: 622


Housing units in structures:
- One, detached: 26,333
- One, attached: 2,677
- Two: 1,395
- 3 or 4: 2,914
- 5 to 9: 2,685
- 10 to 19: 853
- 20 to 49: 1,497
- 50 or more: 2,967
- Boats, RVs, vans, etc.: 41
Housing units lacking complete kitchen facilities in 2022: 0.8%
House/condo owner moved in on average 16 years ago
Renter moved in on average 6 years ago

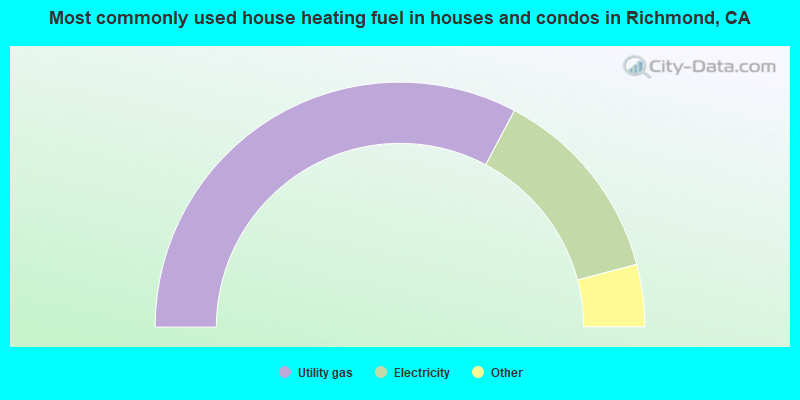
- 65.5%Utility gas
- 26.3%Electricity
- 2.5%No fuel used
- 2.4%Bottled, tank, or LP gas
- 1.7%Solar energy
- 1.2%Wood
- 0.5%Other fuel
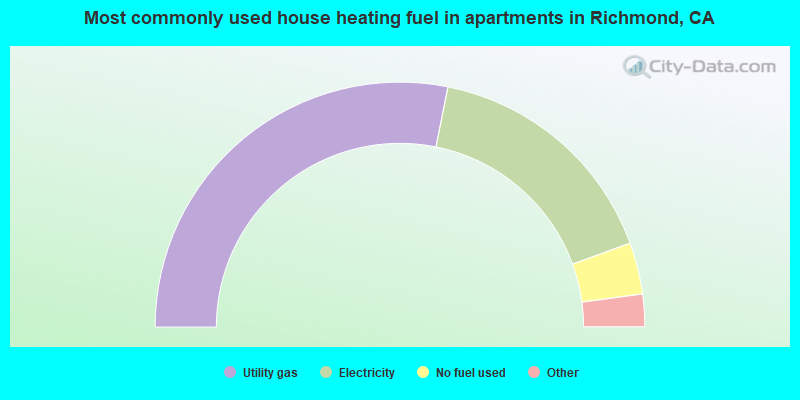
- 56.3%Utility gas
- 32.6%Electricity
- 6.8%No fuel used
- 2.1%Bottled, tank, or LP gas
- 1.4%Other fuel
- 0.8%Solar energy
Private vs. public school enrollment:
| Here: | 1.8% |
| California: | 10.5% |
| Here: | 8.5% |
| California: | 8.5% |
| Here: | 10.8% |
| California: | 15.9% |


