Richmond Heights, MO (Missouri) Houses and Residents
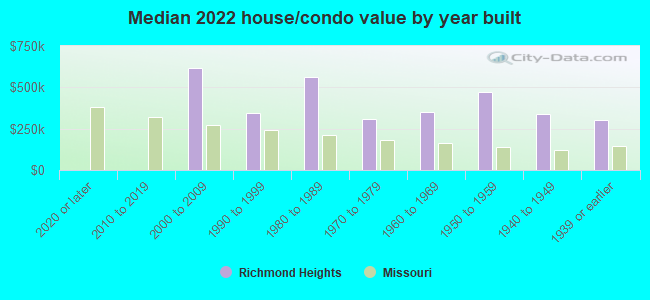
| Richmond Heights: | $332,018 |
| Missouri: | $221,200 |
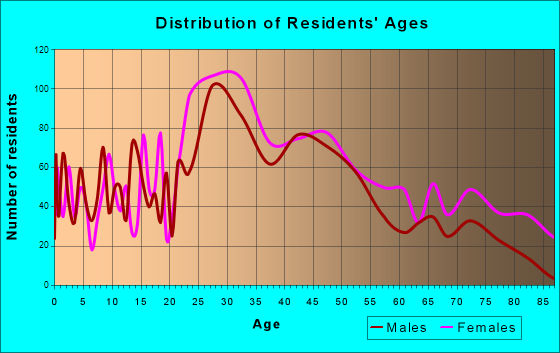
Total population: 8,495 (All urban)
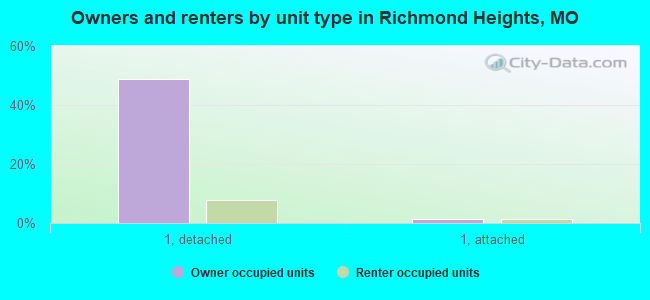
Houses: 4,693 (4,418 occupied: 2,321 owner occupied, 2,087 renter occupied)
| % of renters here: | 47% |
| State: | 32% |
Housing density: 2,049 houses/condos per square mile
Median price asked for vacant for-sale houses and condos in 2022: $260,345.
Median contract rent in 2022: $1,379 (lower quartile is $823, upper quartile is $1,807)
Median rent asked for vacant for-rent units in 2022: $2,149
Median gross rent in Richmond Heights, MO in 2022: $1,459
Housing units in Richmond Heights with a mortgage: 1,588 (126 second mortgage, 0 home equity loan, 123 both second mortgage and home equity loan)
Houses without a mortgage: 46
Median household income for houses/condos with a mortgage: $143,240
Median household income for apartments without a mortgage: $82,662
Median monthly housing costs: $1,538
Compare current foreclosures near Richmond Heights, MO:
| Photo | Address | Area | Beds / Baths | Price | Details |
|---|---|---|---|---|---|

|
#1
E Milton Ave
Saint Louis, MO 63114
|
1,325 sq. feet
|
1 baths 2 beds |
$184,900
|
show details |

|
#2
N New Florissant Roa
Florissant, MO 63031
|
840 sq. feet
|
1 baths 2 beds |
$167,000
|
show details |

|
#3
Partridge Run Dr
Florissant, MO 63033
|
1,140 sq. feet
|
1 baths 2 beds |
$113,000
|
show details |

|
#4
Grants Pkwy
Florissant, MO 63031
|
986 sq. feet
|
1 baths 3 beds |
$159,900
|
show details |

|
#5
Saint Charles St Apt 801
Saint Louis, MO 63101
|
1,688 sq. feet
|
2 baths 1 beds |
$154,900
|
show details |

|
#6
Old State Route 21
Imperial, MO 63052
|
1,763 sq. feet
|
2 baths 3 beds |
$144,900
|
show details |

|
#7
Hodiamont Ave # E4
Saint Louis, MO 63112
|
1 sq. feet
|
2 baths 2 beds |
$167,000
|
show details |

|
#8
Hannover Ave
Saint Louis, MO 63123
|
912 sq. feet
|
1 baths 2 beds |
$159,900
|
show details |

|
#9
Louisiana Ave
Saint Louis, MO 63118
|
2,360 sq. feet
|
2 baths 2 beds |
$187,000
|
show details |

|
#10
Mallet Hl
Ballwin, MO 63021
|
4,530 sq. feet
|
4 baths 5 beds |
$649,900
|
show details |
| Photo | Address | Area | Beds / Baths | Price | Details |
|---|---|---|---|---|---|

|
#11
Cricket Ct
Florissant, MO 63033
|
1,557 sq. feet
|
2 baths 4 beds |
$90,250
|
show details |

|
#12
Deer St
Saint Louis, MO 63113
|
1,646 sq. feet
|
1 baths 3 beds |
$250,000
|
show details |

|
#13
Lucinda Dr
Fairview Heights, IL 62208
|
1,040 sq. feet
|
2 baths 2 beds |
$157,900
|
show details |

|
#14
Concord Pl
Saint Louis, MO 63147
|
768 sq. feet
|
1 baths 2 beds |
$59,900
|
show details |

|
#15
Jerries Ln
Saint Louis, MO 63136
|
1,380 sq. feet
|
1 baths 3 beds |
$219,900
|
show details |

|
#16
Bagley Dr
Saint Louis, MO 63136
|
982 sq. feet
|
1 baths 2 beds |
$119,900
|
show details |

|
#17
Ross Ave
Saint Louis, MO 63146
|
1,520 sq. feet
|
2 baths 3 beds |
$218,400
|
show details |

|
#18
Idaho Ave
Saint Louis, MO 63111
|
979 sq. feet
|
1 baths 2 beds |
$129,900
|
show details |

|
#19
Cunniff Pl
Saint Louis, MO 63135
|
1,596 sq. feet
|
1 baths 3 beds |
$84,900
|
show details |

|
#20
Sims Ave
Saint Louis, MO 63114
|
1,278 sq. feet
|
1 baths 3 beds |
$195,000
|
show details |
| Photo | Address | Area | Beds / Baths | Price | Details |
|---|---|---|---|---|---|

|
#21
Ridge Ave
Saint Louis, MO 63113
|
1,868 sq. feet
|
2 baths 6 beds |
$114,900
|
show details |

|
#22
Rosewood Ave
Saint Louis, MO 63120
|
1,152 sq. feet
|
1 baths 2 beds |
$125,000
|
show details |

|
#23
Lothian Cir
Saint Louis, MO 63137
|
1,044 sq. feet
|
1 baths 2 beds |
$99,900
|
show details |

|
#24
Hamilton Ave
Saint Louis, MO 63136
|
832 sq. feet
|
1 baths 2 beds |
$17,900
|
show details |

|
#25
Washington Ave
Saint Louis, MO 63101
|
- sq. feet
|
2 baths 2 beds |
$229,900
|
show details |

|
#26
Oregon Ave
Saint Louis, MO 63118
|
1,782 sq. feet
|
2 baths - beds |
$12,000
|
show details |

|
#27
Summit Pl
Saint Louis, MO 63136
|
1,039 sq. feet
|
1 baths - beds |
$15,900
|
show details |

|
#28
Paris Ave
Saint Louis, MO 63115
|
1,650 sq. feet
|
1 baths - beds |
$24,900
|
show details |

|
#29
Edwards St
Granite City, IL 62040
|
828 sq. feet
|
- baths 2 beds |
$39,900
|
show details |

|
#30
Grover St
Saint Louis, MO 63112
|
792 sq. feet
|
1 baths - beds |
$12,000
|
show details |
| Photo | Address | Area | Beds / Baths | Price | Details |
|---|---|---|---|---|---|

|
#31
Woodland Point Dr Apt I
Saint Louis, MO 63146
|
1,050 sq. feet
|
2 baths 2 beds |
show details | |

|
#32
Northland Pl
Saint Louis, MO 63113
|
1,736 sq. feet
|
1 baths - beds |
$23,900
|
show details |

|
#33
S Spring Ave
Saint Louis, MO 63116
|
1,592 sq. feet
|
1 baths 3 beds |
show details | |

|
#34
Florissant Rd
Saint Louis, MO 63121
|
1,032 sq. feet
|
2 baths 4 beds |
show details | |

|
#35
Lincoln Ave
Granite City, IL 62040
|
656 sq. feet
|
1 baths 2 beds |
show details | |

|
#36
Moro Ave
Granite City, IL 62040
|
792 sq. feet
|
1 baths 2 beds |
show details | |

|
#37
Sheridan Ave
Granite City, IL 62040
|
1,124 sq. feet
|
1 baths 3 beds |
show details | |

|
#38
Spruce St
Granite City, IL 62040
|
1,120 sq. feet
|
1 baths 2 beds |
show details | |

|
#39
Remus Dr
Florissant, MO 63033
|
1,318 sq. feet
|
2 baths 3 beds |
show details | |

|
#40
Handlan Ct
Saint Louis, MO 63122
|
1,050 sq. feet
|
1 baths 2 beds |
show details |
| Photo | Address | Area | Beds / Baths | Price | Details |
|---|---|---|---|---|---|

|
#41
Glandore Dr
Ballwin, MO 63021
|
1,456 sq. feet
|
2 baths 3 beds |
show details | |

|
#42
Lisette Ave
Saint Louis, MO 63109
|
1,932 sq. feet
|
1 baths 4 beds |
show details | |

|
#43
Maple St
Granite City, IL 62040
|
912 sq. feet
|
1 baths 2 beds |
show details | |

|
#44
Blossom View Dr
Florissant, MO 63033
|
1,762 sq. feet
|
3 baths 3 beds |
show details | |

|
#45
Ashby Rd
Saint Louis, MO 63114
|
972 sq. feet
|
1 baths 2 beds |
show details | |

|
#46
Ridgeview Dr
Saint Louis, MO 63121
|
2,100 sq. feet
|
1 baths 3 beds |
show details | |

|
#47
Bethesda Dr
Belleville, IL 62223
|
840 sq. feet
|
1 baths 2 beds |
show details | |

|
#48
Edwards St
Granite City, IL 62040
|
1,202 sq. feet
|
1 baths 3 beds |
show details | |

|
#49
Spring Ave
Saint Ann, MO 63074
|
888 sq. feet
|
1 baths 3 beds |
show details | |

|
Check over 1 million property listings on Foreclosure.com!
|
browse all offers | |||


 | Trouble finding houses to rent (35 replies) |
| Real estate agent Richmond Heights (0 replies) |
| diversity in Brentwood/Webster/Richmond schools (2 replies) |
| Houses around $200,000 (6 replies) |
| Where to get an apartment if working in Bridgeton? (16 replies) |
| Missouri Native Moving Back. Advice on St. Louis Metro (14 replies) |
Median year apartment built: 1952
Household type by relationship:
Households: 9,100- Male householders: 2,299 (844 living alone), Female householders: 2,067 (1,043 living alone)
1,705 spouses (1,705 opposite-sex spouses), 319 unmarried partners, (308 opposite-sex unmarried partners), 1,952 children (1,775 natural, 19 adopted, 157 stepchildren), 17 grandchildren, 132 brothers or sisters, 51 parents, 0 foster children, 306 other relatives, 220 non-relatives
- In group quarters: 25
Size of family households: 1,014 2-persons, 378 3-persons, 450 4-persons, 161 5-persons, 41 6-persons.
Size of nonfamily households: 1,867 1-person, 424 2-persons, 30 3-persons, 31 4-persons.
1,436 married couples with children.
129 single-parent households (52 men, 77 women).
93.1% of residents of Richmond Heights speak English at home.
1.0% of residents speak Spanish at home (65% speak English very well, 35% speak English well).
2.0% of residents speak other Indo-European language at home (95% speak English very well, 2% speak English well, 3% speak English not well).
2.6% of residents speak Asian or Pacific Island language at home (78% speak English very well, 16% speak English well, 5% speak English not well).
0.7% of residents speak other language at home (46% speak English very well, 54% speak English not well).
Foreign born population: 937 (10.3%)
(53.5% of them are naturalized citizens)
| Here: | 6.7 |
| State: | 6.4 |
| Here: | 4.3 |
| State: | 4.4 |
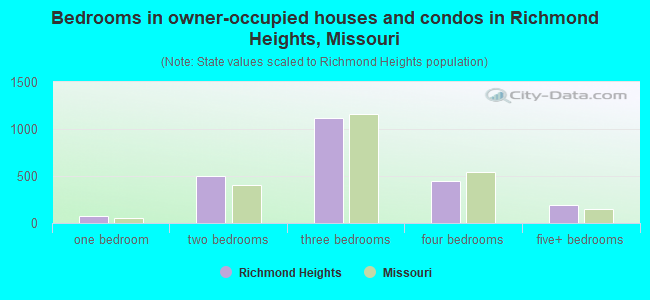
- Bedrooms in owner-occupied houses and condos in Richmond Heights, Missouri
- 0no bedroom
- 761 bedroom
- 4952 bedrooms
- 1,1123 bedrooms
- 4514 bedrooms
- 1875+ bedrooms
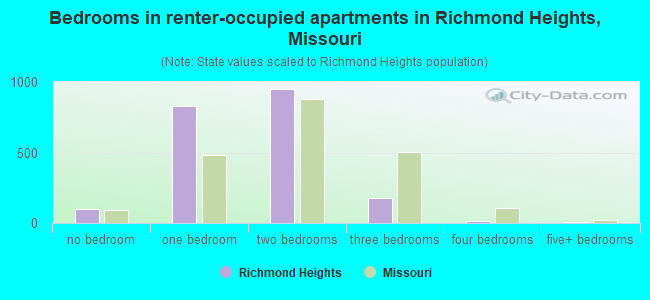
- Bedrooms in renter-occupied apartments in Richmond Heights, Missouri
- 101no bedroom
- 8291 bedroom
- 9512 bedrooms
- 1803 bedrooms
- 174 bedrooms
- 95+ bedrooms
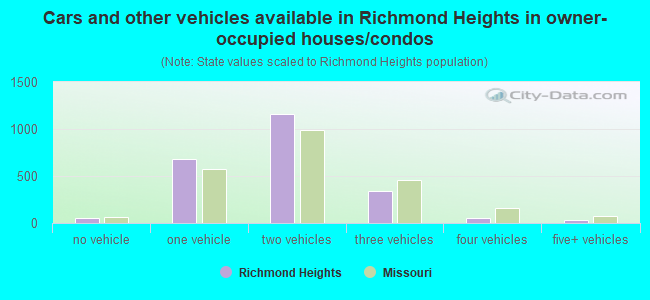
- Cars and other vehicles available in Richmond Heights in owner-occupied houses/condos
- 52no vehicle
- 6771 vehicle
- 1,1642 vehicles
- 3433 vehicles
- 574 vehicles
- 285+ vehicles
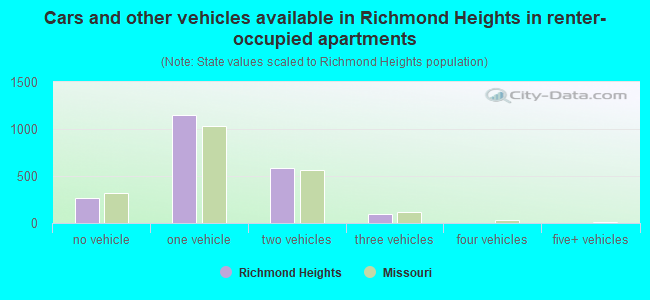
- Cars and other vehicles available in Richmond Heights in renter-occupied apartments
- 267no vehicle
- 1,1441 vehicle
- 5842 vehicles
- 923 vehicles
- 04 vehicles
- 05+ vehicles
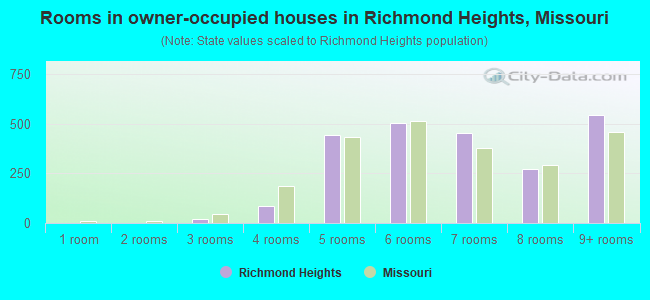
- Rooms in owner-occupied houses in Richmond Heights, Missouri
- 01 room
- 02 rooms
- 193 rooms
- 874 rooms
- 4435 rooms
- 5056 rooms
- 4557 rooms
- 2698 rooms
- 5439+ rooms
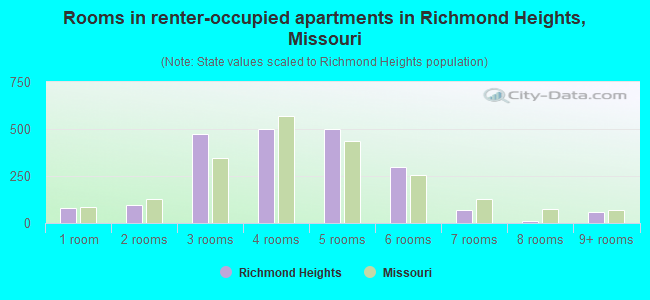
- Rooms in renter-occupied apartments in Richmond Heights, Missouri
- 821 room
- 982 rooms
- 4753 rooms
- 5004 rooms
- 5005 rooms
- 2976 rooms
- 687 rooms
- 108 rooms
- 579+ rooms
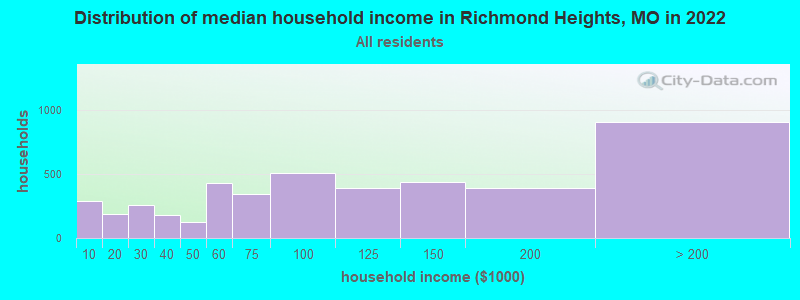
Richmond Heights, MO household income distribution

- 292Less than $10,000
- 186$10,000 to $19,999
- 256$20,000 to $29,999
- 178$30,000 to $39,999
- 123$40,000 to $49,999
- 427$50,000 to $59,999
- 346$60,000 to $74,999
- 505$75,000 to $99,999
- 389$100,000 to $124,999
- 435$125,000 to $149,999
- 390$150,000 to $199,999
- 908$200,000 or more
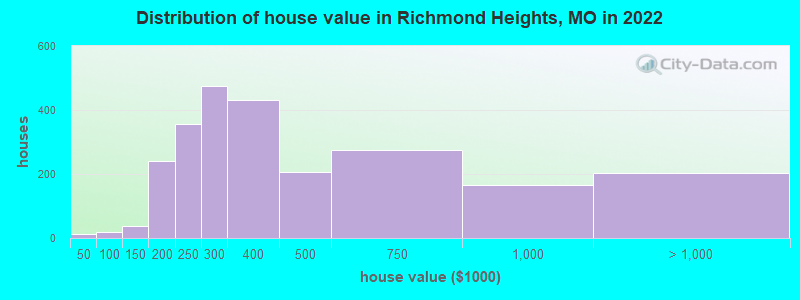
Home value of owner - occupied houses in 2022 in Richmond Heights, MO
-
- 14$15,000 to $19,999
- 4$80,000 to $89,999
- 15$90,000 to $99,999
- 22$100,000 to $124,999
- 13$125,000 to $149,999
- 140$150,000 to $174,999
- 100$175,000 to $199,999
- 355$200,000 to $249,999
- 475$250,000 to $299,999
- 429$300,000 to $399,999
- 207$400,000 to $499,999
- 273$500,000 to $749,999
- 165$750,000 to $999,999
- 109$1,000,000 to $1,499,999
- 75$1,500,000 to $1,999,999
- 19$2,000,000 or more
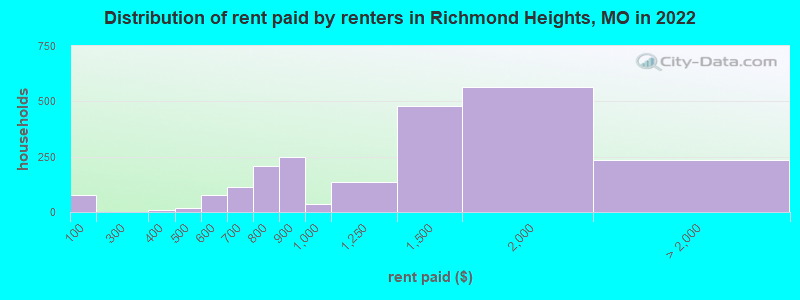
Rent paid by renters in 2022 in Richmond Heights, MO
-
- 78Less than $100
- 9$300 to $349
- 18$400 to $449
- 56$500 to $549
- 18$550 to $599
- 55$600 to $649
- 55$650 to $699
- 169$700 to $749
- 38$750 to $799
- 247$800 to $899
- 37$900 to $999
- 136$1,000 to $1,249
- 479$1,250 to $1,499
- 565$1,500 to $1,999
- 139$2,000 to $2,499
- 22$2,500 to $2,999
- 46$3,000 to $3,499
- 25No cash rent
Percentage of workers working in this county: 61.2%
Number of people working at home: 1,254 (23.6% of all workers)
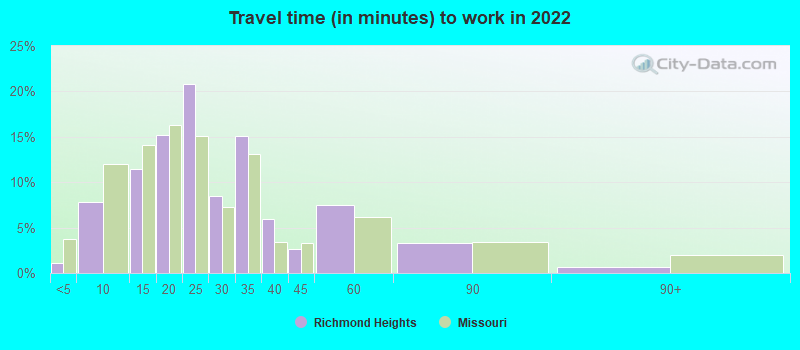
Travel time to work (commute)
- Less than 5 minutes: 81
- 5 to 9 minutes: 591
- 10 to 14 minutes: 817
- 15 to 19 minutes: 824
- 20 to 24 minutes: 886
- 25 to 29 minutes: 366
- 30 to 34 minutes: 255
- 35 to 39 minutes: 29
- 40 to 44 minutes: 99
- 45 to 59 minutes: 87
- 60 to 89 minutes: 74
- 90 or more minutes: 36
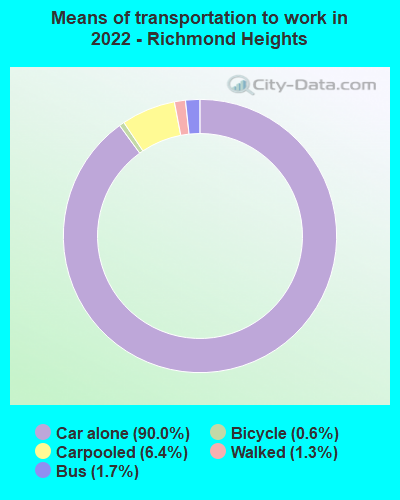
Means of transportation to work:
- Drove a car alone: 6,299 (76.3%)
- Carpooled: 422 (5.1%)
- Bus: 119 (1.4%)
- Taxi: 6 (0.1%)
- Bicycle: 47 (0.6%)
- Walked: 105 (1.3%)
- Worked at home: 1,254 (15.2%)
- Unemployment by race in 2022
- Unemployment rate for White non-Hispanic residents
- 1.7%Males
- 1.0%Females
- Unemployment rate for Black residents
- 4.1%Males
- Unemployment rate for two or more race residents
- 5.5%Males
- Unemployment rate for Hispanic or Latino residents
- 39.8%Males
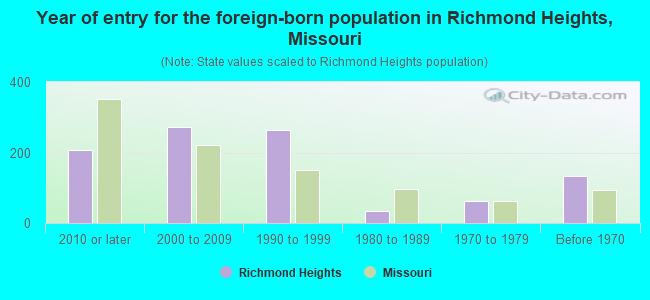
- Year of entry for the foreign-born population in Richmond Heights, Missouri
- 2082010 or later
- 2712000 to 2009
- 2631990 to 1999
- 351980 to 1989
- 611970 to 1979
- 133Before 1970
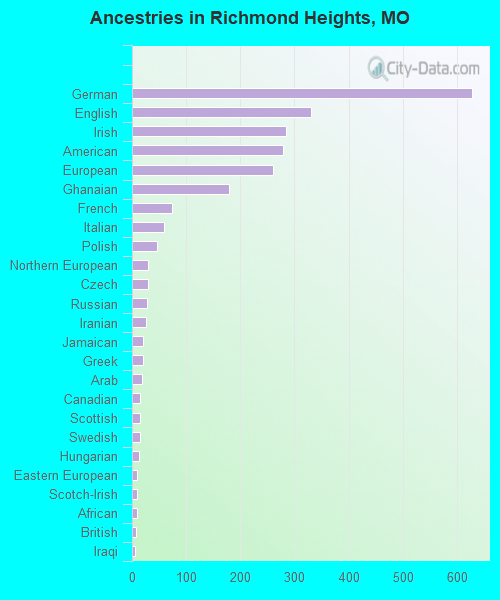
First ancestries reported:
- German: 628 (18.7%)
- English: 330 (9.8%)
- Irish: 285 (8.5%)
- American: 278 (8.3%)
- European: 261 (7.8%)
- Ghanaian: 180 (5.4%)
- French: 73 (2.2%)
- Italian: 59 (1.8%)
- Polish: 47 (1.4%)
- Northern European: 30 (0.9%)
- Czech: 29 (0.9%)
- Russian: 28 (0.8%)
- Iranian: 25 (0.7%)
- Jamaican: 21 (0.6%)
- Greek: 20 (0.6%)
- Arab: 19 (0.6%)
- Canadian: 14 (0.4%)
- Scottish: 14 (0.4%)
- Swedish: 14 (0.4%)
- Hungarian: 13 (0.4%)
- Eastern European: 10 (0.3%)
- Scotch-Irish: 9 (0.3%)
- African: 9 (0.3%)
- British: 7 (0.2%)
- Iraqi: 6 (0.2%)
- Finnish: 6 (0.2%)
- Norwegian: 6 (0.2%)
- Dutch: 4 (0.1%)
Most common places of birth for foreign-born residents (%):
| Richmond Heights: | 21.6% (200) |
| Missouri: | 0.5% (1,245) |
| Richmond Heights: | 14.7% (136) |
| Missouri: | 6.6% (17,002) |
| Richmond Heights: | 10.3% (95) |
| Missouri: | 8.9% (22,932) |
| Richmond Heights: | 9.0% (83) |
| Missouri: | 0.7% (1,850) |
| Richmond Heights: | 6.2% (57) |
| Missouri: | 3.0% (7,803) |
| Richmond Heights: | 5.0% (46) |
| Missouri: | 1.9% (4,806) |
| Richmond Heights: | 3.1% (29) |
| Missouri: | 0.2% (406) |
| Richmond Heights: | 3.0% (28) |
| Missouri: | 2.9% (7,525) |
| Richmond Heights: | 2.4% (22) |
| Missouri: | 0.9% (2,341) |
| Richmond Heights: | 2.2% (20) |
| Missouri: | 0.2% (455) |
| Richmond Heights: | 2.2% (20) |
| Missouri: | 0.2% (409) |
| Richmond Heights: | 1.9% (18) |
| Missouri: | 1.2% (2,988) |
| Richmond Heights: | 1.8% (17) |
| Missouri: | 0.5% (1,295) |
| Richmond Heights: | 1.6% (15) |
| Missouri: | 1.5% (3,767) |
Place of birth for U.S.-born residents:
- This state: 5,195
- Other state: 2,912
- Northeast: 242
- Midwest: 1,502
- South: 542
- West: 615
83.7% of Richmond Heights residents lived in the same house 1 years ago.
Out of people who lived in different houses, 36.7% lived in this county.
Out of people who lived in different counties, 42.9% lived in Missouri.
| Richmond Heights: | 83.7% |
| State average: | 87.1% |
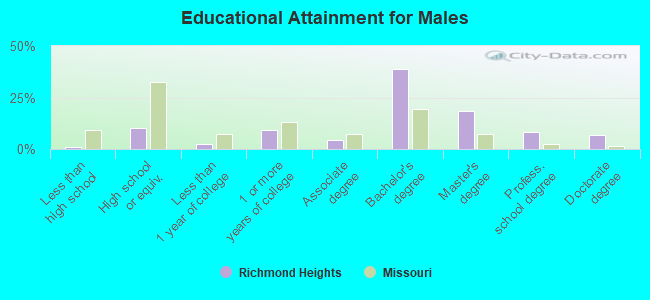
Education attainment for males 25 years and older:
- No schooling: 0
- Nursery to 4th grade: 0
- 5th and 6th grade: 0
- 7th and 8th grade: 21
- 9th grade: 0
- 10th grade: 0
- 11th grade: 4
- 12th grade, no diploma: 13
- High school graduate (or equivalency): 342
- Less than 1 year of college: 79
- Some college more than 1 year, no degree: 309
- Associate degree: 154
- Bachelor's degree: 1,310
- Master's degree: 626
- Professional school degree: 280
- Doctorate degree: 235
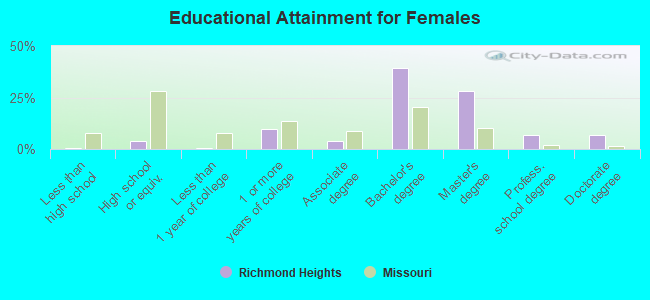
Education attainment for females 25 years and older:
- No schooling: 0
- Nursery to 4th grade: 0
- 5th and 6th grade: 0
- 7th and 8th grade: 0
- 9th grade: 0
- 10th grade: 0
- 11th grade: 16
- 12th grade, no diploma: 0
- High school graduate (or equivalency): 145
- Less than 1 year of college: 17
- Some college more than 1 year, no degree: 349
- Associate degree: 138
- Bachelor's degree: 1,384
- Master's degree: 993
- Professional school degree: 240
- Doctorate degree: 245
Housing units in structures:
- One, detached: 2,610
- One, attached: 120
- Two: 618
- 3 or 4: 361
- 5 to 9: 321
- 10 to 19: 181
- 20 to 49: 135
- 50 or more: 344
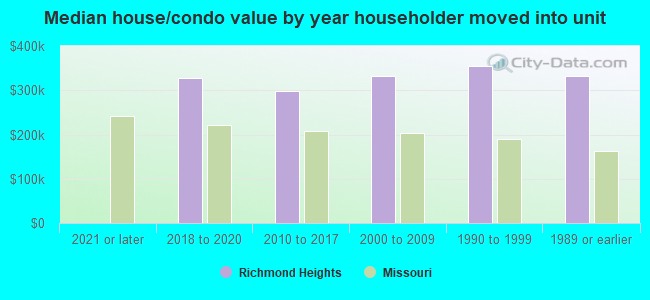
House/condo owner moved in on average 10 years ago
Renter moved in on average 1 years ago
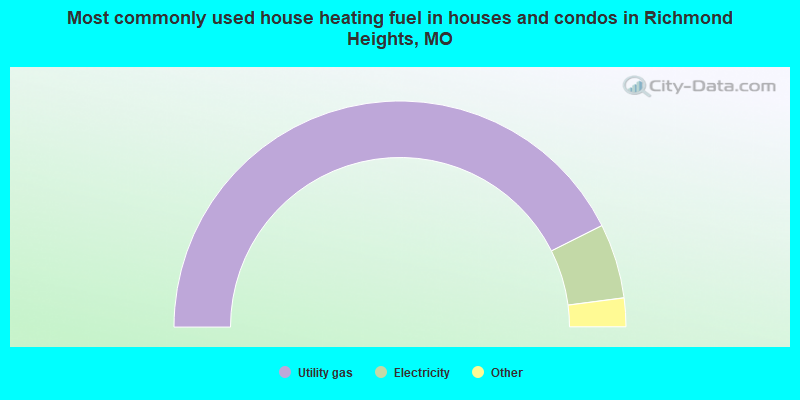
- 85.2%Utility gas
- 10.7%Electricity
- 2.5%Bottled, tank, or LP gas
- 1.5%Other fuel
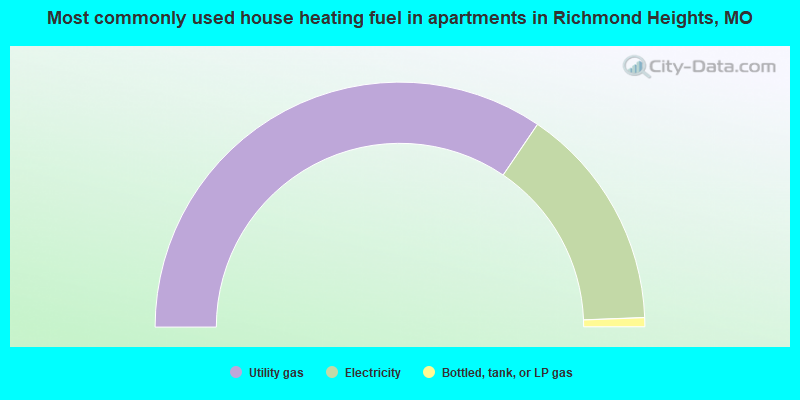
- 69.0%Utility gas
- 29.8%Electricity
- 1.2%Bottled, tank, or LP gas
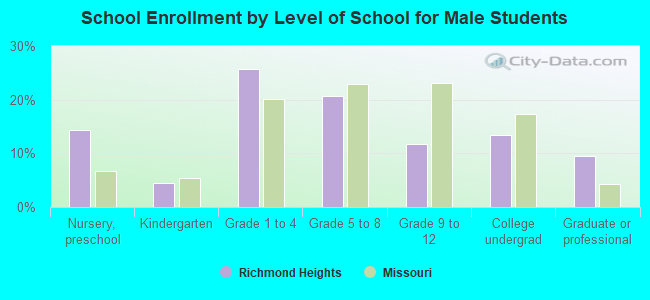
Private vs. public school enrollment:
| Here: | 18.7% |
| Missouri: | 15.4% |
| Here: | 37.2% |
| Missouri: | 13.9% |
| Here: | 55.2% |
| Missouri: | 22.6% |