Richmond, MA (Massachusetts) Houses and Residents
| Richmond: | $558,907 |
| Massachusetts: | $534,700 |
Total population: 1,475 (Urban population: 110, Rural population: 1,499 (27 farm, 1,472 nonfarm))
Houses: 836 (646 occupied: 582 owner occupied, 64 renter occupied)
| % of renters here: | 10% |
| State: | 38% |
Housing density: 44 houses/condos per square mile
Median price asked for vacant for-sale houses and condos in 2022 in this county: $708,441.
Median contract rent in 2022: $1,220 (lower quartile is $871, upper quartile is $1,538)
Median rent asked for vacant for-rent units in 2022: $2,168
Median gross rent in Richmond, MA in 2022: $1,503
Housing units in Richmond with a mortgage: 283 (18 second mortgage, 50 home equity loan, 2 both second mortgage and home equity loan)
Houses without a mortgage: 173
Compare current foreclosures near Richmond, MA:
| Photo | Address | Area | Beds / Baths | Price | Details |
|---|---|---|---|---|---|

|
#1
Crystal St
Lenox Dale, MA 01242
|
1,918 sq. feet
|
2 baths 3 beds |
$165,900
|
show details |

|
#2
Washington Mountain Rd
Lee, MA 01238
|
- sq. feet
|
1 baths 3 beds |
$155,000
|
show details |

|
#3
North St
Pittsfield, MA 01201
|
1,661 sq. feet
|
2 baths 4 beds |
show details | |

|
#4
Robbins Ave
Pittsfield, MA 01201
|
1,872 sq. feet
|
2 baths 4 beds |
show details | |

|
#5
Circular Ave
Pittsfield, MA 01201
|
2,808 sq. feet
|
4 baths 8 beds |
show details | |

|
#6
Madison Ave
Pittsfield, MA 01201
|
2,192 sq. feet
|
2 baths 6 beds |
show details | |

|
#7
Wilshire Dr
Cheshire, MA 01225
|
4,302 sq. feet
|
2 baths 3 beds |
show details | |

|
#8
Dunham Hollow Rd
East Nassau, NY 12062
|
1,640 sq. feet
|
2 baths 4 beds |
show details | |

|
#9
Marion Blvd
Valatie, NY 12184
|
1,180 sq. feet
|
2 baths 3 beds |
show details | |

|
#10
Weller Ave
Pittsfield, MA 01201
|
3,376 sq. feet
|
3 baths 6 beds |
show details |
| Photo | Address | Area | Beds / Baths | Price | Details |
|---|---|---|---|---|---|

|
#11
Daniels Ave
Pittsfield, MA 01201
|
3,040 sq. feet
|
3 baths 6 beds |
show details | |

|
#12
Jennifer St
Lenox, MA 01240
|
1,416 sq. feet
|
1 baths 3 beds |
show details | |

|
#13
Hancock Rd
Pittsfield, MA 01201
|
1,344 sq. feet
|
2 baths 3 beds |
show details | |

|
#14
Elberon Ave
Pittsfield, MA 01201
|
1,794 sq. feet
|
1 baths 4 beds |
show details | |

|
#15
Garfield Ave
Pittsfield, MA 01201
|
2,432 sq. feet
|
2 baths 4 beds |
show details | |

|
#16
Chapel St
Lee, MA 01238
|
1,584 sq. feet
|
1 baths 3 beds |
show details | |

|
#17
Kathy Way
Pittsfield, MA 01201
|
2,136 sq. feet
|
2 baths 3 beds |
show details | |

|
#18
Imperial Ave
Pittsfield, MA 01201
|
1,326 sq. feet
|
1 baths 3 beds |
show details | |

|
#19
Baker St
Lanesboro, MA 01237
|
1,231 sq. feet
|
1 baths 3 beds |
show details | |

|
#20
Davis St
Pittsfield, MA 01201
|
1,456 sq. feet
|
2 baths 3 beds |
show details |
| Photo | Address | Area | Beds / Baths | Price | Details |
|---|---|---|---|---|---|

|
#21
Grange Hall Rd
Stephentown, NY 12168
|
1,670 sq. feet
|
1 baths 2 beds |
show details | |

|
#22
Ashuelot St
Dalton, MA 01226
|
1,792 sq. feet
|
2 baths 3 beds |
show details | |

|
#23
Longfellow Ave
Pittsfield, MA 01201
|
1,356 sq. feet
|
1 baths 4 beds |
show details | |

|
#24
North St
Dalton, MA 01226
|
1,852 sq. feet
|
2 baths 4 beds |
show details | |

|
#25
S Washington State Rd
Becket, MA 01223
|
1,620 sq. feet
|
1 baths 2 beds |
show details | |

|
#26
Eberle Rd Ext
Valatie, NY 12184
|
2,006 sq. feet
|
1 baths 1 beds |
show details | |

|
#27
Tremont Dr
Nassau, NY 12123
|
1,080 sq. feet
|
2 baths 3 beds |
show details | |

|
#28
Westbrook Dr
Nassau, NY 12123
|
768 sq. feet
|
1 baths 2 beds |
show details | |

|
#29
Park Ave
Nassau, NY 12123
|
1,734 sq. feet
|
1 baths 3 beds |
show details | |

|
#30
Route 203
Valatie, NY 12184
|
1,271 sq. feet
|
2 baths 3 beds |
show details |
| Photo | Address | Area | Beds / Baths | Price | Details |
|---|---|---|---|---|---|

|
#31
Route 23
Hillsdale, NY 12529
|
2,762 sq. feet
|
2 baths 4 beds |
show details | |

|
#32
Main St
Becket, MA 01223
|
1,512 sq. feet
|
2 baths 2 beds |
show details | |

|
#33
East St
Lee, MA 01238
|
1,478 sq. feet
|
2 baths 3 beds |
show details | |

|
#34
Donovan St
Pittsfield, MA 01201
|
1,652 sq. feet
|
2 baths 3 beds |
show details | |

|
#35
Lenox Ave
Pittsfield, MA 01201
|
2,290 sq. feet
|
2 baths 6 beds |
show details | |

|
#36
Summit Ave
Pittsfield, MA 01201
|
1,664 sq. feet
|
2 baths 4 beds |
show details | |

|
#37
Upper Queechy Rd
Canaan, NY 12029
|
912 sq. feet
|
1 baths 2 beds |
show details | |

|
#38
Morgan St
Lenox, MA 01240
|
3,959 sq. feet
|
2 baths 3 beds |
show details | |

|
#39
Frisbee St
East Chatham, NY 12060
|
2,400 sq. feet
|
2 baths 4 beds |
show details | |

|
#40
West St
Pittsfield, MA 01201
|
2,018 sq. feet
|
1 baths 3 beds |
show details |
| Photo | Address | Area | Beds / Baths | Price | Details |
|---|---|---|---|---|---|

|
#41
West St
Pittsfield, MA 01201
|
1,714 sq. feet
|
1 baths 4 beds |
show details | |

|
#42
Joseph Dr
Pittsfield, MA 01201
|
1,248 sq. feet
|
1 baths 3 beds |
show details | |

|
#43
Anita Dr
Pittsfield, MA 01201
|
1,504 sq. feet
|
2 baths 3 beds |
show details | |

|
#44
Marshall Ave
Pittsfield, MA 01201
|
1,517 sq. feet
|
1 baths 3 beds |
show details | |

|
#45
Sunrise Ln
Ghent, NY 12075
|
1,188 sq. feet
|
1 baths 3 beds |
show details | |

|
#46
Mcarthur St
Pittsfield, MA 01201
|
1,155 sq. feet
|
1 baths 2 beds |
show details | |

|
#47
Daniels Ave
Pittsfield, MA 01201
|
1,172 sq. feet
|
1 baths 3 beds |
show details | |

|
#48
Briggs Ave
Pittsfield, MA 01201
|
2,116 sq. feet
|
2 baths 4 beds |
show details | |

|
#49
Williams St
Pittsfield, MA 01201
|
1,245 sq. feet
|
1 baths 3 beds |
show details | |

|
Check over 1 million property listings on Foreclosure.com!
|
browse all offers | |||
Latest news about housing in Richmond, MA collected exclusively by city-data.com from local newspapers, TV, and radio stations

 | How Much Massachusetts Households Make Per Year: Census Data (37 replies) |
| Will new construction homes ever be affordable again? (69 replies) |
| Interesting read-Home buyers weary of Greater Boston prices are slipping south to Rhode Island (132 replies) |
| MA Real Estate is CRAZY (344 replies) |
| Cars in MA (789 replies) |
| Why is Boston so famous for its racism?! (1466 replies) |

Household type by relationship:
Households: 125,060- In family households: 97,905 (22,577 male householders, 11,041 female householders)
24,607 spouses, 32,029 children (29,913 natural, 899 adopted, 1,217 stepchildren), 1,640 grandchildren, 800 brothers or sisters, 888 parents, foster children, 744 other relatives, 3,122 non-relatives
- In nonfamily households: 27,155 (10,008 male householders (7,904 living alone)), 12,465 female householders (10,630 living alone)), 4,682 nonrelatives
- In group quarters: 6,159 (2,280 institutionalized population)
19,886 married couples with children.
7,840 single-parent households (1,582 men, 6,258 women).
96.9% of residents of Richmond speak English at home.
0.5% of residents speak Spanish at home (38% speak English very well, 25% speak English well, 38% speak English not well).
1.8% of residents speak other Indo-European language at home (75% speak English very well, 18% speak English well, 7% speak English not well).
0.5% of residents speak Asian or Pacific Island language at home (25% speak English very well, 50% speak English well, 25% speak English not well).
0.2% of residents speak other language at home (100% speak English very well).
Foreign born population: 90 (5.9%)
(63.3% of them are naturalized citizens)
| Here: | 6.5 |
| State: | 6.5 |
| Here: | 5.2 |
| State: | 4.0 |

- Bedrooms in owner-occupied houses and condos in Richmond, Massachusetts
- 0no bedroom
- 161 bedroom
- 842 bedrooms
- 2663 bedrooms
- 1654 bedrooms
- 515+ bedrooms

- Bedrooms in renter-occupied apartments in Richmond, Massachusetts
- 0no bedroom
- 41 bedroom
- 312 bedrooms
- 233 bedrooms
- 64 bedrooms
- 05+ bedrooms

- Cars and other vehicles available in Richmond in owner-occupied houses/condos
- 22no vehicle
- 1411 vehicle
- 2992 vehicles
- 933 vehicles
- 234 vehicles
- 45+ vehicles

- Cars and other vehicles available in Richmond in renter-occupied apartments
- 2no vehicle
- 221 vehicle
- 362 vehicles
- 43 vehicles
- 04 vehicles
- 05+ vehicles

- Rooms in owner-occupied houses in Richmond, Massachusetts
- 01 room
- 42 rooms
- 103 rooms
- 314 rooms
- 765 rooms
- 1096 rooms
- 1377 rooms
- 948 rooms
- 1219+ rooms

- Rooms in renter-occupied apartments in Richmond, Massachusetts
- 01 room
- 22 rooms
- 23 rooms
- 114 rooms
- 185 rooms
- 136 rooms
- 147 rooms
- 18 rooms
- 39+ rooms


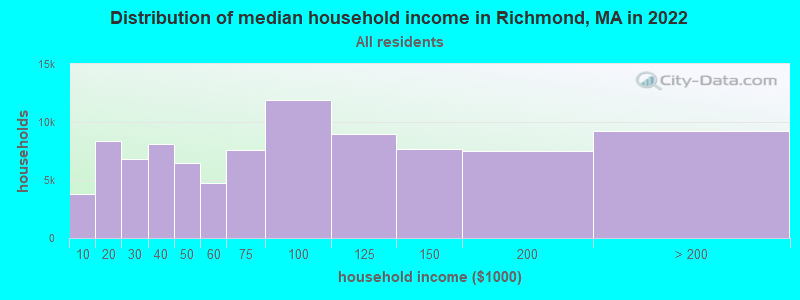
Richmond, MA household income distribution

- 3,755Less than $10,000
- 8,363$10,000 to $19,999
- 6,793$20,000 to $29,999
- 8,097$30,000 to $39,999
- 6,496$40,000 to $49,999
- 4,766$50,000 to $59,999
- 7,570$60,000 to $74,999
- 11,893$75,000 to $99,999
- 8,950$100,000 to $124,999
- 7,710$125,000 to $149,999
- 7,478$150,000 to $199,999
- 9,192$200,000 or more
Percentage of workers working in this county: 91.5%
Number of people working at home: 181 (18.4% of all workers)
Travel time to work (commute)
- Less than 5 minutes: 15
- 5 to 9 minutes: 43
- 10 to 14 minutes: 146
- 15 to 19 minutes: 221
- 20 to 24 minutes: 200
- 25 to 29 minutes: 33
- 30 to 34 minutes: 71
- 35 to 39 minutes: 0
- 40 to 44 minutes: 11
- 45 to 59 minutes: 8
- 60 to 89 minutes: 24
- 90 or more minutes: 36
Means of transportation to work:
- Drove a car alone: 716 (82.7%)
- Carpooled: 74 (8.5%)
- Bus or trolley bus: 2 (0.2%)
- Railroad: 2 (0.2%)
- Walked: 11 (1.3%)
- Other means: 3 (0.3%)
- Worked at home: 58 (6.7%)


- Year of entry for the foreign-born population in Richmond, Massachusetts
- 61995 to March 2000
- 41990 to 1994
- 61985 to 1989
- 41980 to 1984
- 01975 to 1979
- 01970 to 1974
- 171965 to 1969
- 17Before 1965

First ancestries reported:
- Irish: 374 (17.6%)
- Italian: 333 (15.6%)
- English: 265 (12.4%)
- French: 217 (10.2%)
- German: 194 (9.1%)
- Other: 142 (6.7%)
- Polish: 121 (5.7%)
- Swedish: 67 (3.1%)
- Russian: 62 (2.9%)
- United States: 57 (2.7%)
- Scottish: 55 (2.6%)
- French Canadian: 48 (2.3%)
- Scotch-Irish: 47 (2.2%)
- Dutch: 34 (1.6%)
- Arab: 17 (0.8%)
- Norwegian: 14 (0.7%)
- Swiss: 13 (0.6%)
- Czech: 11 (0.5%)
- Greek: 11 (0.5%)
- Portuguese: 11 (0.5%)
- Hungarian: 8 (0.4%)
- Danish: 7 (0.3%)
- Welsh: 7 (0.3%)
- Ukrainian: 6 (0.3%)
- Subsaharan African: 5 (0.2%)
- Lithuanian: 4 (0.2%)
Most common places of birth for foreign-born residents (%):
| Richmond: | 18.5% (10) |
| Massachusetts: | 2.3% (17,987) |
| Richmond: | 13.0% (7) |
| Massachusetts: | 3.3% (25,403) |
| Richmond: | 11.1% (6) |
| Massachusetts: | 1.9% (14,883) |
| Richmond: | 11.1% (6) |
| Massachusetts: | 1.7% (13,456) |
| Richmond: | 7.4% (4) |
| Massachusetts: | 5.2% (40,247) |
| Richmond: | 3.7% (2) |
| Massachusetts: | 0.2% (1,418) |
| Richmond: | 3.7% (2) |
| Massachusetts: | 0.8% (5,895) |
| Richmond: | 3.7% (2) |
| Massachusetts: | 3.7% (28,319) |
| Richmond: | 3.7% (2) |
| Massachusetts: | 1.8% (13,543) |
| Richmond: | 3.7% (2) |
| Massachusetts: | 2.3% (17,449) |
| Richmond: | 3.7% (2) |
| Massachusetts: | 5.1% (39,255) |
| Richmond: | 3.7% (2) |
| Massachusetts: | 1.1% (8,682) |
| Richmond: | 3.7% (2) |
| Massachusetts: | 3.6% (28,086) |
| Richmond: | 3.7% (2) |
| Massachusetts: | 0.7% (5,693) |
| Richmond: | 3.7% (2) |
| Massachusetts: | 2.4% (18,606) |
Place of birth for U.S.-born residents:
- This state: 1,034
- Other state: 509
- Northeast: 334
- Midwest: 78
- South: 72
- West: 25
78% of Richmond residents lived in the same house 5 years ago.
Out of people who lived in different houses, 70% lived in this county.
Out of people who lived in different counties, 40% lived in Massachusetts.
Education attainment for males 25 years and older:
- No schooling: 0
- Nursery to 4th grade: 0
- 5th and 6th grade: 0
- 7th and 8th grade: 7
- 9th grade: 4
- 10th grade: 2
- 11th grade: 10
- 12th grade, no diploma: 10
- High school graduate (or equivalency): 148
- Less than 1 year of college: 35
- Some college more than 1 year, no degree: 74
- Associate degree: 51
- Bachelor's degree: 100
- Master's degree: 50
- Professional school degree: 53
- Doctorate degree: 8

Education attainment for females 25 years and older:
- No schooling: 0
- Nursery to 4th grade: 0
- 5th and 6th grade: 3
- 7th and 8th grade: 13
- 9th grade: 5
- 10th grade: 13
- 11th grade: 9
- 12th grade, no diploma: 11
- High school graduate (or equivalency): 130
- Less than 1 year of college: 44
- Some college more than 1 year, no degree: 67
- Associate degree: 91
- Bachelor's degree: 144
- Master's degree: 65
- Professional school degree: 30
- Doctorate degree: 8


Housing units in structures:
- One, detached: 802
- One, attached: 12
- Two: 17
- 3 or 4: 2
- Mobile homes: 3

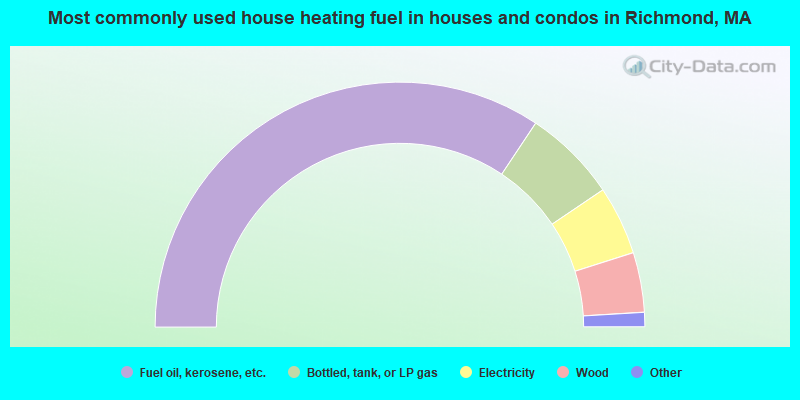
- 68.7%Fuel oil, kerosene, etc.
- 12.4%Bottled, tank, or LP gas
- 9.1%Electricity
- 7.9%Wood
- 1.4%Coal or coke
- 0.3%Other fuel
- 0.2%Utility gas
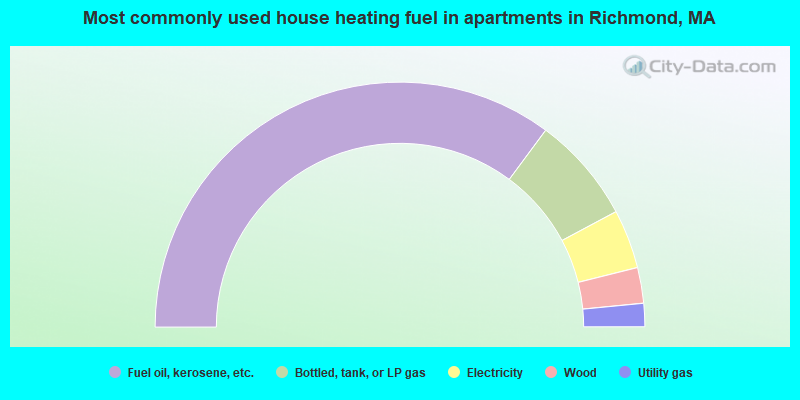
- 70.3%Fuel oil, kerosene, etc.
- 14.1%Bottled, tank, or LP gas
- 7.8%Electricity
- 4.7%Wood
- 3.1%Utility gas
Private vs. public school enrollment:
| Here: | 5.3% |
| Massachusetts: | 10.8% |
| Here: | 14.7% |
| Massachusetts: | 12.2% |
| Here: | 23.5% |
| Massachusetts: | 48.2% |


