Ridge Spring, SC (South Carolina) Houses and Residents
| Ridge Spring: | $80,431 |
| South Carolina: | $254,600 |
Mean price in 2022:
Detached houses: $162,080
Here: $162,080 State: $368,255 Mobile homes: $39,781
Here: $39,781 State: $102,531
Total population: 743 (Urban population: 0, Rural population: 831 (32 farm, 799 nonfarm))
Houses: 390 (338 occupied: 260 owner occupied, 84 renter occupied)
| % of renters here: | 24% |
| State: | 28% |
Housing density: 213 houses/condos per square mile
Median price asked for vacant for-sale houses and condos in 2022 in this county: $165,792.
Median contract rent in 2022: $488 (lower quartile is $355, upper quartile is $564)
Median rent asked for vacant for-rent units in 2022: $486
Median gross rent in Ridge Spring, SC in 2022: $646
Housing units in Ridge Spring with a mortgage: 71 (6 second mortgage, 0 home equity loan, 0 both second mortgage and home equity loan)
Houses without a mortgage: 0
Median household income for houses/condos with a mortgage: $36,597
Median monthly housing costs: $572
Compare current foreclosures near Ridge Spring, SC:
| Photo | Address | Area | Beds / Baths | Price | Details |
|---|---|---|---|---|---|

|
#1
Bomar St
Ridge Spring, SC 29129
|
1,188 sq. feet
|
2 baths - beds |
show details | |

|
#2
Dubose St
Ridge Spring, SC 29129
|
1,584 sq. feet
|
1 baths - beds |
show details | |

|
#3
Columbia Hwy N
Ridge Spring, SC 29129
|
- sq. feet
|
- baths - beds |
show details | |

|
#4
Greenview Dr
Ridge Spring, SC 29129
|
- sq. feet
|
- baths - beds |
show details | |

|
#5
Bogeyville Rd
Ridge Spring, SC 29129
|
- sq. feet
|
- baths - beds |
show details | |

|
#6
Dry Gulch Rd
Saluda, SC 29138
|
1,568 sq. feet
|
3 baths 3 beds |
show details | |

|
#7
Ben Franklin Rd
Leesville, SC 29070
|
- sq. feet
|
2 baths 4 beds |
show details | |

|
#8
Pond Branch Rd
Leesville, SC 29070
|
1,344 sq. feet
|
1 baths 3 beds |
show details | |

|
#9
S Fair Ave
Batesburg, SC 29006
|
1,020 sq. feet
|
1 baths 3 beds |
show details | |

|
#10
Juniper Springs Rd
Gilbert, SC 29054
|
1,764 sq. feet
|
2 baths 3 beds |
show details |
| Photo | Address | Area | Beds / Baths | Price | Details |
|---|---|---|---|---|---|

|
#11
Caney Branch Rd
Leesville, SC 29070
|
2,037 sq. feet
|
2 baths 3 beds |
show details | |

|
#12
Livingston Ln
Leesville, SC 29070
|
1,457 sq. feet
|
2 baths 3 beds |
show details | |

|
#13
S Bethlehem Rd
Batesburg, SC 29006
|
1,346 sq. feet
|
2 baths 3 beds |
show details | |

|
#14
Cooks Bridge Rd
Aiken, SC 29805
|
1,352 sq. feet
|
1 baths - beds |
show details | |

|
#15
Johnston Hwy
Saluda, SC 29138
|
1,132 sq. feet
|
1 baths - beds |
show details | |

|
#16
Old Friar Rd
Aiken, SC 29801
|
1,694 sq. feet
|
2 baths - beds |
show details | |

|
#17
Old Camp Long Rd
Aiken, SC 29805
|
1,132 sq. feet
|
1 baths - beds |
show details | |

|
#18
Logan St
Saluda, SC 29138
|
1,036 sq. feet
|
1 baths - beds |
show details | |

|
#19
Pipeline Rd
Aiken, SC 29801
|
1,410 sq. feet
|
1 baths - beds |
show details | |

|
#20
Shop Rd
Ward, SC 29166
|
1,118 sq. feet
|
1 baths - beds |
show details |
| Photo | Address | Area | Beds / Baths | Price | Details |
|---|---|---|---|---|---|

|
#21
Morris Rd
Aiken, SC 29805
|
1,280 sq. feet
|
1 baths - beds |
show details | |

|
#22
Hideaway Ln
Saluda, SC 29138
|
- sq. feet
|
- baths - beds |
show details | |

|
#23
Mile Bridge Way
Johnston, SC 29832
|
- sq. feet
|
- baths - beds |
show details | |

|
#24
Broad St
Leesville, SC 29070
|
1,248 sq. feet
|
- baths - beds |
show details | |

|
#25
Bush Clover Way
Leesville, SC 29070
|
- sq. feet
|
- baths - beds |
show details | |

|
#26
Old Friar Rd
Aiken, SC 29801
|
1,024 sq. feet
|
- baths - beds |
show details | |

|
#27
Perry Taylor Rd
Leesville, SC 29070
|
- sq. feet
|
- baths - beds |
show details | |

|
#28
John J Rushton Rd
Saluda, SC 29138
|
- sq. feet
|
- baths - beds |
show details | |

|
#29
Timmerman St
Edgefield, SC 29824
|
- sq. feet
|
- baths - beds |
show details | |

|
#30
Mims St
Edgefield, SC 29824
|
- sq. feet
|
- baths - beds |
show details |
| Photo | Address | Area | Beds / Baths | Price | Details |
|---|---|---|---|---|---|

|
#31
Old Shoals Rd
Monetta, SC 29105
|
- sq. feet
|
- baths - beds |
show details | |

|
#32
Us Highway 25 N
Edgefield, SC 29824
|
- sq. feet
|
- baths - beds |
show details | |

|
#33
Pipeline Rd
Aiken, SC 29801
|
- sq. feet
|
- baths - beds |
show details | |

|
#34
Old Ln
Monetta, SC 29105
|
1,440 sq. feet
|
- baths - beds |
show details | |

|
#35
Old Gassaway Rd
Saluda, SC 29138
|
1,620 sq. feet
|
- baths - beds |
show details | |

|
#36
Holloway Rd
Saluda, SC 29138
|
- sq. feet
|
- baths - beds |
show details | |

|
#37
Vintage Vale Rd
Aiken, SC 29805
|
- sq. feet
|
- baths - beds |
show details | |

|
#38
Fairview Rd # D-12
Leesville, SC 29070
|
- sq. feet
|
- baths - beds |
show details | |

|
#39
Mine Creek Rd
Saluda, SC 29138
|
2,128 sq. feet
|
- baths - beds |
show details | |

|
#40
Pencreek Rd
Saluda, SC 29138
|
- sq. feet
|
- baths - beds |
show details |
| Photo | Address | Area | Beds / Baths | Price | Details |
|---|---|---|---|---|---|

|
#41
Rawls Dr
Leesville, SC 29070
|
- sq. feet
|
- baths - beds |
show details | |

|
#42
Medea Ln
Trenton, SC 29847
|
- sq. feet
|
- baths - beds |
show details | |

|
#43
Seminole Dr
Saluda, SC 29138
|
- sq. feet
|
- baths - beds |
show details | |

|
#44
Duncan Rd
Batesburg, SC 29006
|
- sq. feet
|
- baths - beds |
show details | |

|
#45
Gwen Rd
Saluda, SC 29138
|
- sq. feet
|
- baths - beds |
show details | |

|
#46
Bonham Rd
Saluda, SC 29138
|
- sq. feet
|
- baths - beds |
show details | |

|
#47
Nautilus St
Aiken, SC 29805
|
- sq. feet
|
- baths - beds |
show details | |

|
#48
Derrick Park Rd
Leesville, SC 29070
|
- sq. feet
|
- baths - beds |
show details | |

|
#49
Drydock Cir
Saluda, SC 29138
|
- sq. feet
|
- baths - beds |
show details | |

|
Check over 1 million property listings on Foreclosure.com!
|
browse all offers | |||


Median year apartment built: 1982
Household type by relationship:
Households: 739- Male householders: 109 (29 living alone), Female householders: 225 (135 living alone)
74 spouses (74 opposite-sex spouses), 5 unmarried partners, (5 opposite-sex unmarried partners), 169 children (158 natural, 0 adopted, 11 stepchildren), 33 grandchildren, 2 brothers or sisters, 0 parents, 0 foster children, 96 other relatives, 21 non-relatives
Size of family households: 84 2-persons, 49 3-persons, 16 4-persons, 15 5-persons, 2 6-persons.
Size of nonfamily households: 168 1-person, 2 2-persons, 5 3-persons.
38 married couples with children.
43 single-parent households (31 men, 12 women).
95.9% of residents of Ridge Spring speak English at home.
4.6% of residents speak Spanish at home (73% speak English very well, 18% speak English well, 9% speak English not well).
Foreign born population: 21 (2.8%)
(0.0% of them are naturalized citizens)
| Here: | 6.0 |
| State: | 6.4 |
| Here: | 4.7 |
| State: | 4.5 |

- Bedrooms in owner-occupied houses and condos in Ridge Spring, South Carolina
- 0no bedroom
- 21 bedroom
- 332 bedrooms
- 1903 bedrooms
- 334 bedrooms
- 35+ bedrooms

- Bedrooms in renter-occupied apartments in Ridge Spring, South Carolina
- 0no bedroom
- 31 bedroom
- 352 bedrooms
- 373 bedrooms
- 74 bedrooms
- 25+ bedrooms

- Cars and other vehicles available in Ridge Spring in owner-occupied houses/condos
- 14no vehicle
- 551 vehicle
- 1132 vehicles
- 403 vehicles
- 84 vehicles
- 315+ vehicles

- Cars and other vehicles available in Ridge Spring in renter-occupied apartments
- 18no vehicle
- 321 vehicle
- 112 vehicles
- 143 vehicles
- 114 vehicles
- 05+ vehicles

- Rooms in owner-occupied houses in Ridge Spring, South Carolina
- 01 room
- 02 rooms
- 03 rooms
- 44 rooms
- 505 rooms
- 1396 rooms
- 327 rooms
- 118 rooms
- 259+ rooms

- Rooms in renter-occupied apartments in Ridge Spring, South Carolina
- 01 room
- 02 rooms
- 23 rooms
- 364 rooms
- 255 rooms
- 116 rooms
- 07 rooms
- 28 rooms
- 89+ rooms


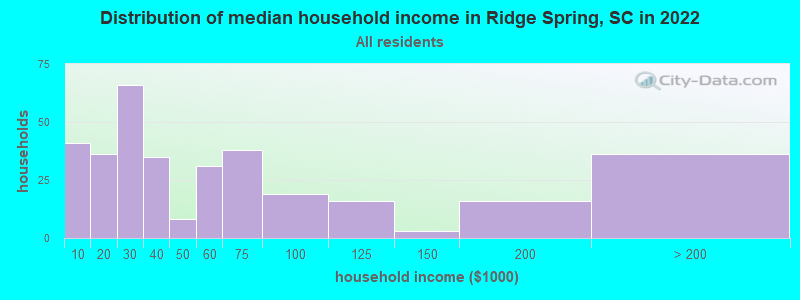
Ridge Spring, SC household income distribution

- 41Less than $10,000
- 36$10,000 to $19,999
- 66$20,000 to $29,999
- 35$30,000 to $39,999
- 8$40,000 to $49,999
- 31$50,000 to $59,999
- 38$60,000 to $74,999
- 19$75,000 to $99,999
- 16$100,000 to $124,999
- 3$125,000 to $149,999
- 16$150,000 to $199,999
- 36$200,000 or more
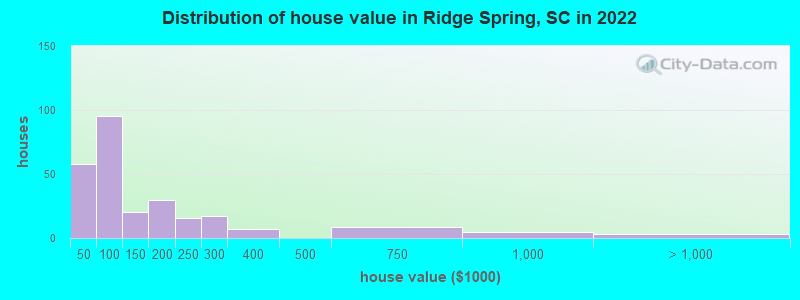
Home value of owner - occupied houses in 2022 in Ridge Spring, SC
-
- 4Less than $10,000
- 2$10,000 to $14,999
- 3$15,000 to $19,999
- 1$25,000 to $29,999
- 7$30,000 to $34,999
- 22$35,000 to $39,999
- 17$40,000 to $49,999
- 35$50,000 to $59,999
- 28$60,000 to $69,999
- 8$70,000 to $79,999
- 5$80,000 to $89,999
- 12$100,000 to $124,999
- 7$125,000 to $149,999
- 24$150,000 to $174,999
- 5$175,000 to $199,999
- 15$200,000 to $249,999
- 17$250,000 to $299,999
- 6$300,000 to $399,999
- 8$500,000 to $749,999
- 4$750,000 to $999,999
- 2$1,500,000 to $1,999,999
Rent paid by renters in 2022 in Ridge Spring, SC
-
- 6Less than $100
- 3$100 to $149
- 0$250 to $299
- 4$300 to $349
- 4$350 to $399
- 6$400 to $449
- 10$450 to $499
- 10$500 to $549
- 4$550 to $599
- 6$800 to $899
- 13No cash rent


Percentage of workers working in this county: 32.1%
Number of people working at home: 29 (8.5% of all workers)
Travel time to work (commute)
- Less than 5 minutes: 12
- 5 to 9 minutes: 4
- 10 to 14 minutes: 31
- 15 to 19 minutes: 3
- 20 to 24 minutes: 35
- 25 to 29 minutes: 10
- 30 to 34 minutes: 32
- 35 to 39 minutes: 61
- 40 to 44 minutes: 12
- 45 to 59 minutes: 72
- 60 to 89 minutes: 28
- 90 or more minutes: 2
Means of transportation to work:
- Drove a car alone: 213 (73.7%)
- Carpooled: 57 (19.7%)
- Bus or trolley bus: 9 (3.1%)
- Bicycle: 2 (0.7%)
- Walked: 6 (2.1%)
- Worked at home: 2 (0.7%)

- Unemployment by race in 2022
- Unemployment rate for Black residents
- 5.8%Females

- Year of entry for the foreign-born population in Ridge Spring, South Carolina
- 102010 or later
- 132000 to 2009
- 01990 to 1999
- 01980 to 1989
- 11970 to 1979
- 0Before 1970

First ancestries reported:
- American: 55 (11.2%)
- English: 24 (4.9%)
- German: 10 (2.0%)
- Irish: 7 (1.4%)
- Scottish: 6 (1.2%)
Most common places of birth for foreign-born residents (%):
| Ridge Spring: | 90.5% (19) |
| South Carolina: | 22.5% (60,774) |
Place of birth for U.S.-born residents:
- This state: 459
- Other state: 254
- Northeast: 53
- Midwest: 20
- South: 167
- West: 10
94.9% of Ridge Spring residents lived in the same house 1 years ago.
Out of people who lived in different houses, 0.0% lived in this county.
Out of people who lived in different counties, 61.5% lived in South Carolina.
| Ridge Spring: | 94.9% |
| State average: | 86.5% |
Education attainment for males 25 years and older:
- No schooling: 1
- Nursery to 4th grade: 4
- 5th and 6th grade: 0
- 7th and 8th grade: 7
- 9th grade: 0
- 10th grade: 5
- 11th grade: 7
- 12th grade, no diploma: 7
- High school graduate (or equivalency): 105
- Less than 1 year of college: 2
- Some college more than 1 year, no degree: 43
- Associate degree: 6
- Bachelor's degree: 20
- Master's degree: 10
- Professional school degree: 0
- Doctorate degree: 0

Education attainment for females 25 years and older:
- No schooling: 14
- Nursery to 4th grade: 0
- 5th and 6th grade: 0
- 7th and 8th grade: 2
- 9th grade: 2
- 10th grade: 3
- 11th grade: 12
- 12th grade, no diploma: 7
- High school graduate (or equivalency): 90
- Less than 1 year of college: 3
- Some college more than 1 year, no degree: 29
- Associate degree: 16
- Bachelor's degree: 94
- Master's degree: 70
- Professional school degree: 0
- Doctorate degree: 3


Housing units in structures:
- One, detached: 333
- One, attached: 2
- Two: 20
- 3 or 4: 9
- 5 to 9: 12
- Mobile homes: 12
Housing units lacking complete kitchen facilities in 2022: 1.3%
House/condo owner moved in on average 31 years ago
Renter moved in on average 5 years ago

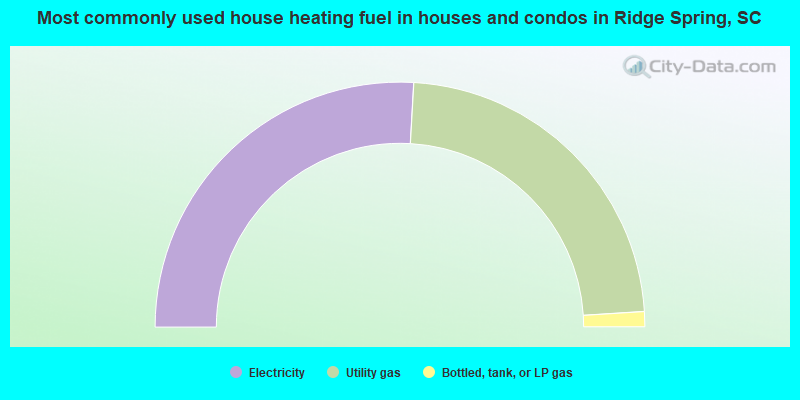
- 51.8%Electricity
- 46.2%Utility gas
- 2.0%Bottled, tank, or LP gas
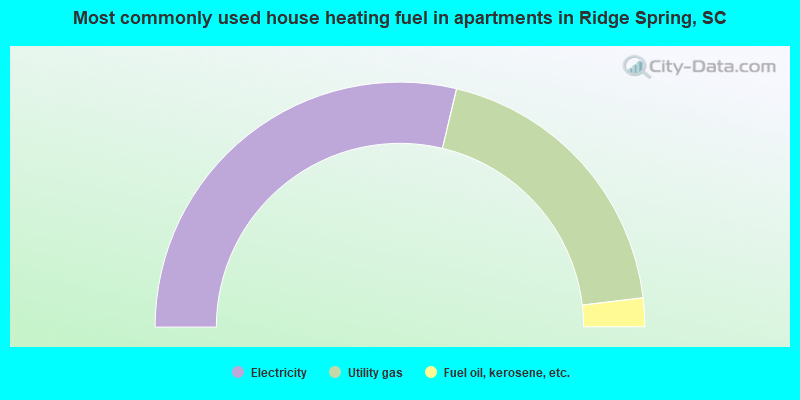
- 57.5%Electricity
- 38.8%Utility gas
- 3.8%Fuel oil, kerosene, etc.
Private vs. public school enrollment:
| Here: | 0.0% |
| South Carolina: | 14.4% |
| Here: | 5.9% |
| South Carolina: | 11.1% |
| Here: | 0.0% |
| South Carolina: | 21.9% |


