Jump to a detailed profile or search site with Google Custom Search

Ridgecrest, CA (California) Houses and Residents

Estimated median house or condo value in 2022: $262,086 (it was $68,500 in 2000)
Ridgecrest:

$262,086
California:

$715,900
Lower value quartile - upper value quartile: $175,760 - $329,408

Total population: 28,726 (Urban population: 24,133 (all inside urban clusters), Rural population: 1,062 (all nonfarm))

Houses: 12,368 (11,310 occupied: 6,819 owner occupied, 4,565 renter occupied)

% of renters here:

40%
State:

44%

Housing density: 585 houses/condos per square mile

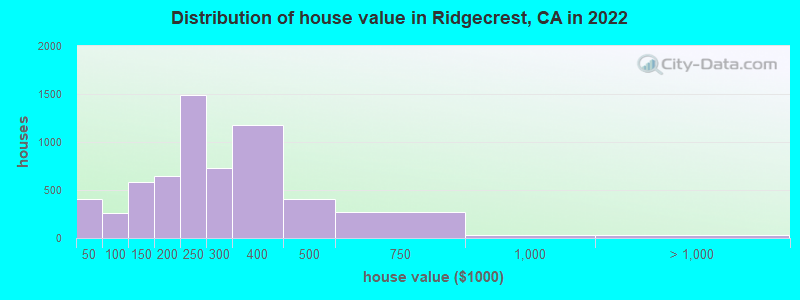
Median price asked for vacant for-sale houses and condos in 2022: $224,292.

Median contract rent in 2022: $949 (lower quartile is $767, upper quartile is $1,400)


Median rent asked for vacant for-rent units in 2022: $893


Median gross rent in Ridgecrest, CA in 2022: $1,178

Housing units in Ridgecrest with a mortgage: 4,455 (191 second mortgage, 41 home equity loan, 161 both second mortgage and home equity loan)
Houses without a mortgage: 80

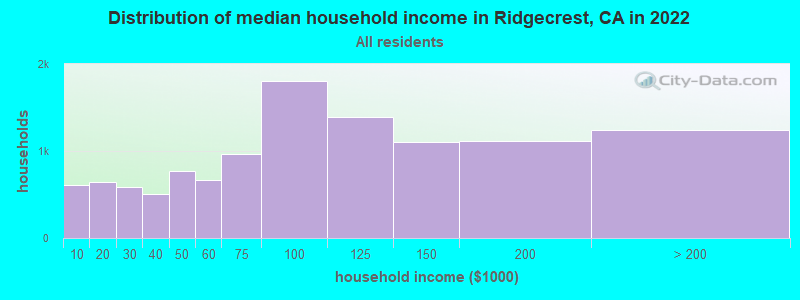
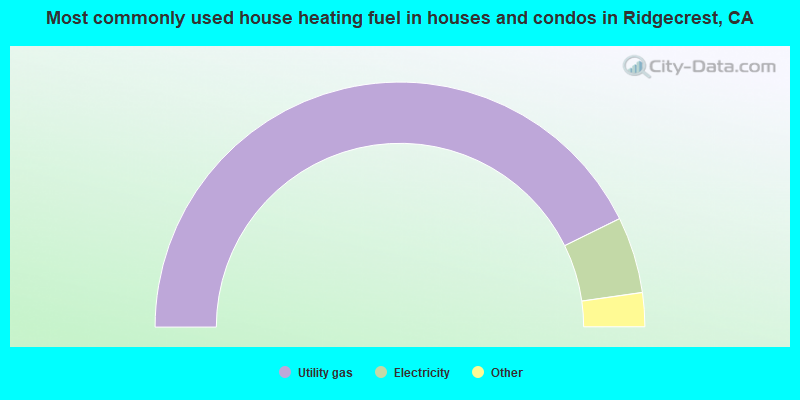
Median household income for houses/condos with a mortgage: $104,748

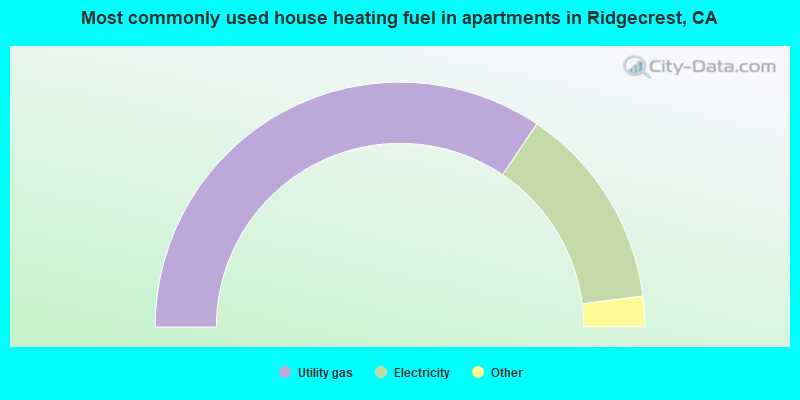
Median household income for apartments without a mortgage: $95,696

Median monthly housing costs: $1,164

Compare current foreclosures near Ridgecrest, CA:

Check out more offers near Ridgecrest, CA.
Powered by Foreclosure.com

Settings
X
Data:
Loading data...
Based on 2000-2022 data
Loading data...

123
Hide US histogram

Latest news about housing in Ridgecrest, CA collected exclusively by city-data.com from local newspapers, TV, and radio stations

Ridgecrest, California Age and Sex of Residents
Median year house/condo built: 1982

Median year apartment built: 1984

Household type by relationship:

Households: 28,404
  • Male householders: 6,275 (1,945 living alone), Female householders: 4,982 (1,676 living alone)
  • 4,935 spouses (4,935 opposite-sex spouses), 746 unmarried partners, (746 opposite-sex unmarried partners), 9,111 children (8,035 natural, 188 adopted, 886 stepchildren), 402 grandchildren, 194 brothers or sisters, 224 parents, 130 foster children, 243 other relatives, 932 non-relatives
  • In group quarters: 225

Size of family households: 2,594 2-persons, 2,094 3-persons, 984 4-persons, 601 5-persons, 248 6-persons, 252 7-or-more-persons.

Size of nonfamily households: 3,627 1-person, 718 2-persons, 176 3-persons, 71 4-persons.

5,065 married couples with children.
1,638 single-parent households (482 men, 1,156 women).

83.2% of residents of Ridgecrest speak English at home.
12.0% of residents speak Spanish at home (75% speak English very well, 12% speak English well, 12% speak English not well, 1% don't speak English at all).
0.7% of residents speak other Indo-European language at home (63% speak English very well, 18% speak English well, 20% speak English not well).
2.3% of residents speak Asian or Pacific Island language at home (53% speak English very well, 32% speak English well, 14% speak English not well, 2% don't speak English at all).
0.6% of residents speak other language at home (100% speak English very well).

Foreign born population: 1,929 (6.8%)
(56.7% of them are naturalized citizens)

Median number of rooms in houses and condos:
Here:

5.9
State:

6.0

Median number of rooms in apartments
Here:

4.6
State:

3.9

Owner-occupied Renter-occupied
Bedrooms in owner-occupied houses and condos in Ridgecrest, California
  • Bedrooms in owner-occupied houses and condos in Ridgecrest, California
  • 8no bedroom
  • 1231 bedroom
  • 8532 bedrooms
  • 4,0363 bedrooms
  • 1,7384 bedrooms
  • 625+ bedrooms
Bedrooms in renter-occupied apartments in Ridgecrest, California
  • Bedrooms in renter-occupied apartments in Ridgecrest, California
  • 115no bedroom
  • 4551 bedroom
  • 1,6102 bedrooms
  • 1,8343 bedrooms
  • 4994 bedrooms
  • 535+ bedrooms
Owner-occupied Renter-occupied
Cars and other vehicles available in Ridgecrest in owner-occupied houses/condos
  • Cars and other vehicles available in Ridgecrest in owner-occupied houses/condos
  • 213no vehicle
  • 1,9971 vehicle
  • 2,9362 vehicles
  • 1,1393 vehicles
  • 3964 vehicles
  • 1385+ vehicles
Cars and other vehicles available in Ridgecrest in renter-occupied apartments
  • Cars and other vehicles available in Ridgecrest in renter-occupied apartments
  • 638no vehicle
  • 1,9721 vehicle
  • 1,3762 vehicles
  • 4573 vehicles
  • 1044 vehicles
  • 195+ vehicles
Owner-occupied Renter-occupied
Rooms in owner-occupied houses in Ridgecrest, California
  • Rooms in owner-occupied houses in Ridgecrest, California
  • 81 room
  • 562 rooms
  • 1633 rooms
  • 5834 rooms
  • 1,9735 rooms
  • 1,8306 rooms
  • 1,2297 rooms
  • 5368 rooms
  • 4409+ rooms
Rooms in renter-occupied apartments in Ridgecrest, California
  • Rooms in renter-occupied apartments in Ridgecrest, California
  • 1061 room
  • 1122 rooms
  • 4183 rooms
  • 1,4604 rooms
  • 1,2595 rooms
  • 7006 rooms
  • 3347 rooms
  • 1158 rooms
  • 619+ rooms
Year house built
Median 2022 house/condo value by year built
Median house/condo value by year householder moved into unit
Breakdown of mean house values by ages of householders
Owners and renters by unit type in Ridgecrest, CA
  • Ridgecrest, CA household income distribution

  • Distribution of median household income in Ridgecrest, CA in 2022
  • 611Less than $10,000
  • 649$10,000 to $19,999
  • 590$20,000 to $29,999
  • 504$30,000 to $39,999
  • 768$40,000 to $49,999
  • 666$50,000 to $59,999
  • 969$60,000 to $74,999
  • 1,800$75,000 to $99,999
  • 1,392$100,000 to $124,999
  • 1,109$125,000 to $149,999
  • 1,112$150,000 to $199,999
  • 1,241$200,000 or more
  • Home value of owner - occupied houses in 2022 in Ridgecrest, CA

  • Distribution of house value in Ridgecrest, CA in 2022
  • 175Less than $10,000
  • 45$10,000 to $14,999
  • 49$15,000 to $19,999
  • 63$20,000 to $24,999
  • 34$25,000 to $29,999
  • 9$35,000 to $39,999
  • 25$40,000 to $49,999
  • 51$50,000 to $59,999
  • 47$60,000 to $69,999
  • 62$70,000 to $79,999
  • 39$80,000 to $89,999
  • 33$90,000 to $99,999
  • 387$100,000 to $124,999
  • 201$125,000 to $149,999
  • 354$150,000 to $174,999
  • 292$175,000 to $199,999
  • 1,488$200,000 to $249,999
  • 731$250,000 to $299,999
  • 1,178$300,000 to $399,999
  • 406$400,000 to $499,999
  • 268$500,000 to $749,999
  • 34$750,000 to $999,999
  • 29$1,000,000 to $1,499,999
  • Rent paid by renters in 2022 in Ridgecrest, CA

  • Distribution of rent paid by renters in Ridgecrest, CA in 2022
  • 6$100 to $149
  • 28$200 to $249
  • 68$350 to $399
  • 51$400 to $449
  • 47$450 to $499
  • 201$500 to $549
  • 156$550 to $599
  • 154$600 to $649
  • 96$650 to $699
  • 126$700 to $749
  • 442$750 to $799
  • 487$800 to $899
  • 323$900 to $999
  • 550$1,000 to $1,249
  • 613$1,250 to $1,499
  • 589$1,500 to $1,999
  • 110$2,000 to $2,499
  • 26$2,500 to $2,999
  • 42$3,500 or more
  • 290No cash rent
Time Leaving Home To Go To Work in 2022

Percentage of workers working in this county: 95.9%
Number of people working at home: 1,211 (9.5% of all workers)

Travel time (in minutes) to work in 2022

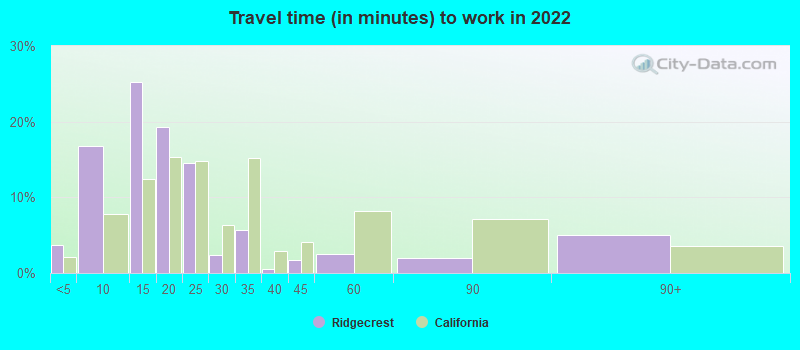
Travel time to work (commute)

  • Less than 5 minutes: 678
  • 5 to 9 minutes: 2,391
  • 10 to 14 minutes: 3,327
  • 15 to 19 minutes: 2,169
  • 20 to 24 minutes: 1,132
  • 25 to 29 minutes: 122
  • 30 to 34 minutes: 718
  • 35 to 39 minutes: 64
  • 40 to 44 minutes: 90
  • 45 to 59 minutes: 156
  • 60 to 89 minutes: 220
  • 90 or more minutes: 241
Means of transportation to work in 2022 - Ridgecrest

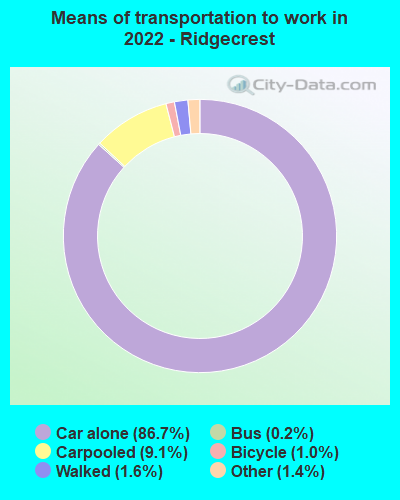
Means of transportation to work:

  • Drove a car alone: 12,795 (80.1%)
  • Carpooled: 1,337 (8.4%)
  • Bus: 11 (0.1%)
  • Taxi: 271 (1.7%)
  • Bicycle: 90 (0.6%)
  • Walked: 267 (1.7%)
  • Worked at home: 1,211 (7.6%)
Class of Workers in 2022
  • Unemployment by race in 2022
  • Unemployment rate for White non-Hispanic residents
  • 7.7%Males
  • 4.5%Females
  • Unemployment rate for American Indian and Alaska Native residents
  • 37.4%Males
  • 28.9%Females
  • Unemployment rate for Asian residents
  • 6.1%Males
  • Unemployment rate for other race residents
  • 7.9%Males
  • 34.6%Females
  • Unemployment rate for two or more race residents
  • 3.0%Males
  • 7.8%Females
  • Unemployment rate for Hispanic or Latino residents
  • 4.7%Males
  • 14.3%Females
Year of entry for the foreign-born population in Ridgecrest, California
  • Year of entry for the foreign-born population in Ridgecrest, California
  • 6482010 or later
  • 3672000 to 2009
  • 2061990 to 1999
  • 6271980 to 1989
  • 2861970 to 1979
  • 253Before 1970
Ancestries in Ridgecrest, CA

First ancestries reported:

  • German: 1,226 (9.2%)
  • Irish: 1,003 (7.5%)
  • English: 875 (6.6%)
  • American: 810 (6.1%)
  • European: 785 (5.9%)
  • Italian: 446 (3.3%)
  • Swedish: 248 (1.9%)
  • Canadian: 231 (1.7%)
  • Scottish: 211 (1.6%)
  • Polish: 181 (1.4%)
  • Egyptian: 87 (0.7%)
  • French: 83 (0.6%)
  • Norwegian: 72 (0.5%)
  • Scotch-Irish: 69 (0.5%)
  • Danish: 68 (0.5%)
  • Northern European: 66 (0.5%)
  • Romanian: 54 (0.4%)
  • Dutch: 48 (0.4%)
  • Jamaican: 38 (0.3%)
  • British: 37 (0.3%)
  • French Canadian: 32 (0.2%)
  • Iranian: 24 (0.2%)
  • Lebanese: 21 (0.2%)
  • Welsh: 18 (0.1%)
  • Celtic: 15 (0.1%)
  • Austrian: 15 (0.1%)
  • Bulgarian: 12 (0.09%)
  • Greek: 12 (0.09%)
  • Eastern European: 11 (0.08%)
  • Swiss: 11 (0.08%)
  • Scandinavian: 10 (0.07%)
  • Australian: 9 (0.07%)
  • Hungarian: 8 (0.06%)
  • Russian: 7 (0.05%)

Most common places of birth for foreign-born residents (%):

Mexico
Ridgecrest:

33.1% (652)
California:

37.2% (3,881,193)

Canada
Ridgecrest:

19.3% (380)
California:

1.2% (127,477)

Philippines
Ridgecrest:

12.1% (238)
California:

7.8% (818,297)

Australia
Ridgecrest:

4.4% (87)
California:

0.2% (23,338)

Egypt
Ridgecrest:

3.4% (67)
California:

0.4% (42,718)

Vietnam
Ridgecrest:

3.2% (63)
California:

4.9% (512,335)

China, excluding Hong Kong and Taiwan
Ridgecrest:

3.1% (62)
California:

6.6% (684,672)

Hong Kong
Ridgecrest:

2.9% (58)
California:

1.0% (105,215)

India
Ridgecrest:

2.4% (48)
California:

5.2% (539,184)

Bangladesh
Ridgecrest:

2.2% (43)
California:

0.2% (18,366)

Colombia
Ridgecrest:

2.0% (40)
California:

0.5% (55,249)

Thailand
Ridgecrest:

2.0% (39)
California:

0.6% (65,335)

Guatemala
Ridgecrest:

1.6% (31)
California:

2.8% (290,436)

Place of birth for U.S.-born residents:

  • This state: 18,313
  • Other state: 7,527
  • Northeast: 1,275
  • Midwest: 1,522
  • South: 1,932
  • West: 3,012

87.0% of Ridgecrest residents lived in the same house 1 years ago.
   Out of people who lived in different houses, 41.9% lived in this county.
   Out of people who lived in different counties, 62.1% lived in California.


Ridgecrest:

87.0%
State average:

88.9%

Education attainment for males 25 years and older:

  • No schooling: 68
  • Nursery to 4th grade: 0
  • 5th and 6th grade: 76
  • 7th and 8th grade: 5
  • 9th grade: 48
  • 10th grade: 61
  • 11th grade: 71
  • 12th grade, no diploma: 321
  • High school graduate (or equivalency): 2,116
  • Less than 1 year of college: 609
  • Some college more than 1 year, no degree: 1,568
  • Associate degree: 1,191
  • Bachelor's degree: 2,165
  • Master's degree: 1,016
  • Professional school degree: 26
  • Doctorate degree: 117
Educational Attainment for Males

Education attainment for females 25 years and older:

  • No schooling: 250
  • Nursery to 4th grade: 27
  • 5th and 6th grade: 36
  • 7th and 8th grade: 17
  • 9th grade: 70
  • 10th grade: 109
  • 11th grade: 85
  • 12th grade, no diploma: 291
  • High school graduate (or equivalency): 1,768
  • Less than 1 year of college: 584
  • Some college more than 1 year, no degree: 1,471
  • Associate degree: 1,433
  • Bachelor's degree: 2,223
  • Master's degree: 941
  • Professional school degree: 44
  • Doctorate degree: 50
Educational Attainment for Females
Ridgecrest marital status for males
Ridgecrest marital status for females

Housing units in structures:

  • One, detached: 8,368
  • One, attached: 528
  • Two: 872
  • 3 or 4: 804
  • 5 to 9: 406
  • 10 to 19: 53
  • 20 to 49: 233
  • 50 or more: 66
  • Mobile homes: 964
  • Boats, RVs, vans, etc.: 68
Housing units lacking complete plumbing facilities in 2022: 2.2%

Housing units lacking complete kitchen facilities in 2022: 4.8%

House/condo owner moved in on average 12 years ago

Renter moved in on average 1 years ago

Year householders moved into residence in Ridgecrest
Houses and condos Apartments
Most commonly used house heating fuel in houses and condos in Ridgecrest, CA
  • 85.5%Utility gas
  • 10.1%Electricity
  • 2.8%Bottled, tank, or LP gas
  • 1.2%Wood
  • 0.4%Solar energy
Most commonly used house heating fuel in apartments in Ridgecrest, CA
  • 68.9%Utility gas
  • 27.1%Electricity
  • 3.0%Bottled, tank, or LP gas
  • 0.7%No fuel used
  • 0.3%Wood

Private vs. public school enrollment:

Students in private schools in grades 1 to 8 (elementary and middle school): 564
Here:

15.3%
California:

10.5%

Students in private schools in grades 9 to 12 (high school): 94
Here:

6.1%
California:

8.5%

Students in private undergraduate colleges: 122
Here:

10.1%
California:

15.9%
School Enrollment by Level of School for Male Students
School Enrollment by Level of School for Female Students
Age and Sex of Sensory-Disabled Noninstitutionalized Residents
Age and Sex of Physically-Disabled Noninstitutionalized Residents
Age and Sex of Mentally-Disabled Noninstitutionalized Residents
Age and Sex of Self-Care Disabled Noninstitutionalized Residents
Age and Sex of Go-Outside-Home Disabled Noninstitutionalized Residents
Age and Sex of Noninstitutionalized Residents with Employment Disability