Ridgway, PA (Pennsylvania) Houses and Residents
| Ridgway: | $91,276 |
| Pennsylvania: | $245,500 |
Total population: 3,951 (All urban)
Houses: 1,815 (1,703 occupied: 1,170 owner occupied, 548 renter occupied)
| % of renters here: | 32% |
| State: | 31% |
Housing density: 681 houses/condos per square mile
Median price asked for vacant for-sale houses and condos in 2022: $128,943.
Median contract rent in 2022: $511 (lower quartile is $363, upper quartile is $667)
Median rent asked for vacant for-rent units in 2022: $545
Median gross rent in Ridgway, PA in 2022: $641
Housing units in Ridgway with a mortgage: 563 (30 second mortgage, 0 home equity loan, 30 both second mortgage and home equity loan)
Houses without a mortgage: 21
Median household income for houses/condos with a mortgage: $95,883
Median household income for apartments without a mortgage: $50,559
Median monthly housing costs: $668
Compare current foreclosures near Ridgway, PA:
| Photo | Address | Area | Beds / Baths | Price | Details |
|---|---|---|---|---|---|

|
#1
1/2 Monroe Ave
Ridgway, PA 15853
|
- sq. feet
|
- baths - beds |
show details | |

|
#2
Chestnut Ave
Ridgway, PA 15853
|
- sq. feet
|
- baths - beds |
show details | |

|
#3
Portland Mills Rd
Ridgway, PA 15853
|
- sq. feet
|
- baths - beds |
show details | |

|
#4
Pine Ave
Kane, PA 16735
|
2,718 sq. feet
|
2 baths 3 beds |
show details | |

|
#5
2nd Ave
Johnsonburg, PA 15845
|
- sq. feet
|
- baths - beds |
$1
|
show details |

|
#6
State Rd
Johnsonburg, PA 15845
|
- sq. feet
|
1 baths 3 beds |
show details | |

|
#7
Johnsonburg Rd
Saint Marys, PA 15857
|
- sq. feet
|
- baths - beds |
$1
|
show details |

|
#8
Spruce St
Saint Marys, PA 15857
|
- sq. feet
|
- baths - beds |
$1
|
show details |

|
#9
Queens Rd
Saint Marys, PA 15857
|
- sq. feet
|
- baths - beds |
$1
|
show details |

|
#10
Pine Ave
Kane, PA 16735
|
1,822 sq. feet
|
- baths - beds |
show details |
| Photo | Address | Area | Beds / Baths | Price | Details |
|---|---|---|---|---|---|

|
#11
Pond Rd
Kane, PA 16735
|
1,092 sq. feet
|
- baths - beds |
show details | |

|
#12
Maryland Ave
James City, PA 16734
|
- sq. feet
|
- baths - beds |
show details | |

|
#13
Hounddog Dr
Brockway, PA 15824
|
- sq. feet
|
- baths - beds |
show details | |

|
#14
Main St
Brockway, PA 15824
|
- sq. feet
|
- baths - beds |
show details | |

|
#15
Sonny Dr
Saint Marys, PA 15857
|
- sq. feet
|
- baths - beds |
show details | |

|
#16
Bayard St
Kane, PA 16735
|
1,373 sq. feet
|
- baths - beds |
show details | |

|
#17
Krise Rd
Kersey, PA 15846
|
- sq. feet
|
- baths - beds |
show details | |

|
#18
Bayberry Rd
Saint Marys, PA 15857
|
- sq. feet
|
- baths - beds |
show details | |

|
#19
Queens Rd
Saint Marys, PA 15857
|
- sq. feet
|
- baths - beds |
show details | |

|
#20
Hemlock Rd
Saint Marys, PA 15857
|
- sq. feet
|
- baths - beds |
show details |
| Photo | Address | Area | Beds / Baths | Price | Details |
|---|---|---|---|---|---|

|
#21
Windfall Rd
Saint Marys, PA 15857
|
- sq. feet
|
- baths - beds |
show details | |

|
#22
Averyville Rd
Saint Marys, PA 15857
|
- sq. feet
|
- baths - beds |
show details | |

|
#23
Ogrin Rd
Kane, PA 16735
|
- sq. feet
|
- baths - beds |
show details | |

|
#24
Plymouth Rd
Saint Marys, PA 15857
|
- sq. feet
|
- baths - beds |
show details | |

|
#25
Durhing Rd
Kane, PA 16735
|
- sq. feet
|
- baths - beds |
show details | |

|
#26
Park St
Saint Marys, PA 15857
|
- sq. feet
|
- baths - beds |
show details | |

|
#27
Chestnut St
Saint Marys, PA 15857
|
- sq. feet
|
- baths - beds |
show details | |

|
#28
Lynch Rd
Saint Marys, PA 15857
|
- sq. feet
|
- baths - beds |
show details | |

|
#29
Bennetts Valley Hwy
Weedville, PA 15868
|
- sq. feet
|
- baths - beds |
show details | |

|
#30
Ridgway Johnsonburg Rd
Johnsonburg, PA 15845
|
- sq. feet
|
- baths - beds |
show details |
| Photo | Address | Area | Beds / Baths | Price | Details |
|---|---|---|---|---|---|

|
#31
Wilcox Rd
Wilcox, PA 15870
|
- sq. feet
|
- baths - beds |
show details | |

|
Check over 1 million property listings on Foreclosure.com!
|
browse all offers | |||

Latest news about housing in Ridgway, PA collected exclusively by city-data.com from local newspapers, TV, and radio stations

 | Affordable "small" towns with beautiful houses and downtowns? (58 replies) |
| Coming to Philaddelphia in Mid August - Have some questions (7 replies) |
| Suburb of the week: Fox Chapel (86 replies) |
| Best, So-So and Worst Towns in PA (244 replies) |
| relocating to Ridgway (8 replies) |
| Ridgway (0 replies) |

Median year apartment built: 1953
Household type by relationship:
Households: 4,008- Male householders: 742 (204 living alone), Female householders: 941 (416 living alone)
653 spouses (638 opposite-sex spouses), 223 unmarried partners, (223 opposite-sex unmarried partners), 1,077 children (1,038 natural, 18 adopted, 19 stepchildren), 138 grandchildren, 7 brothers or sisters, 70 parents, 0 foster children, 61 other relatives, 37 non-relatives
- In group quarters: 52
Size of family households: 390 2-persons, 240 3-persons, 93 4-persons, 124 5-persons, 97 6-persons.
Size of nonfamily households: 641 1-person, 135 2-persons.
473 married couples with children.
277 single-parent households (78 men, 199 women).
97.4% of residents of Ridgway speak English at home.
0.7% of residents speak Spanish at home (64% speak English very well, 36% speak English not well).
1.0% of residents speak other Indo-European language at home (54% speak English very well, 27% speak English well, 19% speak English not well).
Foreign born population: 8 (0.2%)
(100.0% of them are naturalized citizens)
| Here: | 7.0 |
| State: | 6.8 |
| Here: | 4.2 |
| State: | 4.3 |

- Bedrooms in owner-occupied houses and condos in Ridgway, Pennsylvania
- 0no bedroom
- 391 bedroom
- 842 bedrooms
- 6613 bedrooms
- 3204 bedrooms
- 675+ bedrooms

- Bedrooms in renter-occupied apartments in Ridgway, Pennsylvania
- 61no bedroom
- 1591 bedroom
- 2342 bedrooms
- 943 bedrooms
- 04 bedrooms
- 05+ bedrooms

- Cars and other vehicles available in Ridgway in owner-occupied houses/condos
- 49no vehicle
- 2781 vehicle
- 5652 vehicles
- 1223 vehicles
- 1024 vehicles
- 545+ vehicles

- Cars and other vehicles available in Ridgway in renter-occupied apartments
- 164no vehicle
- 2471 vehicle
- 1292 vehicles
- 83 vehicles
- 04 vehicles
- 05+ vehicles

- Rooms in owner-occupied houses in Ridgway, Pennsylvania
- 01 room
- 02 rooms
- 193 rooms
- 224 rooms
- 905 rooms
- 3196 rooms
- 2527 rooms
- 1318 rooms
- 3369+ rooms

- Rooms in renter-occupied apartments in Ridgway, Pennsylvania
- 611 room
- 1072 rooms
- 173 rooms
- 1354 rooms
- 585 rooms
- 906 rooms
- 347 rooms
- 368 rooms
- 119+ rooms


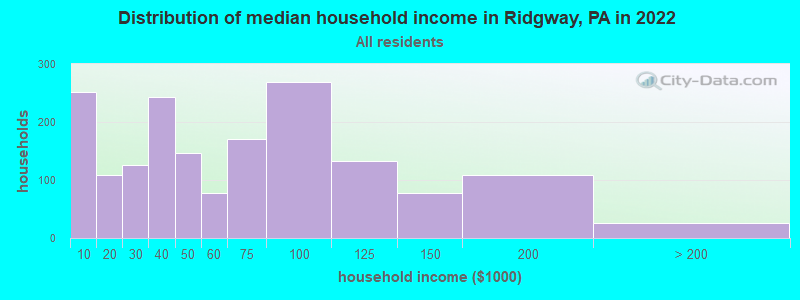
Ridgway, PA household income distribution

- 251Less than $10,000
- 108$10,000 to $19,999
- 126$20,000 to $29,999
- 243$30,000 to $39,999
- 146$40,000 to $49,999
- 77$50,000 to $59,999
- 171$60,000 to $74,999
- 269$75,000 to $99,999
- 133$100,000 to $124,999
- 78$125,000 to $149,999
- 109$150,000 to $199,999
- 26$200,000 or more
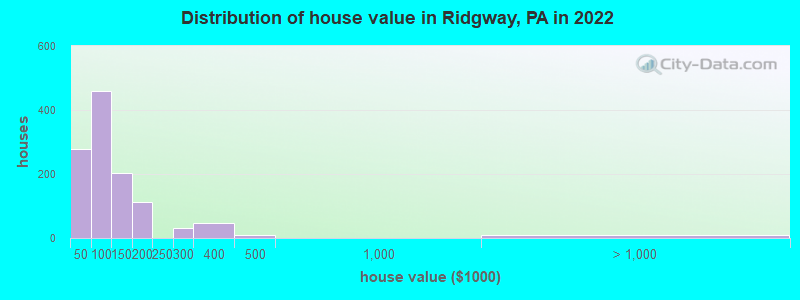
Home value of owner - occupied houses in 2022 in Ridgway, PA
-
- 10$10,000 to $14,999
- 43$20,000 to $24,999
- 24$25,000 to $29,999
- 95$30,000 to $34,999
- 44$35,000 to $39,999
- 60$40,000 to $49,999
- 61$50,000 to $59,999
- 137$60,000 to $69,999
- 68$70,000 to $79,999
- 67$80,000 to $89,999
- 62$90,000 to $99,999
- 133$100,000 to $124,999
- 69$125,000 to $149,999
- 82$150,000 to $174,999
- 29$175,000 to $199,999
- 32$250,000 to $299,999
- 46$300,000 to $399,999
- 10$400,000 to $499,999
- 9$2,000,000 or more
Rent paid by renters in 2022 in Ridgway, PA
-
- 10$200 to $249
- 35$250 to $299
- 70$300 to $349
- 34$350 to $399
- 29$400 to $449
- 58$450 to $499
- 96$500 to $549
- 21$550 to $599
- 39$600 to $649
- 69$650 to $699
- 6$700 to $749
- 32$750 to $799
- 22$800 to $899
- 6$900 to $999
- 19No cash rent


Percentage of workers working in this county: 87.0%
Number of people working at home: 151 (8.0% of all workers)
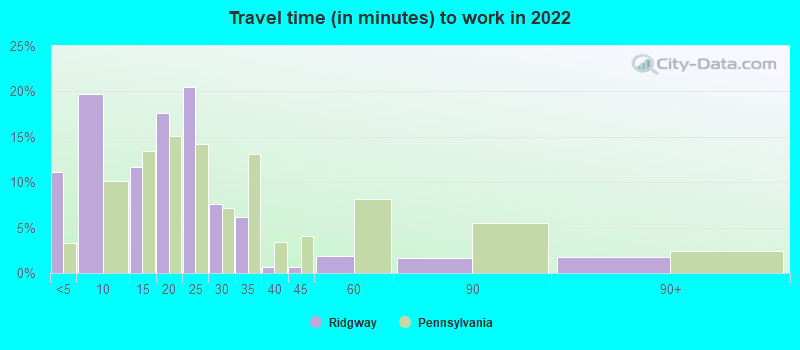
Travel time to work (commute)
- Less than 5 minutes: 208
- 5 to 9 minutes: 416
- 10 to 14 minutes: 212
- 15 to 19 minutes: 207
- 20 to 24 minutes: 308
- 25 to 29 minutes: 58
- 30 to 34 minutes: 72
- 35 to 39 minutes: 19
- 40 to 44 minutes: 100
- 45 to 59 minutes: 62
- 60 to 89 minutes: 38
- 90 or more minutes: 18
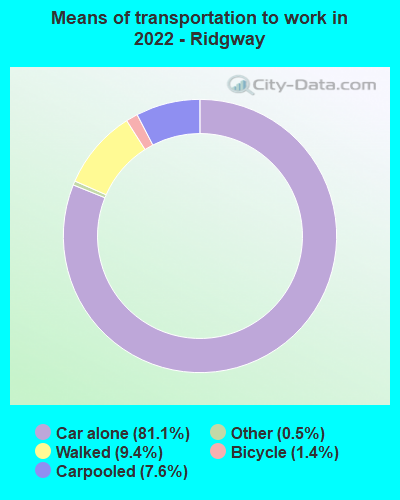
Means of transportation to work:
- Drove a car alone: 1,375 (73.5%)
- Carpooled: 128 (6.8%)
- Taxi: 9 (0.5%)
- Bicycle: 31 (1.7%)
- Walked: 160 (8.6%)
- Worked at home: 151 (8.1%)

- Unemployment by race in 2022
- Unemployment rate for White non-Hispanic residents
- 5.9%Males
- 4.3%Females

- Year of entry for the foreign-born population in Ridgway, Pennsylvania
- 02010 or later
- 02000 to 2009
- 01990 to 1999
- 01980 to 1989
- 221970 to 1979
- 34Before 1970

First ancestries reported:
- German: 418 (31.5%)
- Italian: 272 (20.5%)
- American: 144 (10.8%)
- Polish: 79 (5.9%)
- European: 64 (4.8%)
- Irish: 63 (4.7%)
- Swedish: 30 (2.3%)
- Swiss: 30 (2.3%)
- French Canadian: 24 (1.8%)
- English: 22 (1.7%)
- French: 22 (1.7%)
- Slavic: 14 (1.1%)
- Czech: 10 (0.8%)
- Russian: 9 (0.7%)
- Scottish: 9 (0.7%)
- Pennsylvania German: 5 (0.4%)
- African: 4 (0.3%)
Most common places of birth for foreign-born residents (%):
| Ridgway: | 100.0% (8) |
| Pennsylvania: | 1.8% (17,032) |
Place of birth for U.S.-born residents:
- This state: 3,536
- Other state: 433
- Northeast: 207
- Midwest: 51
- South: 124
- West: 50
87.6% of Ridgway residents lived in the same house 1 years ago.
Out of people who lived in different houses, 32.8% lived in this county.
Out of people who lived in different counties, 47.0% lived in Pennsylvania.
| Ridgway: | 87.6% |
| State average: | 89.3% |
Education attainment for males 25 years and older:
- No schooling: 0
- Nursery to 4th grade: 0
- 5th and 6th grade: 0
- 7th and 8th grade: 8
- 9th grade: 46
- 10th grade: 18
- 11th grade: 9
- 12th grade, no diploma: 16
- High school graduate (or equivalency): 516
- Less than 1 year of college: 97
- Some college more than 1 year, no degree: 145
- Associate degree: 201
- Bachelor's degree: 238
- Master's degree: 27
- Professional school degree: 0
- Doctorate degree: 16

Education attainment for females 25 years and older:
- No schooling: 0
- Nursery to 4th grade: 0
- 5th and 6th grade: 0
- 7th and 8th grade: 0
- 9th grade: 0
- 10th grade: 0
- 11th grade: 62
- 12th grade, no diploma: 0
- High school graduate (or equivalency): 720
- Less than 1 year of college: 78
- Some college more than 1 year, no degree: 97
- Associate degree: 181
- Bachelor's degree: 263
- Master's degree: 49
- Professional school degree: 13
- Doctorate degree: 9


Housing units in structures:
- One, detached: 1,249
- Two: 200
- 3 or 4: 181
- 5 to 9: 21
- 10 to 19: 8
- 20 to 49: 8
- 50 or more: 131
- Mobile homes: 15
Housing units lacking complete kitchen facilities in 2022: 3.7%
House/condo owner moved in on average 22 years ago
Renter moved in on average 2 years ago

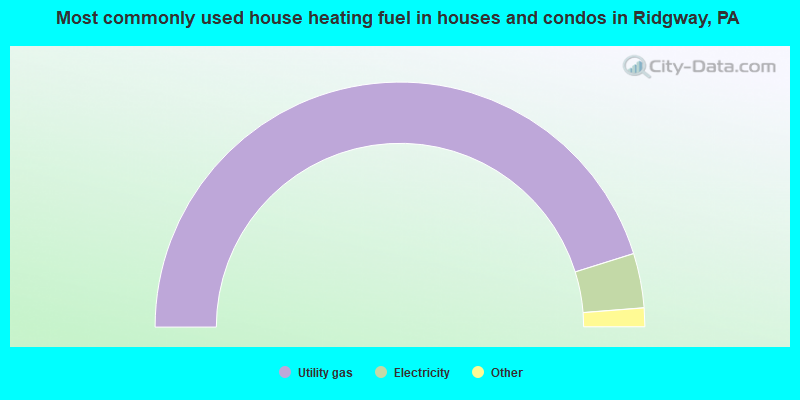
- 90.4%Utility gas
- 7.2%Electricity
- 1.7%Bottled, tank, or LP gas
- 0.6%Wood
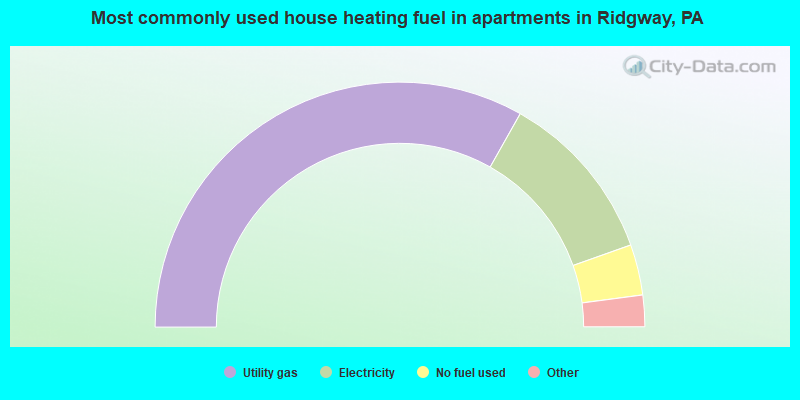
- 66.7%Utility gas
- 22.9%Electricity
- 6.7%No fuel used
- 2.0%Bottled, tank, or LP gas
- 1.7%Wood
Private vs. public school enrollment:
| Here: | 20.0% |
| Pennsylvania: | 15.7% |
| Here: | 9.4% |
| Pennsylvania: | 13.4% |
| Here: | 0.0% |
| Pennsylvania: | 39.8% |


