Rio Dell, CA (California) Houses and Residents
| Rio Dell: | $308,105 |
| California: | $715,900 |
Mean price in 2022:
Detached houses: $398,307
Here: $398,307 State: $988,808 Mobile homes: $216,940
Here: $216,940 State: $184,506
Total population: 3,377 (Urban population: 2,934 (all inside urban clusters), Rural population: 239 (all nonfarm))
Houses: 1,525 (1,382 occupied: 790 owner occupied, 637 renter occupied)
| % of renters here: | 45% |
| State: | 44% |
Housing density: 809 houses/condos per square mile
Median price asked for vacant for-sale houses and condos in 2022: $696,684.
Median contract rent in 2022: $753 (lower quartile is $597, upper quartile is $893)
Median rent asked for vacant for-rent units in 2022: $885
Median gross rent in Rio Dell, CA in 2022: $940
Housing units in Rio Dell with a mortgage: 475 (53 second mortgage, 0 home equity loan, 65 both second mortgage and home equity loan)
Houses without a mortgage: 0
Median household income for houses/condos with a mortgage: $84,713
Median household income for apartments without a mortgage: $43,878
Median monthly housing costs: $935
Compare current foreclosures near Rio Dell, CA:
| Photo | Address | Area | Beds / Baths | Price | Details |
|---|---|---|---|---|---|

|
#1
Eeloa Ave
Rio Dell, CA 95562
|
1,151 sq. feet
|
1 baths 3 beds |
show details | |

|
#2
E Bridge St
Rio Dell, CA 95562
|
- sq. feet
|
- baths - beds |
show details | |

|
#3
6th St
Fortuna, CA 95540
|
1,829 sq. feet
|
4 baths 6 beds |
show details | |

|
#4
Tami Dr
Fortuna, CA 95540
|
1,254 sq. feet
|
2 baths 4 beds |
show details | |

|
#5
Coyote Crk Rd
Kneeland, CA 95549
|
- sq. feet
|
- baths - beds |
show details | |

|
#6
Sewell Dr
Weott, CA 95571
|
- sq. feet
|
- baths - beds |
show details | |

|
#7
Main St
Ferndale, CA 95536
|
- sq. feet
|
- baths - beds |
show details | |

|
#8
N St
Fortuna, CA 95540
|
- sq. feet
|
- baths - beds |
show details | |

|
#9
Beechwood Dr
Eureka, CA 95503
|
- sq. feet
|
- baths - beds |
show details | |

|
#10
Riverwalk Dr # 1
Fortuna, CA 95540
|
- sq. feet
|
- baths - beds |
show details |
| Photo | Address | Area | Beds / Baths | Price | Details |
|---|---|---|---|---|---|

|
#11
North Rd
Scotia, CA 95565
|
- sq. feet
|
- baths - beds |
show details | |

|
#12
Main Street
Scotia, CA 95565
|
- sq. feet
|
- baths - beds |
show details | |

|
#13
Main St
Scotia, CA 95565
|
- sq. feet
|
- baths - beds |
show details | |

|
#14
Main St # 567
Scotia, CA 95565
|
- sq. feet
|
- baths - beds |
show details | |

|
#15
Ronald Ave
Fortuna, CA 95540
|
- sq. feet
|
- baths - beds |
show details | |

|
#16
Jones Ct
Fortuna, CA 95540
|
- sq. feet
|
- baths - beds |
show details | |

|
#17
10th St
Fortuna, CA 95540
|
- sq. feet
|
- baths - beds |
show details | |

|
#18
State Highway 36
Carlotta, CA 95528
|
- sq. feet
|
- baths - beds |
show details | |

|
#19
Wrigley Rd
Eureka, CA 95503
|
- sq. feet
|
- baths - beds |
show details | |

|
#20
Kipling Dr
Eureka, CA 95503
|
- sq. feet
|
- baths - beds |
show details |
| Photo | Address | Area | Beds / Baths | Price | Details |
|---|---|---|---|---|---|

|
#21
Lawndale Dr
Fortuna, CA 95540
|
- sq. feet
|
- baths - beds |
show details | |

|
Check over 1 million property listings on Foreclosure.com!
|
browse all offers | |||


 | Widow moving to CA needs advice (20 replies) |
| "Humboldt hack" and winter climate in Eureka area (55 replies) |
| Does the West Coast have anything equivalent to Cape Cod ?? (49 replies) |
| moving to arcata, ca. area: taxes? poets? topography?weather? (39 replies) |
| Eureka vs Chico vs Merced (60 replies) |
| Coastal Humboldt County (35 replies) |

Median year apartment built: 1964
Household type by relationship:
Households: 3,358- Male householders: 606 (204 living alone), Female householders: 752 (313 living alone)
524 spouses (524 opposite-sex spouses), 47 unmarried partners, (47 opposite-sex unmarried partners), 1,085 children (1,060 natural, 0 adopted, 25 stepchildren), 204 grandchildren, 26 brothers or sisters, 35 parents, 0 foster children, 49 other relatives, 0 non-relatives
- In group quarters: 23
Size of family households: 333 2-persons, 162 3-persons, 185 4-persons, 71 5-persons, 54 7-or-more-persons.
Size of nonfamily households: 538 1-person, 54 2-persons.
318 married couples with children.
454 single-parent households (24 men, 430 women).
95.0% of residents of Rio Dell speak English at home.
1.4% of residents speak Spanish at home (100% speak English very well).
0.5% of residents speak other Indo-European language at home (53% speak English very well, 47% speak English well).
2.4% of residents speak Asian or Pacific Island language at home (50% speak English very well, 20% speak English well, 30% speak English not well).
Foreign born population: 152 (4.5%)
(79.6% of them are naturalized citizens)
| Here: | 5.5 |
| State: | 6.0 |
| Here: | 3.9 |
| State: | 3.9 |

- Bedrooms in owner-occupied houses and condos in Rio Dell, California
- 25no bedroom
- 211 bedroom
- 3032 bedrooms
- 3113 bedrooms
- 1314 bedrooms
- 05+ bedrooms

- Bedrooms in renter-occupied apartments in Rio Dell, California
- 15no bedroom
- 2331 bedroom
- 2042 bedrooms
- 1483 bedrooms
- 384 bedrooms
- 05+ bedrooms

- Cars and other vehicles available in Rio Dell in owner-occupied houses/condos
- 28no vehicle
- 1421 vehicle
- 3062 vehicles
- 2423 vehicles
- 384 vehicles
- 355+ vehicles

- Cars and other vehicles available in Rio Dell in renter-occupied apartments
- 43no vehicle
- 4081 vehicle
- 1202 vehicles
- 673 vehicles
- 04 vehicles
- 05+ vehicles

- Rooms in owner-occupied houses in Rio Dell, California
- 251 room
- 92 rooms
- 03 rooms
- 1994 rooms
- 1565 rooms
- 1546 rooms
- 1837 rooms
- 158 rooms
- 499+ rooms

- Rooms in renter-occupied apartments in Rio Dell, California
- 151 room
- 1292 rooms
- 973 rooms
- 2234 rooms
- 785 rooms
- 486 rooms
- 487 rooms
- 08 rooms
- 09+ rooms


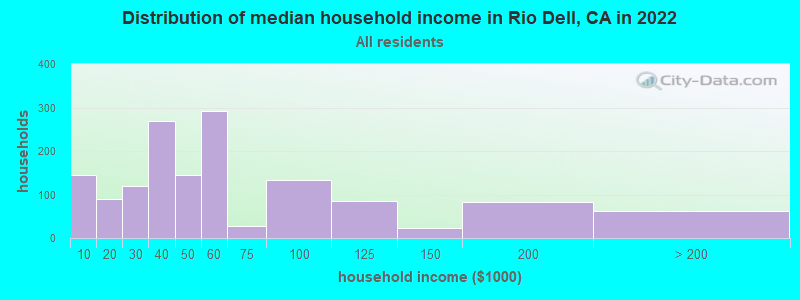
Rio Dell, CA household income distribution

- 144Less than $10,000
- 90$10,000 to $19,999
- 120$20,000 to $29,999
- 270$30,000 to $39,999
- 145$40,000 to $49,999
- 291$50,000 to $59,999
- 28$60,000 to $74,999
- 133$75,000 to $99,999
- 86$100,000 to $124,999
- 24$125,000 to $149,999
- 83$150,000 to $199,999
- 63$200,000 or more
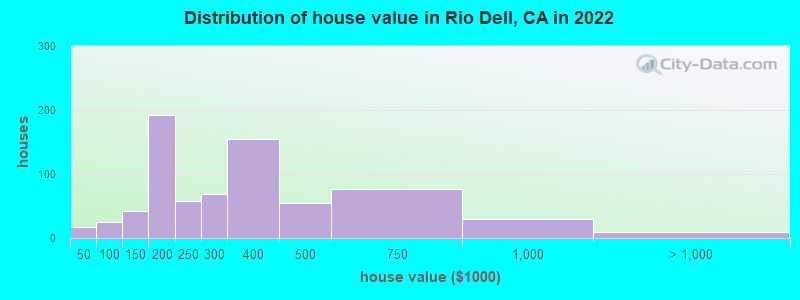
Home value of owner - occupied houses in 2022 in Rio Dell, CA
-
- 17$20,000 to $24,999
- 10$60,000 to $69,999
- 14$80,000 to $89,999
- 42$125,000 to $149,999
- 123$150,000 to $174,999
- 69$175,000 to $199,999
- 57$200,000 to $249,999
- 68$250,000 to $299,999
- 155$300,000 to $399,999
- 53$400,000 to $499,999
- 77$500,000 to $749,999
- 29$750,000 to $999,999
- 10$2,000,000 or more
Rent paid by renters in 2022 in Rio Dell, CA
-
- 62Less than $100
- 32$200 to $249
- 16$300 to $349
- 9$350 to $399
- 11$400 to $449
- 3$500 to $549
- 45$600 to $649
- 21$650 to $699
- 146$700 to $749
- 80$750 to $799
- 58$800 to $899
- 29$900 to $999
- 28$1,000 to $1,249
- 52$1,250 to $1,499
- 30$1,500 to $1,999
- 36No cash rent


Percentage of workers working in this county: 94.1%
Number of people working at home: 195 (12.5% of all workers)
Travel time to work (commute)
- Less than 5 minutes: 104
- 5 to 9 minutes: 222
- 10 to 14 minutes: 227
- 15 to 19 minutes: 266
- 20 to 24 minutes: 73
- 25 to 29 minutes: 54
- 30 to 34 minutes: 164
- 35 to 39 minutes: 100
- 40 to 44 minutes: 43
- 45 to 59 minutes: 131
- 60 to 89 minutes: 52
- 90 or more minutes: 0
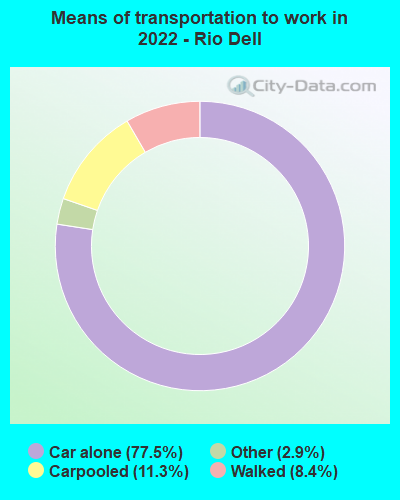
Means of transportation to work:
- Drove a car alone: 335 (63.1%)
- Carpooled: 45 (8.5%)
- Taxi: 16 (3.0%)
- Walked: 34 (6.4%)
- Worked at home: 179 (33.7%)

- Unemployment by race in 2022
- Unemployment rate for White non-Hispanic residents
- 6.9%Males
- 5.3%Females
- Unemployment rate for American Indian and Alaska Native residents
- 40.3%Females
- Unemployment rate for Asian residents
- 38.6%Females
- Unemployment rate for other race residents
- 100.0%Females
- Unemployment rate for Hispanic or Latino residents
- 30.3%Females

- Year of entry for the foreign-born population in Rio Dell, California
- 92010 or later
- 1082000 to 2009
- 01990 to 1999
- 101980 to 1989
- 861970 to 1979
- 65Before 1970

First ancestries reported:
- American: 155 (16.1%)
- German: 96 (10.0%)
- Irish: 92 (9.6%)
- Portuguese: 27 (2.8%)
- English: 19 (2.0%)
- Danish: 17 (1.8%)
- Italian: 14 (1.5%)
- Polish: 12 (1.2%)
- Scottish: 10 (1.0%)
- Northern European: 7 (0.7%)
- Dutch: 4 (0.4%)
Most common places of birth for foreign-born residents (%):
| Rio Dell: | 49.3% (71) |
| California: | 1.2% (127,477) |
| Rio Dell: | 41.7% (60) |
| California: | 7.8% (818,297) |
| Rio Dell: | 4.9% (7) |
| California: | 0.7% (74,025) |
| Rio Dell: | 2.8% (4) |
| California: | 37.2% (3,881,193) |
Place of birth for U.S.-born residents:
- This state: 2,559
- Other state: 603
- Northeast: 12
- Midwest: 121
- South: 371
- West: 154
92.8% of Rio Dell residents lived in the same house 1 years ago.
Out of people who lived in different houses, 41.5% lived in this county.
Out of people who lived in different counties, 90.1% lived in California.
| Rio Dell: | 92.8% |
| State average: | 88.9% |
Education attainment for males 25 years and older:
- No schooling: 0
- Nursery to 4th grade: 0
- 5th and 6th grade: 0
- 7th and 8th grade: 4
- 9th grade: 0
- 10th grade: 91
- 11th grade: 0
- 12th grade, no diploma: 12
- High school graduate (or equivalency): 635
- Less than 1 year of college: 48
- Some college more than 1 year, no degree: 89
- Associate degree: 17
- Bachelor's degree: 77
- Master's degree: 23
- Professional school degree: 0
- Doctorate degree: 14

Education attainment for females 25 years and older:
- No schooling: 0
- Nursery to 4th grade: 0
- 5th and 6th grade: 0
- 7th and 8th grade: 0
- 9th grade: 0
- 10th grade: 34
- 11th grade: 18
- 12th grade, no diploma: 19
- High school graduate (or equivalency): 363
- Less than 1 year of college: 204
- Some college more than 1 year, no degree: 167
- Associate degree: 151
- Bachelor's degree: 44
- Master's degree: 36
- Professional school degree: 0
- Doctorate degree: 0


Housing units in structures:
- One, detached: 1,162
- Two: 114
- 3 or 4: 46
- 5 to 9: 10
- 20 to 49: 61
- 50 or more: 21
- Mobile homes: 108
Median worth of mobile homes: $76,281
House/condo owner moved in on average 12 years ago
Renter moved in on average 6 years ago

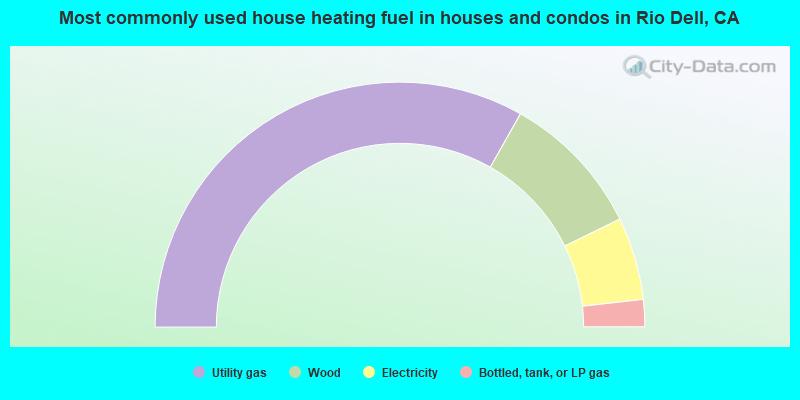
- 66.4%Utility gas
- 19.1%Wood
- 10.9%Electricity
- 3.6%Bottled, tank, or LP gas
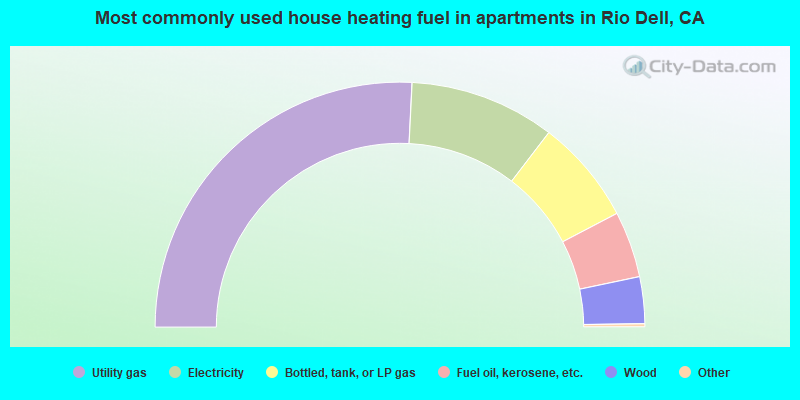
- 51.8%Utility gas
- 19.3%Electricity
- 13.9%Bottled, tank, or LP gas
- 8.8%Fuel oil, kerosene, etc.
- 6.2%Wood
Private vs. public school enrollment:
| Here: | 35.7% |
| California: | 10.5% |
| Here: | 23.3% |
| California: | 8.5% |
| Here: | 0.0% |
| California: | 15.9% |


