Jump to a detailed profile or search site with Google Custom Search

Rio Linda, CA (California) Houses and Residents

Estimated median house or condo value in 2022: $449,643 (it was $112,700 in 2000)
Rio Linda:

$449,643
California:

$715,900
Lower value quartile - upper value quartile: $350,338 - $585,547

Mean price in 2022:

Detached houses: $378,001
Here:

$378,001
State:

$988,808

Townhouses or other attached units: $263,870
Here:

$263,870
State:

$838,546

Mobile homes: $193,699
Here:

$193,699
State:

$184,506

Total population: 15,106 (Urban population: 10,450, Rural population: 0)

Houses: 5,401 (5,225 occupied: 3,619 owner occupied, 1,595 renter occupied)

% of renters here:

31%
State:

44%

Housing density: 986 houses/condos per square mile

Median price asked for vacant for-sale houses and condos in 2022: $1,767,611.

Median contract rent in 2022: $1,436 (lower quartile is $1,005, upper quartile is $1,788)


Median rent asked for vacant for-rent units in 2022: $1,225


Median gross rent in Rio Linda, CA in 2022: $1,719

Housing units in Rio Linda with a mortgage: 2,563 (224 second mortgage, 68 home equity loan, 174 both second mortgage and home equity loan)
Houses without a mortgage: 61

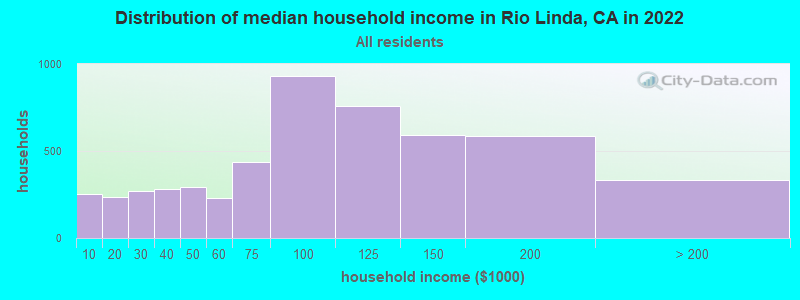
Median household income for houses/condos with a mortgage: $117,217

Median household income for apartments without a mortgage: $67,208

Median monthly housing costs: $1,681

Compare current foreclosures near Rio Linda, CA:

Check out more offers near Rio Linda, CA.
Powered by Foreclosure.com

Settings
X
Data:
Loading data...
Based on 2000-2022 data
Loading data...

123
Hide US histogram

Rio Linda, California Age and Sex of Residents
Median year house/condo built: 1976

Median year apartment built: 1968

Household type by relationship:

Households: 16,648
  • Male householders: 2,370 (400 living alone), Female householders: 2,779 (425 living alone)
  • 2,914 spouses (2,876 opposite-sex spouses), 419 unmarried partners, (399 opposite-sex unmarried partners), 5,084 children (4,976 natural, 72 adopted, 36 stepchildren), 764 grandchildren, 380 brothers or sisters, 354 parents, 0 foster children, 942 other relatives, 530 non-relatives
  • In group quarters: 107

Size of family households: 1,258 2-persons, 1,157 3-persons, 617 4-persons, 496 5-persons, 252 6-persons, 253 7-or-more-persons.

Size of nonfamily households: 865 1-person, 275 2-persons, 19 3-persons.

2,074 married couples with children.
920 single-parent households (182 men, 738 women).

73.3% of residents of Rio Linda speak English at home.
13.7% of residents speak Spanish at home (67% speak English very well, 13% speak English well, 15% speak English not well, 5% don't speak English at all).
7.6% of residents speak other Indo-European language at home (43% speak English very well, 30% speak English well, 26% speak English not well).
5.0% of residents speak Asian or Pacific Island language at home (64% speak English very well, 24% speak English well, 12% speak English not well).
0.3% of residents speak other language at home (74% speak English very well, 26% speak English not well).

Foreign born population: 2,382 (14.3%)
(60.8% of them are naturalized citizens)

Median number of rooms in houses and condos:
Here:

5.9
State:

6.0

Median number of rooms in apartments
Here:

5.0
State:

3.9

Owner-occupied Renter-occupied
Bedrooms in owner-occupied houses and condos in Rio Linda, California
  • Bedrooms in owner-occupied houses and condos in Rio Linda, California
  • 26no bedroom
  • 881 bedroom
  • 4432 bedrooms
  • 2,0963 bedrooms
  • 8364 bedrooms
  • 1305+ bedrooms
Bedrooms in renter-occupied apartments in Rio Linda, California
  • Bedrooms in renter-occupied apartments in Rio Linda, California
  • 0no bedroom
  • 1861 bedroom
  • 4502 bedrooms
  • 7633 bedrooms
  • 1214 bedrooms
  • 765+ bedrooms
Owner-occupied Renter-occupied
Cars and other vehicles available in Rio Linda in owner-occupied houses/condos
  • Cars and other vehicles available in Rio Linda in owner-occupied houses/condos
  • 72no vehicle
  • 5161 vehicle
  • 1,3162 vehicles
  • 1,0133 vehicles
  • 4584 vehicles
  • 2445+ vehicles
Cars and other vehicles available in Rio Linda in renter-occupied apartments
  • Cars and other vehicles available in Rio Linda in renter-occupied apartments
  • 81no vehicle
  • 5441 vehicle
  • 5302 vehicles
  • 2663 vehicles
  • 1474 vehicles
  • 265+ vehicles
Owner-occupied Renter-occupied
Rooms in owner-occupied houses in Rio Linda, California
  • Rooms in owner-occupied houses in Rio Linda, California
  • 71 room
  • 202 rooms
  • 403 rooms
  • 2754 rooms
  • 1,0455 rooms
  • 1,1246 rooms
  • 5047 rooms
  • 3428 rooms
  • 2619+ rooms
Rooms in renter-occupied apartments in Rio Linda, California
  • Rooms in renter-occupied apartments in Rio Linda, California
  • 01 room
  • 812 rooms
  • 623 rooms
  • 4424 rooms
  • 3305 rooms
  • 3326 rooms
  • 2147 rooms
  • 308 rooms
  • 1049+ rooms
Year house built
Median 2022 house/condo value by year built
Median house/condo value by year householder moved into unit
Breakdown of mean house values by ages of householders
Owners and renters by unit type in Rio Linda, CA
  • Rio Linda, CA household income distribution

  • Distribution of median household income in Rio Linda, CA in 2022
  • 254Less than $10,000
  • 238$10,000 to $19,999
  • 269$20,000 to $29,999
  • 283$30,000 to $39,999
  • 295$40,000 to $49,999
  • 230$50,000 to $59,999
  • 436$60,000 to $74,999
  • 931$75,000 to $99,999
  • 759$100,000 to $124,999
  • 591$125,000 to $149,999
  • 589$150,000 to $199,999
  • 334$200,000 or more
  • Home value of owner - occupied houses in 2022 in Rio Linda, CA

  • Distribution of house value in Rio Linda, CA in 2022
  • 13Less than $10,000
  • 13$30,000 to $34,999
  • 10$35,000 to $39,999
  • 41$40,000 to $49,999
  • 27$60,000 to $69,999
  • 26$100,000 to $124,999
  • 7$125,000 to $149,999
  • 71$150,000 to $174,999
  • 49$175,000 to $199,999
  • 195$200,000 to $249,999
  • 130$250,000 to $299,999
  • 665$300,000 to $399,999
  • 613$400,000 to $499,999
  • 1,002$500,000 to $749,999
  • 295$750,000 to $999,999
  • 62$1,000,000 to $1,499,999
  • Rent paid by renters in 2022 in Rio Linda, CA

  • Distribution of rent paid by renters in Rio Linda, CA in 2022
  • 52$200 to $249
  • 9$400 to $449
  • 71$500 to $549
  • 3$550 to $599
  • 10$600 to $649
  • 11$700 to $749
  • 13$750 to $799
  • 96$800 to $899
  • 135$900 to $999
  • 158$1,000 to $1,249
  • 200$1,250 to $1,499
  • 578$1,500 to $1,999
  • 26$2,000 to $2,499
  • 64$3,000 to $3,499
  • 164No cash rent
Time Leaving Home To Go To Work in 2022

Percentage of workers working in this county: 77.4%
Number of people working at home: 1,102 (15.1% of all workers)

Travel time (in minutes) to work in 2022

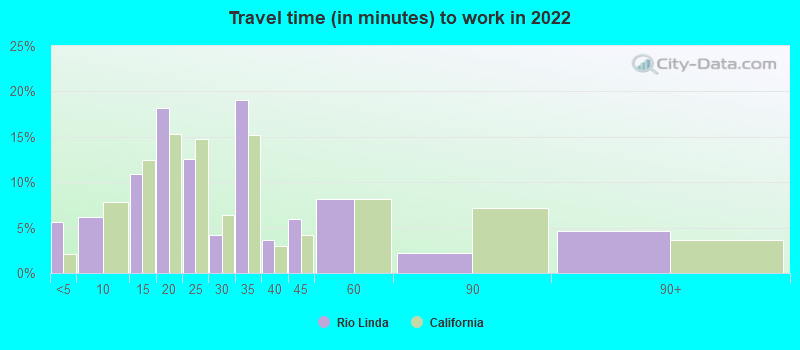
Travel time to work (commute)

  • Less than 5 minutes: 88
  • 5 to 9 minutes: 244
  • 10 to 14 minutes: 555
  • 15 to 19 minutes: 735
  • 20 to 24 minutes: 1,080
  • 25 to 29 minutes: 451
  • 30 to 34 minutes: 1,136
  • 35 to 39 minutes: 326
  • 40 to 44 minutes: 240
  • 45 to 59 minutes: 428
  • 60 to 89 minutes: 351
  • 90 or more minutes: 315
Means of transportation to work in 2022 - Rio Linda

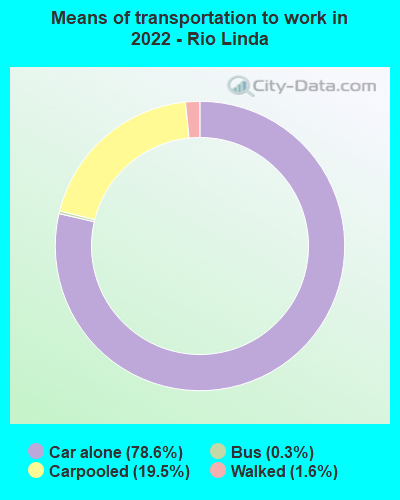
Means of transportation to work:

  • Drove a car alone: 1,890 (55.8%)
  • Carpooled: 483 (14.3%)
  • Bus: 4 (0.1%)
  • Walked: 43 (1.3%)
  • Worked at home: 1,102 (32.5%)
Class of Workers in 2022
  • Unemployment by race in 2022
  • Unemployment rate for White non-Hispanic residents
  • 3.7%Males
  • 6.4%Females
  • Unemployment rate for American Indian and Alaska Native residents
  • 8.2%Males
  • 24.4%Females
  • Unemployment rate for other race residents
  • 5.0%Males
  • 0.8%Females
  • Unemployment rate for two or more race residents
  • 3.1%Females
  • Unemployment rate for Hispanic or Latino residents
  • 2.9%Males
  • 3.9%Females
Year of entry for the foreign-born population in Rio Linda, California
  • Year of entry for the foreign-born population in Rio Linda, California
  • 5602010 or later
  • 5052000 to 2009
  • 8671990 to 1999
  • 2031980 to 1989
  • 821970 to 1979
  • 156Before 1970
Ancestries in Rio Linda, CA

First ancestries reported:

  • Russian: 634 (6.2%)
  • German: 480 (4.7%)
  • Ukrainian: 466 (4.6%)
  • American: 422 (4.2%)
  • European: 357 (3.5%)
  • English: 335 (3.3%)
  • Irish: 151 (1.5%)
  • Armenian: 95 (0.9%)
  • Italian: 89 (0.9%)
  • Norwegian: 69 (0.7%)
  • Romanian: 41 (0.4%)
  • Polish: 33 (0.3%)
  • Canadian: 31 (0.3%)
  • New Zealander: 26 (0.3%)
  • Scottish: 17 (0.2%)
  • Lithuanian: 16 (0.2%)
  • Eastern European: 15 (0.1%)
  • Scotch-Irish: 14 (0.1%)
  • Slovak: 12 (0.1%)
  • Welsh: 8 (0.08%)
  • Basque: 7 (0.07%)
  • Scandinavian: 6 (0.06%)
  • Greek: 5 (0.05%)

Most common places of birth for foreign-born residents (%):

Mexico
Rio Linda:

35.4% (820)
California:

37.2% (3,881,193)

Russia
Rio Linda:

14.9% (346)
California:

0.7% (71,932)

Ukraine
Rio Linda:

13.3% (307)
California:

0.6% (60,761)

Philippines
Rio Linda:

5.7% (133)
California:

7.8% (818,297)

Laos
Rio Linda:

5.5% (127)
California:

0.5% (48,911)

Korea
Rio Linda:

3.3% (76)
California:

3.0% (315,248)

Georgia
Rio Linda:

3.0% (70)
California:

0.0% (4,333)

Uzbekistan
Rio Linda:

2.5% (58)
California:

0.1% (5,897)

Iraq
Rio Linda:

2.3% (53)
California:

0.4% (40,941)

Vietnam
Rio Linda:

2.3% (53)
California:

4.9% (512,335)

Thailand
Rio Linda:

1.7% (39)
California:

0.6% (65,335)

Belarus
Rio Linda:

1.6% (36)
California:

0.1% (11,157)

Moldova
Rio Linda:

1.6% (36)
California:

0.1% (10,171)

Romania
Rio Linda:

1.6% (36)
California:

0.2% (23,058)

Place of birth for U.S.-born residents:

  • This state: 11,129
  • Other state: 2,978
  • Northeast: 465
  • Midwest: 556
  • South: 786
  • West: 1,188

89.4% of Rio Linda residents lived in the same house 1 years ago.
   Out of people who lived in different houses, 46.6% lived in this county.
   Out of people who lived in different counties, 81.8% lived in California.


Rio Linda:

89.4%
State average:

88.9%

Education attainment for males 25 years and older:

  • No schooling: 130
  • Nursery to 4th grade: 0
  • 5th and 6th grade: 143
  • 7th and 8th grade: 38
  • 9th grade: 32
  • 10th grade: 0
  • 11th grade: 86
  • 12th grade, no diploma: 167
  • High school graduate (or equivalency): 2,662
  • Less than 1 year of college: 294
  • Some college more than 1 year, no degree: 550
  • Associate degree: 591
  • Bachelor's degree: 550
  • Master's degree: 48
  • Professional school degree: 12
  • Doctorate degree: 19
Educational Attainment for Males

Education attainment for females 25 years and older:

  • No schooling: 99
  • Nursery to 4th grade: 23
  • 5th and 6th grade: 62
  • 7th and 8th grade: 24
  • 9th grade: 41
  • 10th grade: 51
  • 11th grade: 99
  • 12th grade, no diploma: 197
  • High school graduate (or equivalency): 2,199
  • Less than 1 year of college: 483
  • Some college more than 1 year, no degree: 835
  • Associate degree: 530
  • Bachelor's degree: 763
  • Master's degree: 137
  • Professional school degree: 48
  • Doctorate degree: 25
Educational Attainment for Females
Rio Linda marital status for males
Rio Linda marital status for females

Housing units in structures:

  • One, detached: 4,914
  • One, attached: 135
  • Two: 54
  • 5 to 9: 5
  • 10 to 19: 75
  • 20 to 49: 48
  • 50 or more: 27
  • Mobile homes: 139

Median worth of mobile homes: $262,972

Housing units lacking complete plumbing facilities in 2022: 1.6%

Housing units lacking complete kitchen facilities in 2022: 1.8%

House/condo owner moved in on average 15 years ago

Renter moved in on average 6 years ago

Year householders moved into residence in Rio Linda
Houses and condos Apartments
Most commonly used house heating fuel in houses and condos in Rio Linda, CA
  • 71.4%Utility gas
  • 22.0%Electricity
  • 3.0%Bottled, tank, or LP gas
  • 2.2%Wood
  • 0.7%Fuel oil, kerosene, etc.
  • 0.4%No fuel used
  • 0.3%Solar energy
Most commonly used house heating fuel in apartments in Rio Linda, CA
  • 48.7%Utility gas
  • 45.2%Electricity
  • 4.5%Bottled, tank, or LP gas
  • 1.2%No fuel used
  • 0.4%Wood

Private vs. public school enrollment:

Students in private schools in grades 1 to 8 (elementary and middle school): 187
Here:

10.9%
California:

10.5%

Students in private schools in grades 9 to 12 (high school): 54
Here:

6.9%
California:

8.5%

Students in private undergraduate colleges: 117
Here:

19.1%
California:

15.9%
School Enrollment by Level of School for Male Students
School Enrollment by Level of School for Female Students
Age and Sex of Sensory-Disabled Noninstitutionalized Residents
Age and Sex of Physically-Disabled Noninstitutionalized Residents
Age and Sex of Mentally-Disabled Noninstitutionalized Residents
Age and Sex of Self-Care Disabled Noninstitutionalized Residents
Age and Sex of Go-Outside-Home Disabled Noninstitutionalized Residents
Age and Sex of Noninstitutionalized Residents with Employment Disability