Rio del Mar, CA (California) Houses and Residents
| Rio del Mar: | $1,292,821 |
| California: | $715,900 |
Mean price in 2022:
Detached houses: $1,589,059
Here: $1,589,059 State: $988,808 Townhouses or other attached units: $1,139,291
Here: $1,139,291 State: $838,546 In 3-to-4-unit structures: $824,027
Here: $824,027 State: $824,253 In 5-or-more-unit structures: $980,309
Here: $980,309 State: $730,996
Total population: 9,216 (Urban population: 9,133, Rural population: 0)
Houses: 4,820 (3,828 occupied: 2,994 owner occupied, 791 renter occupied)
| % of renters here: | 21% |
| State: | 44% |
Housing density: 1,613 houses/condos per square mile
Median price asked for vacant for-sale houses and condos in 2022: $5,707,958.
Median contract rent in 2022: over $2,000 (lower quartile is $1,495, upper quartile is over $2,000)
Median rent asked for vacant for-rent units in 2022: $5,160
Median gross rent in Rio del Mar, CA in 2022: over $2,000
Housing units in Rio del Mar with a mortgage: 2,047 (233 second mortgage, 0 home equity loan, 183 both second mortgage and home equity loan)
Houses without a mortgage: 43
Median household income for houses/condos with a mortgage: $177,344
Median household income for apartments without a mortgage: $104,311
Median monthly housing costs: $2,811
Compare current foreclosures near Rio del Mar, CA:
| Photo | Address | Area | Beds / Baths | Price | Details |
|---|---|---|---|---|---|

|
#1
Hall Ranch Rd
Santa Cruz, CA 95065
|
1,534 sq. feet
|
2 baths 2 beds |
show details | |

|
#2
Santa Barbara Dr
Gilroy, CA 95020
|
1,540 sq. feet
|
2 baths 3 beds |
show details | |

|
#3
Enos Ln
Watsonville, CA 95076
|
2,179 sq. feet
|
2 baths 3 beds |
show details | |

|
#4
Via Linda
Castroville, CA 95012
|
1,688 sq. feet
|
3 baths 4 beds |
show details | |

|
#5
Hazel Ct
Soquel, CA 95073
|
3,071 sq. feet
|
3 baths 4 beds |
show details | |

|
#6
Empire Grade
Santa Cruz, CA 95060
|
1,438 sq. feet
|
2 baths 3 beds |
show details | |

|
#7
Rodeo Dr
Gilroy, CA 95020
|
2,658 sq. feet
|
3 baths 5 beds |
show details | |

|
#8
Bahr Dr
Ben Lomond, CA 95005
|
2,231 sq. feet
|
3 baths 4 beds |
show details | |

|
#9
La Alameda Dr
Morgan Hill, CA 95037
|
1,615 sq. feet
|
2 baths 3 beds |
show details | |

|
#10
Western Avenue
Boulder Creek, CA 95006
|
1,468 sq. feet
|
2 baths 2 beds |
show details |
| Photo | Address | Area | Beds / Baths | Price | Details |
|---|---|---|---|---|---|

|
#11
Migues Mountain Ln
Aptos, CA 95003
|
4,500 sq. feet
|
2 baths 3 beds |
show details | |

|
#12
Westwood Dr
Gilroy, CA 95020
|
1,524 sq. feet
|
2 baths 3 beds |
show details | |

|
#13
Carpenteria Rd
Aromas, CA 95004
|
1,270 sq. feet
|
3 baths 5 beds |
show details | |

|
#14
Haight St
Castroville, CA 95012
|
1,246 sq. feet
|
2 baths 3 beds |
show details | |

|
#15
Fruitland Ave
Watsonville, CA 95076
|
2,345 sq. feet
|
2 baths 2 beds |
show details | |

|
#16
Alisa Cir
Watsonville, CA 95076
|
- sq. feet
|
1 baths 2 beds |
show details | |

|
#17
Campo De Casa Dr
Castroville, CA 95012
|
1,146 sq. feet
|
2 baths 3 beds |
show details | |

|
#18
Mead St
Castroville, CA 95012
|
1,792 sq. feet
|
2 baths 4 beds |
show details | |

|
#19
Comunidad Way
Castroville, CA 95012
|
1,246 sq. feet
|
2 baths 4 beds |
show details | |

|
#20
Osborn Rd
Watsonville, CA 95076
|
1,228 sq. feet
|
1 baths 3 beds |
show details |
| Photo | Address | Area | Beds / Baths | Price | Details |
|---|---|---|---|---|---|

|
#21
Gregory Rd
Watsonville, CA 95076
|
1,619 sq. feet
|
2 baths 4 beds |
show details | |

|
#22
Summit Rd
Los Gatos, CA 95033
|
1,135 sq. feet
|
1 baths 2 beds |
show details | |

|
#23
Fresco St
Felton, CA 95018
|
- sq. feet
|
1 baths 1 beds |
show details | |

|
#24
Loma Prieta Ave
Los Gatos, CA 95033
|
4,167 sq. feet
|
4 baths 4 beds |
show details | |

|
#25
Johnson Rd
Watsonville, CA 95076
|
1,852 sq. feet
|
3 baths 6 beds |
show details | |

|
#26
Cockle Bur Ct
Salinas, CA 93907
|
1,454 sq. feet
|
2 baths 3 beds |
show details | |

|
#27
Loma Prieta Ave
Los Gatos, CA 95033
|
4,167 sq. feet
|
4 baths 4 beds |
show details | |

|
#28
Las Lomas Dr
Watsonville, CA 95076
|
1,120 sq. feet
|
1 baths 3 beds |
show details | |

|
#29
Willow Rd
Watsonville, CA 95076
|
1,976 sq. feet
|
1 baths 4 beds |
show details | |

|
#30
Las Lomas Dr
Watsonville, CA 95076
|
1,259 sq. feet
|
2 baths 3 beds |
show details |
| Photo | Address | Area | Beds / Baths | Price | Details |
|---|---|---|---|---|---|

|
#31
Wright Ave
Morgan Hill, CA 95037
|
1,563 sq. feet
|
2 baths 3 beds |
show details | |

|
#32
Acorn Way
Gilroy, CA 95020
|
2,062 sq. feet
|
2 baths 4 beds |
show details | |

|
#33
Soledad St
Gilroy, CA 95020
|
1,219 sq. feet
|
2 baths 3 beds |
show details | |

|
#34
Fowler St
Gilroy, CA 95020
|
1,304 sq. feet
|
2 baths 3 beds |
show details | |

|
#35
Moro Dr
Gilroy, CA 95020
|
1,422 sq. feet
|
2 baths 4 beds |
show details | |

|
#36
W Dunne Ave
Morgan Hill, CA 95037
|
1,215 sq. feet
|
2 baths 3 beds |
show details | |

|
#37
Migues Mountain Ln
Aptos, CA 95003
|
2,106 sq. feet
|
2 baths 3 beds |
show details | |

|
#38
Westwood Dr
Gilroy, CA 95020
|
1,624 sq. feet
|
2 baths 4 beds |
show details | |

|
#39
Westwood Dr Apt 16
Gilroy, CA 95020
|
826 sq. feet
|
1 baths 2 beds |
show details | |

|
#40
Venetian Way
Morgan Hill, CA 95037
|
1,858 sq. feet
|
2 baths 3 beds |
show details |
| Photo | Address | Area | Beds / Baths | Price | Details |
|---|---|---|---|---|---|

|
#41
Rodeo Dr
Gilroy, CA 95020
|
2,658 sq. feet
|
3 baths 5 beds |
show details | |

|
#42
Acorn Way
Gilroy, CA 95020
|
2,104 sq. feet
|
2 baths 4 beds |
show details | |

|
#43
Gaunt Ave
Gilroy, CA 95020
|
1,102 sq. feet
|
2 baths 3 beds |
show details | |

|
#44
Marilyn Ln
Aromas, CA 95004
|
1,801 sq. feet
|
2 baths 3 beds |
show details | |

|
#45
Haight St # B
Castroville, CA 95012
|
958 sq. feet
|
3 baths 5 beds |
show details | |

|
#46
Gaunt Ave
Gilroy, CA 95020
|
1,252 sq. feet
|
2 baths 3 beds |
show details | |

|
#47
Palmer St
Castroville, CA 95012
|
900 sq. feet
|
1 baths 2 beds |
show details | |

|
#48
Canyon Oak Rd
Salinas, CA 93907
|
1,724 sq. feet
|
2 baths 3 beds |
show details | |

|
#49
Silk Oak Pl
Salinas, CA 93907
|
1,966 sq. feet
|
2 baths 4 beds |
show details | |

|
Check over 1 million property listings on Foreclosure.com!
|
browse all offers | |||


 | Santa Rosa vs Santa Cruz (29 replies) |
| Monterey County vs. San Luis Obispo County vs. Santa Cruz County (6 replies) |
| Best Beach for Day-tripping families (20 replies) |
| Rio Del Mar (2 replies) |
| Where's my dream California city? (27 replies) |

Median year apartment built: 1972
Household type by relationship:
Households: 8,866- Male householders: 1,771 (442 living alone), Female householders: 1,972 (672 living alone)
2,173 spouses (2,098 opposite-sex spouses), 160 unmarried partners, (148 opposite-sex unmarried partners), 2,217 children (1,849 natural, 66 adopted, 301 stepchildren), 70 grandchildren, 20 brothers or sisters, 28 parents, 0 foster children, 113 other relatives, 322 non-relatives
- In group quarters: 13
Size of family households: 1,286 2-persons, 615 3-persons, 479 4-persons, 68 5-persons, 47 6-persons, 10 7-or-more-persons.
Size of nonfamily households: 1,127 1-person, 86 2-persons, 68 3-persons.
1,061 married couples with children.
290 single-parent households (74 men, 216 women).
88.2% of residents of Rio del Mar speak English at home.
5.0% of residents speak Spanish at home (77% speak English very well, 21% speak English well, 2% speak English not well).
5.4% of residents speak other Indo-European language at home (88% speak English very well, 9% speak English well, 3% speak English not well).
1.3% of residents speak Asian or Pacific Island language at home (65% speak English very well, 35% speak English well).
0.1% of residents speak other language at home (100% speak English well).
Foreign born population: 756 (8.5%)
(83.6% of them are naturalized citizens)
| Here: | 6.1 |
| State: | 6.0 |
| Here: | 4.5 |
| State: | 3.9 |

- Bedrooms in owner-occupied houses and condos in Rio del Mar, California
- 23no bedroom
- 471 bedroom
- 5622 bedrooms
- 1,8163 bedrooms
- 4934 bedrooms
- 545+ bedrooms

- Bedrooms in renter-occupied apartments in Rio del Mar, California
- 31no bedroom
- 1081 bedroom
- 3072 bedrooms
- 2653 bedrooms
- 804 bedrooms
- 05+ bedrooms

- Cars and other vehicles available in Rio del Mar in owner-occupied houses/condos
- 52no vehicle
- 7911 vehicle
- 1,2282 vehicles
- 6433 vehicles
- 2534 vehicles
- 285+ vehicles

- Cars and other vehicles available in Rio del Mar in renter-occupied apartments
- 29no vehicle
- 3921 vehicle
- 2392 vehicles
- 663 vehicles
- 664 vehicles
- 05+ vehicles

- Rooms in owner-occupied houses in Rio del Mar, California
- 231 room
- 472 rooms
- 333 rooms
- 2634 rooms
- 6895 rooms
- 7796 rooms
- 4737 rooms
- 3978 rooms
- 2929+ rooms

- Rooms in renter-occupied apartments in Rio del Mar, California
- 311 room
- 322 rooms
- 1233 rooms
- 1854 rooms
- 2225 rooms
- 1276 rooms
- 487 rooms
- 198 rooms
- 49+ rooms


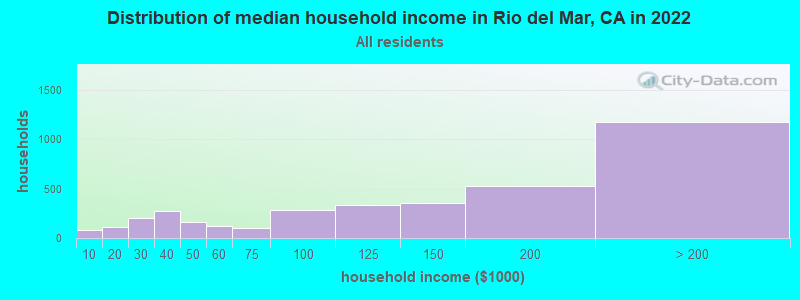
Rio del Mar, CA household income distribution

- 82Less than $10,000
- 109$10,000 to $19,999
- 201$20,000 to $29,999
- 275$30,000 to $39,999
- 167$40,000 to $49,999
- 119$50,000 to $59,999
- 103$60,000 to $74,999
- 285$75,000 to $99,999
- 330$100,000 to $124,999
- 350$125,000 to $149,999
- 524$150,000 to $199,999
- 1,176$200,000 or more
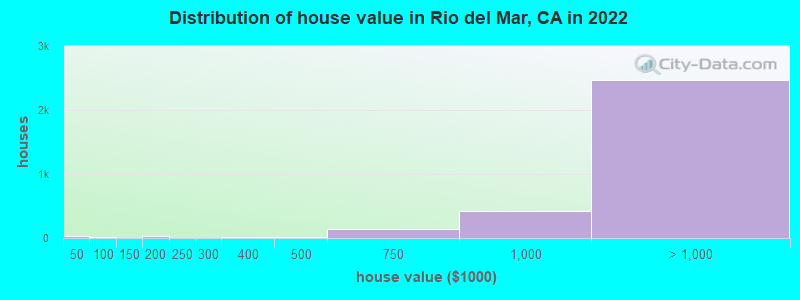
Home value of owner - occupied houses in 2022 in Rio del Mar, CA
-
- 30Less than $10,000
- 18$70,000 to $79,999
- 3$90,000 to $99,999
- 5$125,000 to $149,999
- 36$150,000 to $174,999
- 5$250,000 to $299,999
- 16$300,000 to $399,999
- 17$400,000 to $499,999
- 138$500,000 to $749,999
- 426$750,000 to $999,999
- 1,164$1,000,000 to $1,499,999
- 932$1,500,000 to $1,999,999
- 363$2,000,000 or more
Rent paid by renters in 2022 in Rio del Mar, CA
-
- 29$300 to $349
- 11$350 to $399
- 16$400 to $449
- 54$500 to $549
- 5$550 to $599
- 53$600 to $649
- 35$800 to $899
- 8$900 to $999
- 22$1,250 to $1,499
- 101$1,500 to $1,999
- 44$2,000 to $2,499
- 144$2,500 to $2,999
- 82$3,000 to $3,499
- 250$3,500 or more
- 54No cash rent


Percentage of workers working in this county: 77.8%
Number of people working at home: 1,567 (35.1% of all workers)
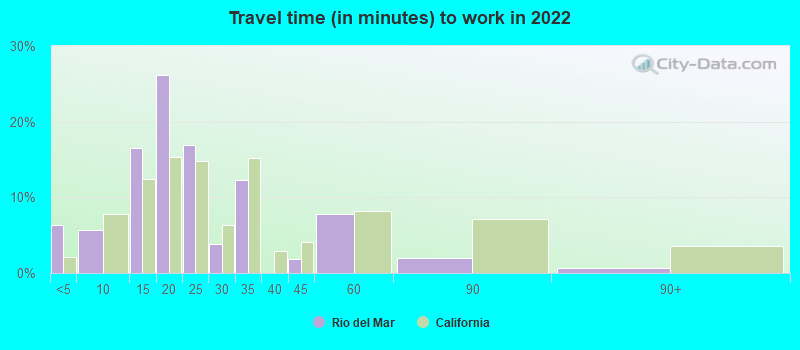
Travel time to work (commute)
- Less than 5 minutes: 96
- 5 to 9 minutes: 175
- 10 to 14 minutes: 306
- 15 to 19 minutes: 623
- 20 to 24 minutes: 527
- 25 to 29 minutes: 24
- 30 to 34 minutes: 238
- 35 to 39 minutes: 33
- 40 to 44 minutes: 276
- 45 to 59 minutes: 389
- 60 to 89 minutes: 169
- 90 or more minutes: 226
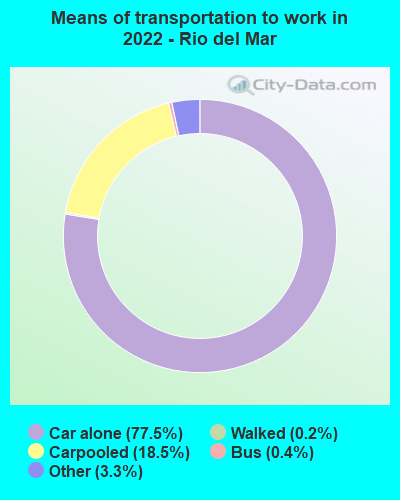
Means of transportation to work:
- Drove a car alone: 865 (34.7%)
- Carpooled: 230 (9.2%)
- Bus: 6 (0.2%)
- Taxi: 40 (1.6%)
- Walked: 2 (0.1%)
- Worked at home: 1,567 (62.8%)

- Unemployment by race in 2022
- Unemployment rate for White non-Hispanic residents
- 4.4%Males
- 3.7%Females
- Unemployment rate for other race residents
- 26.3%Females
- Unemployment rate for two or more race residents
- 6.5%Males
- Unemployment rate for Hispanic or Latino residents
- 9.5%Males

- Year of entry for the foreign-born population in Rio del Mar, California
- 1032010 or later
- 1442000 to 2009
- 901990 to 1999
- 991980 to 1989
- 1381970 to 1979
- 256Before 1970

First ancestries reported:
- Irish: 448 (14.2%)
- English: 317 (10.0%)
- Italian: 315 (10.0%)
- European: 214 (6.8%)
- American: 169 (5.3%)
- German: 139 (4.4%)
- Polish: 81 (2.6%)
- British: 66 (2.1%)
- Danish: 65 (2.1%)
- Norwegian: 57 (1.8%)
- Ukrainian: 52 (1.6%)
- Serbian: 48 (1.5%)
- Portuguese: 39 (1.2%)
- French: 38 (1.2%)
- Russian: 34 (1.1%)
- Swedish: 31 (1.0%)
- Trinidadian and Tobagonian: 30 (0.9%)
- Dutch: 29 (0.9%)
- French Canadian: 29 (0.9%)
- Iranian: 25 (0.8%)
- Scottish: 21 (0.7%)
- Northern European: 20 (0.6%)
- Brazilian: 16 (0.5%)
- Australian: 14 (0.4%)
- Finnish: 14 (0.4%)
- Swiss: 11 (0.3%)
- South African: 10 (0.3%)
- Croatian: 6 (0.2%)
- Scandinavian: 6 (0.2%)
- Lebanese: 5 (0.2%)
- Eastern European: 5 (0.2%)
- Scotch-Irish: 5 (0.2%)
- Welsh: 2 (0.06%)
Most common places of birth for foreign-born residents (%):
| Rio del Mar: | 10.1% (74) |
| California: | 6.6% (684,672) |
| Rio del Mar: | 8.4% (62) |
| California: | 1.2% (127,477) |
| Rio del Mar: | 8.3% (61) |
| California: | 0.0% (4,595) |
| Rio del Mar: | 6.2% (46) |
| California: | 4.2% (440,287) |
| Rio del Mar: | 4.8% (35) |
| California: | 0.6% (60,582) |
| Rio del Mar: | 4.2% (31) |
| California: | 2.0% (206,004) |
| Rio del Mar: | 4.1% (30) |
| California: | 0.2% (23,338) |
| Rio del Mar: | 4.1% (30) |
| California: | 0.2% (16,998) |
| Rio del Mar: | 3.9% (29) |
| California: | 0.6% (57,953) |
| Rio del Mar: | 3.8% (28) |
| California: | 0.2% (17,699) |
| Rio del Mar: | 3.5% (26) |
| California: | 0.7% (73,304) |
| Rio del Mar: | 3.3% (24) |
| California: | 3.0% (315,248) |
| Rio del Mar: | 3.1% (23) |
| California: | 0.2% (20,997) |
| Rio del Mar: | 3.1% (23) |
| California: | 0.1% (9,209) |
| Rio del Mar: | 3.0% (22) |
| California: | 0.7% (74,025) |
| Rio del Mar: | 2.6% (19) |
| California: | 0.1% (6,555) |
| Rio del Mar: | 2.4% (18) |
| California: | 7.8% (818,297) |
| Rio del Mar: | 2.3% (17) |
| California: | 37.2% (3,881,193) |
| Rio del Mar: | 2.2% (16) |
| California: | 0.3% (31,439) |
| Rio del Mar: | 2.2% (16) |
| California: | 0.4% (40,224) |
| Rio del Mar: | 2.0% (15) |
| California: | 0.5% (55,249) |
| Rio del Mar: | 1.6% (12) |
| California: | 5.2% (539,184) |
Place of birth for U.S.-born residents:
- This state: 5,736
- Other state: 2,214
- Northeast: 476
- Midwest: 807
- South: 313
- West: 606
90.4% of Rio del Mar residents lived in the same house 1 years ago.
Out of people who lived in different houses, 22.4% lived in this county.
Out of people who lived in different counties, 85.7% lived in California.
| Rio del Mar: | 90.4% |
| State average: | 88.9% |
Education attainment for males 25 years and older:
- No schooling: 6
- Nursery to 4th grade: 0
- 5th and 6th grade: 0
- 7th and 8th grade: 0
- 9th grade: 0
- 10th grade: 0
- 11th grade: 0
- 12th grade, no diploma: 28
- High school graduate (or equivalency): 266
- Less than 1 year of college: 72
- Some college more than 1 year, no degree: 753
- Associate degree: 183
- Bachelor's degree: 914
- Master's degree: 453
- Professional school degree: 235
- Doctorate degree: 122

Education attainment for females 25 years and older:
- No schooling: 46
- Nursery to 4th grade: 5
- 5th and 6th grade: 0
- 7th and 8th grade: 0
- 9th grade: 0
- 10th grade: 0
- 11th grade: 21
- 12th grade, no diploma: 36
- High school graduate (or equivalency): 175
- Less than 1 year of college: 109
- Some college more than 1 year, no degree: 427
- Associate degree: 242
- Bachelor's degree: 1,221
- Master's degree: 723
- Professional school degree: 264
- Doctorate degree: 119


Housing units in structures:
- One, detached: 3,700
- One, attached: 652
- Two: 58
- 3 or 4: 193
- 5 to 9: 86
- 20 to 49: 29
- 50 or more: 60
- Mobile homes: 40
House/condo owner moved in on average 9 years ago
Renter moved in on average 6 years ago

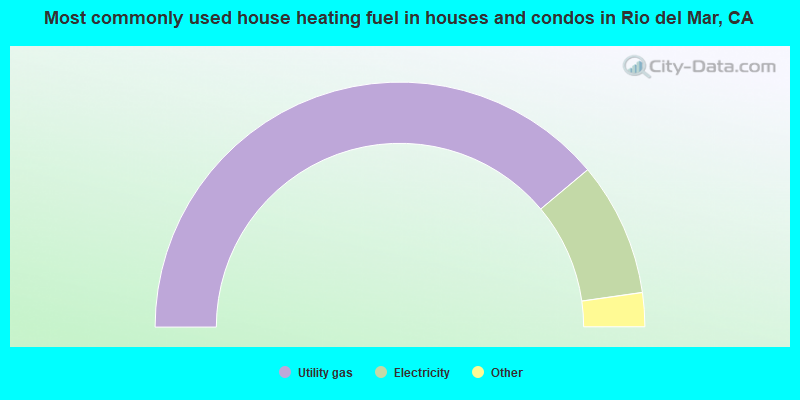
- 77.8%Utility gas
- 17.7%Electricity
- 3.0%Bottled, tank, or LP gas
- 0.8%Fuel oil, kerosene, etc.
- 0.4%Wood
- 0.3%Solar energy
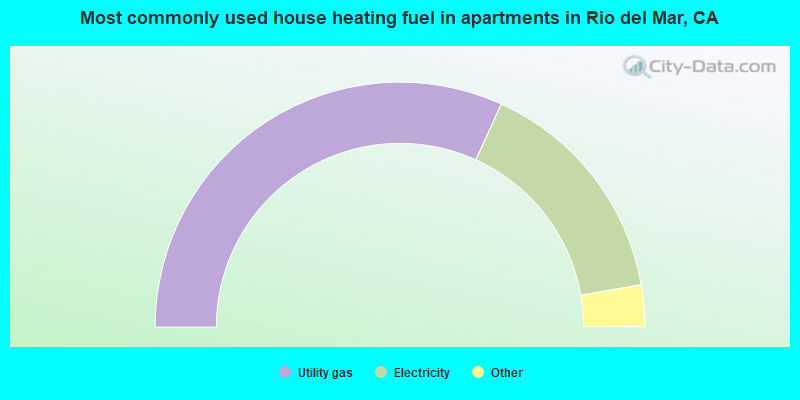
- 63.6%Utility gas
- 30.9%Electricity
- 3.3%Solar energy
- 1.1%Bottled, tank, or LP gas
- 1.0%Wood
Private vs. public school enrollment:
| Here: | 15.0% |
| California: | 10.5% |
| Here: | 27.1% |
| California: | 8.5% |
| Here: | 14.3% |
| California: | 15.9% |


