Housing density: 1,441 houses/condos per square mile
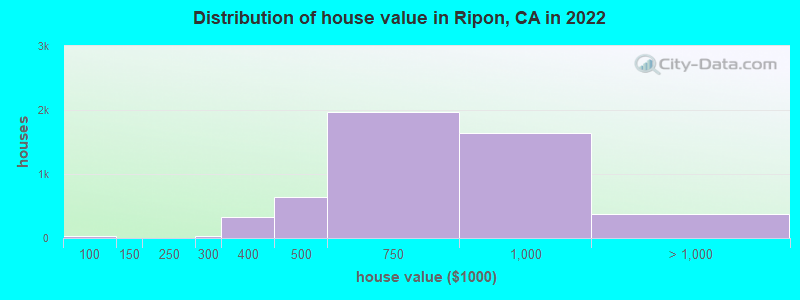
Median price asked for vacant for-sale houses and condos in 2022 in this county: $775,303.
Median contract rent in 2022: $1,551 (lower quartile is $1,264, upper quartile is $1,846)
Median rent asked for vacant for-rent units in 2022: $2,955
Median gross rent in Ripon, CA in 2022: $1,801
Housing units in Ripon with a mortgage: 3,281 (226 second mortgage, 0 home equity loan, 192 both second mortgage and home equity loan) Houses without a mortgage: 0
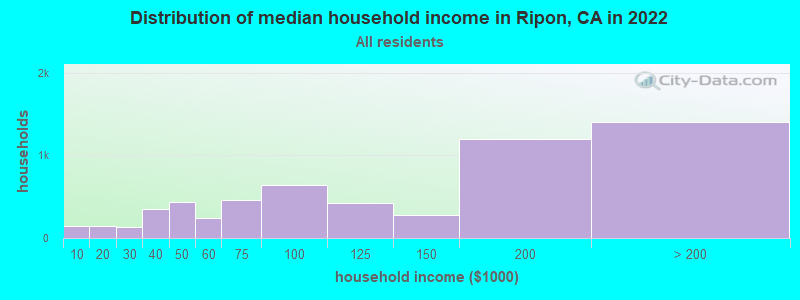
Median household income for houses/condos with a mortgage: $156,519
Median household income for apartments without a mortgage: $79,307
Size of family households: 1,870 2-persons, 1,231 3-persons, 935 4-persons, 375 5-persons, 199 6-persons, 33 7-or-more-persons.
Size of nonfamily households: 831 1-person, 203 2-persons, 9 5-persons.
3,162 married couples with children.
900 single-parent households (332 men, 568 women).
82.2% of residents of Ripon speak English at home.
10.0% of residents speak Spanish at home (58% speak English very well, 19% speak English well, 22% speak English not well, 1% don't speak English at all).
3.6% of residents speak other Indo-European language at home (84% speak English very well, 9% speak English well, 7% speak English not well).
2.5% of residents speak Asian or Pacific Island language at home (80% speak English very well, 6% speak English well, 14% speak English not well).
0.1% of residents speak other language at home (100% speak English very well).
Foreign born population: 1,375 (8.4%)
(66.8% of them are naturalized citizens)
Percentage of workers working in this county: 66.9% Number of people working at home: 849 (10.6% of all workers)
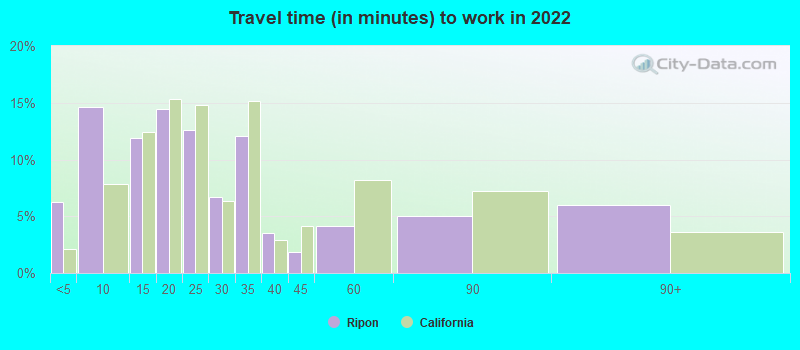
Travel time to work (commute)
Less than 5 minutes: 404
5 to 9 minutes: 940
10 to 14 minutes: 607
15 to 19 minutes: 1,134
20 to 24 minutes: 1,264
25 to 29 minutes: 1,083
30 to 34 minutes: 597
35 to 39 minutes: 160
40 to 44 minutes: 117
45 to 59 minutes: 186
60 to 89 minutes: 406
90 or more minutes: 429
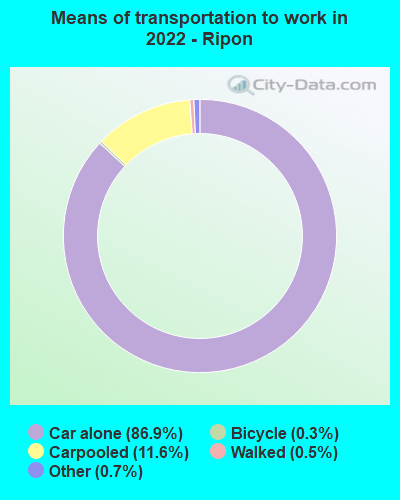
Means of transportation to work:
Drove a car alone: 4,449 (72.6%)
Carpooled: 774 (12.6%)
Taxi: 47 (0.8%)
Bicycle: 16 (0.3%)
Walked: 22 (0.4%)
Worked at home: 849 (13.9%)
Unemployment by race in 2022
Unemployment rate for White non-Hispanic residents
0.9%Males
4.1%Females
Unemployment rate for Asian residents
8.5%Females
Unemployment rate for two or more race residents
2.1%Males
Unemployment rate for Hispanic or Latino residents
3.9%Males
1.6%Females
Year of entry for the foreign-born population in Ripon, California
1402010 or later
3222000 to 2009
3271990 to 1999
2181980 to 1989
1201970 to 1979
260Before 1970
First ancestries reported:
Dutch: 932 (12.9%)
German: 668 (9.2%)
Irish: 495 (6.8%)
Italian: 484 (6.7%)
English: 370 (5.1%)
American: 312 (4.3%)
Portuguese: 213 (2.9%)
European: 191 (2.6%)
Czech: 133 (1.8%)
Scotch-Irish: 111 (1.5%)
Swedish: 60 (0.8%)
Scandinavian: 57 (0.8%)
French Canadian: 36 (0.5%)
French: 33 (0.5%)
Scottish: 24 (0.3%)
Polish: 23 (0.3%)
Northern European: 19 (0.3%)
Czechoslovakian: 16 (0.2%)
Norwegian: 7 (0.10%)
Swiss: 7 (0.10%)
Greek: 5 (0.07%)
Most common places of birth for foreign-born residents (%):
Mexico
Ripon:
33.0% (423)
California:
37.2% (3,881,193)
India
Ripon:
13.5% (173)
California:
5.2% (539,184)
Vietnam
Ripon:
11.8% (151)
California:
4.9% (512,335)
Philippines
Ripon:
7.4% (95)
California:
7.8% (818,297)
Netherlands
Ripon:
6.5% (83)
California:
0.2% (17,937)
Peru
Ripon:
4.6% (59)
California:
0.7% (74,025)
El Salvador
Ripon:
3.4% (44)
California:
4.2% (440,287)
Germany
Ripon:
2.9% (37)
California:
0.7% (73,304)
Nicaragua
Ripon:
2.6% (33)
California:
0.6% (58,161)
Dominican Republic
Ripon:
2.5% (32)
California:
0.1% (7,168)
Brazil
Ripon:
2.1% (27)
California:
0.5% (53,222)
Canada
Ripon:
1.9% (25)
California:
1.2% (127,477)
China, excluding Hong Kong and Taiwan
Ripon:
1.7% (22)
California:
6.6% (684,672)
Place of birth for U.S.-born residents:
This state: 12,260
Other state: 2,147
Northeast: 511
Midwest: 507
South: 520
West: 617
89.7% of Ripon residents lived in the same house 1 years ago. Out of people who lived in different houses, 38.2% lived in this county. Out of people who lived in different counties, 100.0% lived in California.
Ripon:
89.7%
State average:
88.9%
Education attainment for males 25 years and older:
No schooling: 59
Nursery to 4th grade: 16
5th and 6th grade: 88
7th and 8th grade: 51
9th grade: 0
10th grade: 52
11th grade: 84
12th grade, no diploma: 162
High school graduate (or equivalency): 1,489
Less than 1 year of college: 399
Some college more than 1 year, no degree: 1,083
Associate degree: 583
Bachelor's degree: 619
Master's degree: 435
Professional school degree: 110
Doctorate degree: 32
Education attainment for females 25 years and older:
No schooling: 91
Nursery to 4th grade: 19
5th and 6th grade: 72
7th and 8th grade: 23
9th grade: 5
10th grade: 19
11th grade: 34
12th grade, no diploma: 224
High school graduate (or equivalency): 1,180
Less than 1 year of college: 610
Some college more than 1 year, no degree: 1,180
Associate degree: 409
Bachelor's degree: 1,350
Master's degree: 439
Professional school degree: 46
Doctorate degree: 180
Housing units in structures:
One, detached: 4,778
One, attached: 182
Two: 101
3 or 4: 304
5 to 9: 212
10 to 19: 85
20 to 49: 153
50 or more: 78
Mobile homes: 14
Housing units lacking complete plumbing facilities in 2022: 0.3%
Housing units lacking complete kitchen facilities in 2022: 1.2%
House/condo owner moved in on average 10 years ago