River Grove, IL (Illinois) Houses and Residents
| River Grove: | $247,010 |
| Illinois: | $251,600 |
Mean price in 2022:
Detached houses: $269,007
Here: $269,007 State: $310,164 Townhouses or other attached units: $292,439
Here: $292,439 State: $286,230 In 2-unit structures: $292,180
Here: $292,180 State: $299,638 In 3-to-4-unit structures: $401,682
Here: $401,682 State: $330,907 In 5-or-more-unit structures: $145,840
Here: $145,840 State: $318,887
Total population: 10,271 (All urban)
Houses: 4,210 (3,838 occupied: 2,342 owner occupied, 1,561 renter occupied)
| % of renters here: | 40% |
| State: | 33% |
Housing density: 1,764 houses/condos per square mile
Median price asked for vacant for-sale houses and condos in 2022: $505,369.
Median contract rent in 2022: $1,161 (lower quartile is $955, upper quartile is $1,408)
Median rent asked for vacant for-rent units in 2022: $1,228
Median gross rent in River Grove, IL in 2022: $1,238
Housing units in River Grove with a mortgage: 1,547 (129 second mortgage, 14 home equity loan, 60 both second mortgage and home equity loan)
Houses without a mortgage: 10
Median household income for houses/condos with a mortgage: $83,765
Median household income for apartments without a mortgage: $45,003
Median monthly housing costs: $1,265
Compare current foreclosures in River Grove, IL:
| Photo | Address | Area | Beds / Baths | Price | Details |
|---|---|---|---|---|---|

|
#1
Auxplaines
River Grove, IL 60171
|
4,320 sq. feet
|
6 baths - beds |
show details | |

|
#2
Wood St
River Grove, IL 60171
|
1,390 sq. feet
|
1 baths - beds |
show details | |

|
#3
N Auxplaines St
River Grove, IL 60171
|
4,320 sq. feet
|
6 baths - beds |
show details | |

|
#4
Clinton St
River Grove, IL 60171
|
1,574 sq. feet
|
1 baths - beds |
show details | |

|
#5
Hessing St
River Grove, IL 60171
|
2,200 sq. feet
|
2 baths - beds |
show details | |

|
#6
Erie St
River Grove, IL 60171
|
1,317 sq. feet
|
1 baths - beds |
show details | |

|
#7
Oconnor Dr Apt 2r
River Grove, IL 60171
|
4,200 sq. feet
|
6 baths - beds |
show details | |

|
#8
Leyden Ave
River Grove, IL 60171
|
1,494 sq. feet
|
1 baths - beds |
show details | |

|
#9
Thatcher Ave
River Grove, IL 60171
|
4,179 sq. feet
|
6 baths - beds |
show details | |

|
#10
Belden Ave
River Grove, IL 60171
|
841 sq. feet
|
1 baths - beds |
show details |
| Photo | Address | Area | Beds / Baths | Price | Details |
|---|---|---|---|---|---|

|
#11
West St
River Grove, IL 60171
|
810 sq. feet
|
1 baths - beds |
show details | |

|
#12
Wrightwood Ave
River Grove, IL 60171
|
1,680 sq. feet
|
1 baths - beds |
show details | |

|
#13
Maple St
River Grove, IL 60171
|
1,496 sq. feet
|
1 baths - beds |
show details | |

|
#14
Grove St
River Grove, IL 60171
|
1,025 sq. feet
|
1 baths - beds |
show details | |

|
#15
Budd St
River Grove, IL 60171
|
1,070 sq. feet
|
1 baths - beds |
show details | |

|
#16
Beulah Ave
River Grove, IL 60171
|
925 sq. feet
|
1 baths - beds |
show details | |

|
#17
Grove St
River Grove, IL 60171
|
1,074 sq. feet
|
1 baths - beds |
show details | |

|
#18
Clarke St
River Grove, IL 60171
|
1,126 sq. feet
|
1 baths - beds |
show details | |

|
#19
Davisson St
River Grove, IL 60171
|
1,008 sq. feet
|
1 baths - beds |
show details | |

|
#20
Lyndale St
River Grove, IL 60171
|
958 sq. feet
|
1 baths - beds |
show details |
| Photo | Address | Area | Beds / Baths | Price | Details |
|---|---|---|---|---|---|

|
#21
Thatcher Ave
River Grove, IL 60171
|
- sq. feet
|
- baths - beds |
show details | |

|
#22
Grand Ave # 104
River Grove, IL 60171
|
- sq. feet
|
- baths - beds |
show details | |

|
#23
Thatcher Ave Ste 306
River Grove, IL 60171
|
- sq. feet
|
- baths - beds |
show details | |

|
#24
Spruce St
River Grove, IL 60171
|
- sq. feet
|
- baths - beds |
show details | |

|
#25
Grand Ave Apt 3a
River Grove, IL 60171
|
- sq. feet
|
- baths - beds |
show details | |

|
#26
Davisson St # 45
River Grove, IL 60171
|
- sq. feet
|
- baths - beds |
show details | |

|
#27
Enger Ln Apt 2r
River Grove, IL 60171
|
- sq. feet
|
- baths - beds |
show details | |

|
#28
Oconnor Dr Apt 1nw
River Grove, IL 60171
|
- sq. feet
|
- baths - beds |
show details | |

|
#29
Carey Ave
River Grove, IL 60171
|
- sq. feet
|
- baths - beds |
show details | |

|
#30
N Thatcher Ave
River Grove, IL 60171
|
- sq. feet
|
- baths - beds |
show details |
| Photo | Address | Area | Beds / Baths | Price | Details |
|---|---|---|---|---|---|

|
#31
Elm St Apt 3
River Grove, IL 60171
|
- sq. feet
|
- baths - beds |
show details | |

|
#32
Oconnor Dr Apt 6c
River Grove, IL 60171
|
- sq. feet
|
- baths - beds |
show details | |

|
Check over 1 million property listings on Foreclosure.com!
|
browse all offers | |||


 | Fox River Grove?? (1 reply) |
| Suburb thoughts? South Elgin/Fox River Grove/Crystal Lake or somewhere else? (10 replies) |
| Gay Couple Moving to Chicago. Advise Please. (19 replies) |
| Other towns with housing similar to Oak Park. (19 replies) |
| Working in Franklin Park-Best suburb to buy a house? (5 replies) |
| Lake Barrington - Any pro's and con's about it? (2 replies) |

Median year apartment built: 1970
Household type by relationship:
Households: 10,298- Male householders: 1,540 (437 living alone), Female householders: 2,197 (744 living alone)
1,824 spouses (1,758 opposite-sex spouses), 285 unmarried partners, (265 opposite-sex unmarried partners), 3,590 children (3,483 natural, 15 adopted, 90 stepchildren), 115 grandchildren, 281 brothers or sisters, 175 parents, 0 foster children, 88 other relatives, 180 non-relatives
- In group quarters: 18
Size of family households: 781 2-persons, 581 3-persons, 574 4-persons, 410 5-persons, 81 6-persons, 58 7-or-more-persons.
Size of nonfamily households: 1,268 1-person, 117 2-persons.
1,712 married couples with children.
758 single-parent households (124 men, 634 women).
51.1% of residents of River Grove speak English at home.
22.6% of residents speak Spanish at home (76% speak English very well, 11% speak English well, 13% speak English not well).
23.1% of residents speak other Indo-European language at home (47% speak English very well, 27% speak English well, 23% speak English not well, 3% don't speak English at all).
0.8% of residents speak Asian or Pacific Island language at home (78% speak English very well, 22% speak English well).
2.8% of residents speak other language at home (84% speak English very well, 10% speak English well, 5% speak English not well).
Foreign born population: 3,023 (29.4%)
(57.3% of them are naturalized citizens)
| Here: | 5.6 |
| State: | 6.4 |
| Here: | 4.4 |
| State: | 4.1 |

- Bedrooms in owner-occupied houses and condos in River Grove, Illinois
- 0no bedroom
- 3051 bedroom
- 8742 bedrooms
- 7673 bedrooms
- 3364 bedrooms
- 595+ bedrooms

- Bedrooms in renter-occupied apartments in River Grove, Illinois
- 168no bedroom
- 2051 bedroom
- 7582 bedrooms
- 2683 bedrooms
- 1634 bedrooms
- 05+ bedrooms

- Cars and other vehicles available in River Grove in owner-occupied houses/condos
- 190no vehicle
- 6691 vehicle
- 1,0072 vehicles
- 2873 vehicles
- 1254 vehicles
- 645+ vehicles

- Cars and other vehicles available in River Grove in renter-occupied apartments
- 133no vehicle
- 7181 vehicle
- 4612 vehicles
- 1223 vehicles
- 1294 vehicles
- 05+ vehicles

- Rooms in owner-occupied houses in River Grove, Illinois
- 01 room
- 192 rooms
- 2133 rooms
- 5224 rooms
- 3825 rooms
- 5466 rooms
- 3337 rooms
- 1388 rooms
- 1889+ rooms

- Rooms in renter-occupied apartments in River Grove, Illinois
- 1231 room
- 322 rooms
- 2063 rooms
- 4094 rooms
- 4815 rooms
- 1836 rooms
- 07 rooms
- 08 rooms
- 1299+ rooms


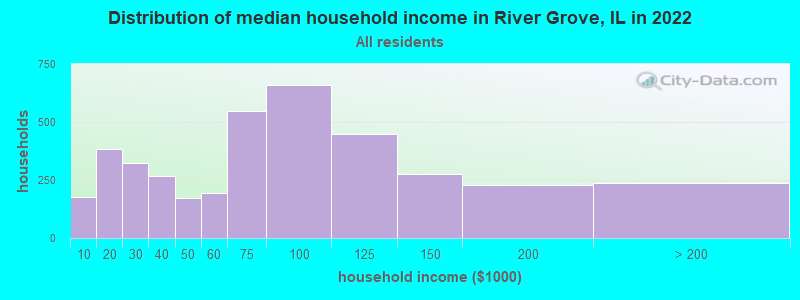
River Grove, IL household income distribution

- 178Less than $10,000
- 383$10,000 to $19,999
- 324$20,000 to $29,999
- 269$30,000 to $39,999
- 172$40,000 to $49,999
- 196$50,000 to $59,999
- 546$60,000 to $74,999
- 661$75,000 to $99,999
- 448$100,000 to $124,999
- 275$125,000 to $149,999
- 230$150,000 to $199,999
- 235$200,000 or more
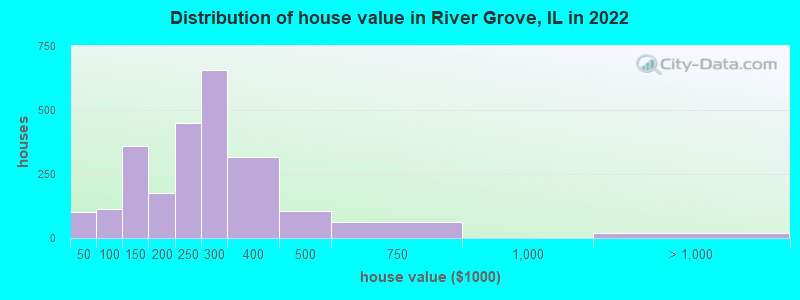
Home value of owner - occupied houses in 2022 in River Grove, IL
-
- 28Less than $10,000
- 17$20,000 to $24,999
- 56$40,000 to $49,999
- 21$70,000 to $79,999
- 33$80,000 to $89,999
- 195$100,000 to $124,999
- 162$125,000 to $149,999
- 96$150,000 to $174,999
- 79$175,000 to $199,999
- 448$200,000 to $249,999
- 656$250,000 to $299,999
- 315$300,000 to $399,999
- 106$400,000 to $499,999
- 61$500,000 to $749,999
- 18$2,000,000 or more
Rent paid by renters in 2022 in River Grove, IL
-
- 6$650 to $699
- 69$700 to $749
- 216$800 to $899
- 158$900 to $999
- 424$1,000 to $1,249
- 317$1,250 to $1,499
- 173$1,500 to $1,999
- 28$2,000 to $2,499
- 28$3,000 to $3,499
- 156No cash rent


Percentage of workers working in this county: 90.4%
Number of people working at home: 641 (12.9% of all workers)
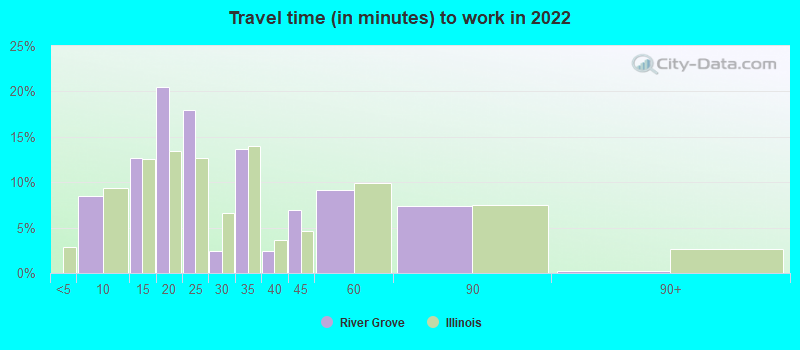
Travel time to work (commute)
- Less than 5 minutes: 22
- 5 to 9 minutes: 198
- 10 to 14 minutes: 362
- 15 to 19 minutes: 437
- 20 to 24 minutes: 484
- 25 to 29 minutes: 155
- 30 to 34 minutes: 1,013
- 35 to 39 minutes: 98
- 40 to 44 minutes: 505
- 45 to 59 minutes: 448
- 60 to 89 minutes: 346
- 90 or more minutes: 132
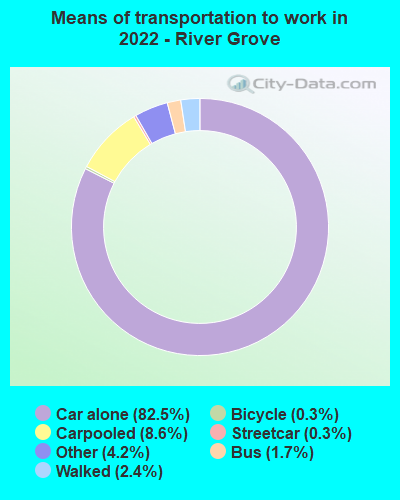
Means of transportation to work:
- Drove a car alone: 1,924 (66.8%)
- Carpooled: 215 (7.5%)
- Bus: 36 (1.2%)
- Subway or elevated rail: 5 (0.2%)
- Taxi: 98 (3.4%)
- Bicycle: 7 (0.2%)
- Walked: 58 (2.0%)
- Worked at home: 641 (22.2%)

- Unemployment by race in 2022
- Unemployment rate for White non-Hispanic residents
- 4.2%Males
- 4.7%Females
- Unemployment rate for other race residents
- 12.0%Males
- Unemployment rate for Hispanic or Latino residents
- 4.3%Males

- Year of entry for the foreign-born population in River Grove, Illinois
- 9292010 or later
- 5912000 to 2009
- 6481990 to 1999
- 4971980 to 1989
- 2501970 to 1979
- 417Before 1970
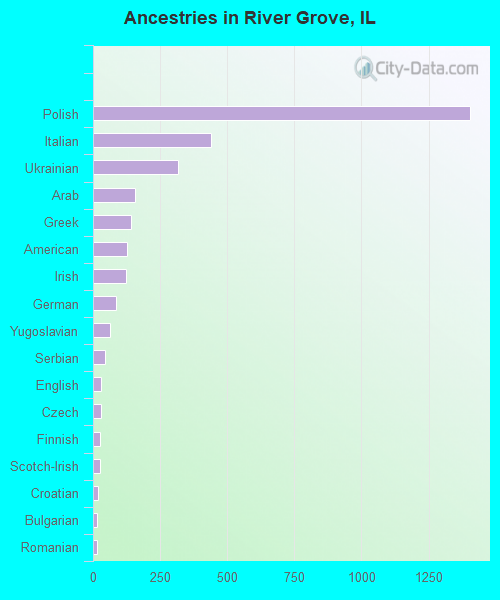
First ancestries reported:
- Polish: 1,405 (22.1%)
- Italian: 439 (6.9%)
- Ukrainian: 318 (5.0%)
- Arab: 158 (2.5%)
- Greek: 141 (2.2%)
- American: 125 (2.0%)
- Irish: 123 (1.9%)
- German: 86 (1.4%)
- Yugoslavian: 64 (1.0%)
- Serbian: 46 (0.7%)
- English: 31 (0.5%)
- Czech: 30 (0.5%)
- Finnish: 26 (0.4%)
- Scotch-Irish: 25 (0.4%)
- Croatian: 18 (0.3%)
- Bulgarian: 16 (0.3%)
- Romanian: 16 (0.3%)
- Austrian: 8 (0.1%)
- Russian: 8 (0.1%)
- Danish: 7 (0.1%)
- French: 3 (0.05%)
Most common places of birth for foreign-born residents (%):
| River Grove: | 37.3% (1,129) |
| Illinois: | 6.9% (124,474) |
| River Grove: | 16.0% (483) |
| Illinois: | 34.7% (626,958) |
| River Grove: | 11.9% (361) |
| Illinois: | 0.5% (9,688) |
| River Grove: | 10.9% (328) |
| Illinois: | 1.6% (29,316) |
| River Grove: | 8.8% (266) |
| Illinois: | 0.9% (16,553) |
| River Grove: | 6.8% (207) |
| Illinois: | 0.1% (1,954) |
| River Grove: | 2.9% (89) |
| Illinois: | 0.1% (2,465) |
| River Grove: | 2.9% (88) |
| Illinois: | 0.6% (10,720) |
| River Grove: | 2.4% (73) |
| Illinois: | 1.3% (22,793) |
| River Grove: | 2.1% (64) |
| Illinois: | 5.2% (93,003) |
| River Grove: | 1.8% (53) |
| Illinois: | 0.6% (10,776) |
Place of birth for U.S.-born residents:
- This state: 6,168
- Other state: 834
- Northeast: 110
- Midwest: 208
- South: 350
- West: 151
90.1% of River Grove residents lived in the same house 1 years ago.
Out of people who lived in different houses, 47.7% lived in this county.
Out of people who lived in different counties, 62.4% lived in Illinois.
| River Grove: | 90.1% |
| State average: | 88.3% |
Education attainment for males 25 years and older:
- No schooling: 62
- Nursery to 4th grade: 0
- 5th and 6th grade: 24
- 7th and 8th grade: 40
- 9th grade: 41
- 10th grade: 26
- 11th grade: 41
- 12th grade, no diploma: 41
- High school graduate (or equivalency): 1,256
- Less than 1 year of college: 175
- Some college more than 1 year, no degree: 428
- Associate degree: 353
- Bachelor's degree: 586
- Master's degree: 124
- Professional school degree: 22
- Doctorate degree: 0

Education attainment for females 25 years and older:
- No schooling: 60
- Nursery to 4th grade: 0
- 5th and 6th grade: 26
- 7th and 8th grade: 41
- 9th grade: 10
- 10th grade: 33
- 11th grade: 13
- 12th grade, no diploma: 124
- High school graduate (or equivalency): 946
- Less than 1 year of college: 289
- Some college more than 1 year, no degree: 671
- Associate degree: 388
- Bachelor's degree: 759
- Master's degree: 128
- Professional school degree: 22
- Doctorate degree: 0


Housing units in structures:
- One, detached: 1,980
- One, attached: 55
- Two: 113
- 3 or 4: 265
- 5 to 9: 947
- 10 to 19: 364
- 20 to 49: 279
- 50 or more: 205
Housing units lacking complete kitchen facilities in 2022: 2.8%
House/condo owner moved in on average 16 years ago
Renter moved in on average 1 years ago

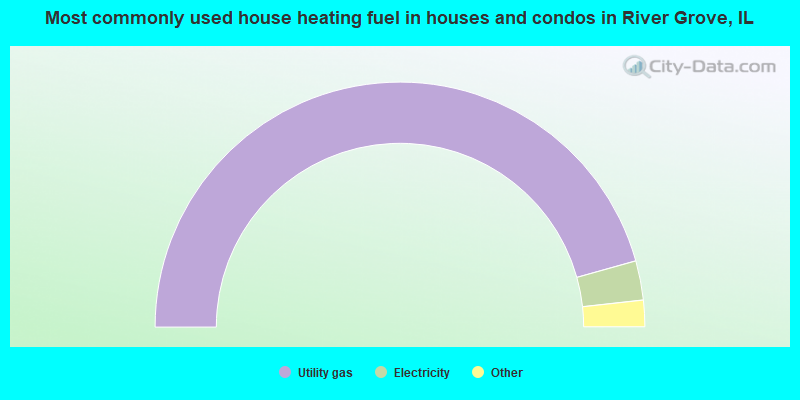
- 91.3%Utility gas
- 5.2%Electricity
- 1.8%Bottled, tank, or LP gas
- 1.0%Other fuel
- 0.7%No fuel used
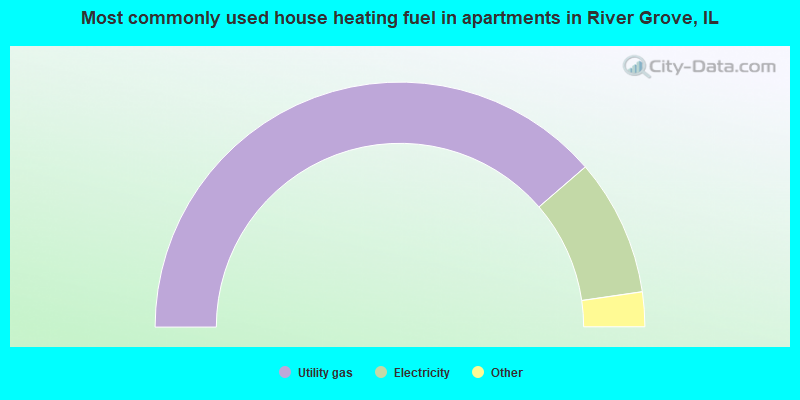
- 77.4%Utility gas
- 18.1%Electricity
- 3.1%Other fuel
- 1.4%Bottled, tank, or LP gas
Private vs. public school enrollment:
| Here: | 14.3% |
| Illinois: | 13.3% |
| Here: | 7.6% |
| Illinois: | 9.9% |
| Here: | 32.9% |
| Illinois: | 27.4% |


