Riverbank, CA (California) Houses and Residents
| Riverbank: | $471,327 |
| California: | $715,900 |
Mean price in 2022:
Detached houses: $377,139
Here: $377,139 State: $988,808 Townhouses or other attached units: $301,123
Here: $301,123 State: $838,546 Mobile homes: $70,649
Here: $70,649 State: $184,506
Total population: 23,798 (Urban population: 15,747, Rural population: 110 (all nonfarm))
Houses: 7,510 (7,368 occupied: 5,111 owner occupied, 2,259 renter occupied)
| % of renters here: | 31% |
| State: | 44% |
Housing density: 2,416 houses/condos per square mile
Median price asked for vacant for-sale houses and condos in 2022: $404,751.
Median contract rent in 2022: $1,188 (lower quartile is $796, upper quartile is $1,751)
Median rent asked for vacant for-rent units in 2022: $3,015
Median gross rent in Riverbank, CA in 2022: $1,429
Housing units in Riverbank with a mortgage: 3,882 (213 second mortgage, 0 home equity loan, 219 both second mortgage and home equity loan)
Houses without a mortgage: 0
Median household income for houses/condos with a mortgage: $115,649
Median household income for apartments without a mortgage: $64,470
Median monthly housing costs: $1,665
Compare current foreclosures near Riverbank, CA:
| Photo | Address | Area | Beds / Baths | Price | Details |
|---|---|---|---|---|---|

|
#1
Stanislaus St
Riverbank, CA 95367
|
1,320 sq. feet
|
2 baths 3 beds |
show details | |

|
#2
River Cove Dr
Riverbank, CA 95367
|
1,377 sq. feet
|
2 baths 3 beds |
show details | |

|
#3
Van Dusen Ave
Riverbank, CA 95367
|
1,507 sq. feet
|
2 baths 3 beds |
show details | |

|
#4
Colony Manor Dr
Riverbank, CA 95367
|
2,340 sq. feet
|
2 baths 4 beds |
show details | |

|
#5
Dunbar Ln
Riverbank, CA 95367
|
2,213 sq. feet
|
2 baths 4 beds |
show details | |

|
#6
Saxon Way
Riverbank, CA 95367
|
3,205 sq. feet
|
3 baths 5 beds |
show details | |

|
#7
Kansas Ave
Riverbank, CA 95367
|
1,326 sq. feet
|
3 baths 6 beds |
show details | |

|
#8
Carnwood Dr
Riverbank, CA 95367
|
1,259 sq. feet
|
2 baths 3 beds |
show details | |

|
#9
Topeka St
Riverbank, CA 95367
|
940 sq. feet
|
1 baths 2 beds |
show details | |

|
#10
Clydesdale Ln
Riverbank, CA 95367
|
1,755 sq. feet
|
2 baths 3 beds |
show details |
| Photo | Address | Area | Beds / Baths | Price | Details |
|---|---|---|---|---|---|

|
#11
Kentucky Ave
Riverbank, CA 95367
|
840 sq. feet
|
1 baths 2 beds |
show details | |

|
#12
Hull Ct
Riverbank, CA 95367
|
2,038 sq. feet
|
2 baths 4 beds |
show details | |

|
#13
Turpin Ave
Riverbank, CA 95367
|
1,100 sq. feet
|
2 baths 3 beds |
show details | |

|
#14
Estelle Ave
Riverbank, CA 95367
|
1,828 sq. feet
|
2 baths 3 beds |
show details | |

|
#15
Van Dusen Ave
Riverbank, CA 95367
|
1,307 sq. feet
|
2 baths 3 beds |
show details | |

|
#16
Santa Fe St
Riverbank, CA 95367
|
864 sq. feet
|
1 baths 3 beds |
show details | |

|
#17
Preakness Dr
Riverbank, CA 95367
|
1,086 sq. feet
|
2 baths 3 beds |
show details | |

|
#18
Nickels Ct
Riverbank, CA 95367
|
1,314 sq. feet
|
2 baths 3 beds |
show details | |

|
#19
Riverside Dr
Riverbank, CA 95367
|
- sq. feet
|
- baths - beds |
show details | |

|
#20
California Ave
Riverbank, CA 95367
|
- sq. feet
|
- baths - beds |
show details |
| Photo | Address | Area | Beds / Baths | Price | Details |
|---|---|---|---|---|---|

|
#21
Newbrook Cir Spc 138
Riverbank, CA 95367
|
- sq. feet
|
- baths - beds |
show details | |

|
#22
Kentucky Ave
Riverbank, CA 95367
|
- sq. feet
|
- baths - beds |
show details | |

|
#23
Donner Trl
Riverbank, CA 95367
|
- sq. feet
|
- baths - beds |
show details | |

|
#24
San Martin Dr
Modesto, CA 95358
|
1,452 sq. feet
|
2 baths 3 beds |
$317,200
|
show details |

|
#25
Mayette Ave
Modesto, CA 95351
|
1,080 sq. feet
|
1 baths 2 beds |
$223,000
|
show details |

|
#26
Wildwood Dr
Modesto, CA 95350
|
1,679 sq. feet
|
2 baths 3 beds |
$345,000
|
show details |

|
#27
Ward Ave
Riverbank, CA 95367
|
- sq. feet
|
- baths - beds |
show details | |

|
#28
Tasmania Way
Modesto, CA 95356
|
1,531 sq. feet
|
2 baths 3 beds |
show details | |

|
#29
Shady Ln Apt 1022
Turlock, CA 95382
|
1,136 sq. feet
|
2 baths 2 beds |
show details | |

|
#30
Golden Gate Dr
Modesto, CA 95350
|
1,530 sq. feet
|
2 baths 3 beds |
show details |
| Photo | Address | Area | Beds / Baths | Price | Details |
|---|---|---|---|---|---|

|
#31
Emerson Ave
Modesto, CA 95350
|
889 sq. feet
|
1 baths 3 beds |
show details | |

|
#32
Attika St
Ceres, CA 95307
|
2,924 sq. feet
|
2 baths 4 beds |
show details | |

|
#33
Ronald Ct
Modesto, CA 95350
|
1,607 sq. feet
|
3 baths 3 beds |
show details | |

|
#34
Lannis Ct
Ripon, CA 95366
|
1,324 sq. feet
|
2 baths 4 beds |
show details | |

|
#35
6th St
Hughson, CA 95326
|
- sq. feet
|
2 baths 3 beds |
show details | |

|
#36
Brooks Ln
Ripon, CA 95366
|
3,262 sq. feet
|
3 baths 4 beds |
show details | |

|
#37
W Colony Rd
Ripon, CA 95366
|
2,881 sq. feet
|
3 baths 5 beds |
show details | |

|
#38
Pedras Rd
Turlock, CA 95382
|
1,684 sq. feet
|
1 baths 3 beds |
show details | |

|
#39
5th St
Modesto, CA 95351
|
1,200 sq. feet
|
1 baths 3 beds |
show details | |

|
#40
Empire Ave
Modesto, CA 95354
|
768 sq. feet
|
1 baths 2 beds |
show details |
| Photo | Address | Area | Beds / Baths | Price | Details |
|---|---|---|---|---|---|

|
#41
Fern Dell Ln
Manteca, CA 95336
|
1,343 sq. feet
|
2 baths 4 beds |
show details | |

|
#42
Tully Rd
Modesto, CA 95350
|
1,161 sq. feet
|
1 baths 3 beds |
show details | |

|
#43
Ustick Rd
Modesto, CA 95358
|
1,136 sq. feet
|
2 baths 3 beds |
show details | |

|
#44
Miller Ave
Modesto, CA 95354
|
990 sq. feet
|
1 baths 2 beds |
show details | |

|
#45
Pleasant Ave
Ceres, CA 95307
|
1,484 sq. feet
|
2 baths 4 beds |
show details | |

|
#46
Fallen Oak Dr
Modesto, CA 95355
|
3,074 sq. feet
|
3 baths 5 beds |
show details | |

|
#47
Liselle Ln
Modesto, CA 95358
|
1,469 sq. feet
|
3 baths 4 beds |
show details | |

|
#48
Rouse Ave
Modesto, CA 95351
|
1,352 sq. feet
|
2 baths 3 beds |
show details | |

|
#49
Suffolk Dr
Ceres, CA 95307
|
1,606 sq. feet
|
2 baths 4 beds |
show details | |

|
Check over 1 million property listings on Foreclosure.com!
|
browse all offers | |||

Latest news about housing in Riverbank, CA collected exclusively by city-data.com from local newspapers, TV, and radio stations

 | Looking to rent a house in the Central Valley (1 reply) |
| Denver to Modesto area (39 replies) |
| Cheapest place to rent anywhere in CA (42 replies) |
| Moving to Modesto, CA from Bakersfield, CA (12 replies) |
| Modesto and surrounding burbs - best areas to consider (6 replies) |
| Possibly moving to Modesto, need advice! (26 replies) |

Median year apartment built: 1994
Household type by relationship:
Households: 24,767- Male householders: 3,427 (489 living alone), Female householders: 3,876 (775 living alone)
4,416 spouses (4,376 opposite-sex spouses), 739 unmarried partners, (706 opposite-sex unmarried partners), 9,874 children (9,000 natural, 129 adopted, 744 stepchildren), 584 grandchildren, 293 brothers or sisters, 509 parents, 40 foster children, 511 other relatives, 224 non-relatives
- In group quarters: 268
Size of family households: 1,373 2-persons, 1,426 3-persons, 1,266 4-persons, 806 5-persons, 552 6-persons, 262 7-or-more-persons.
Size of nonfamily households: 1,261 1-person, 287 2-persons, 28 3-persons, 5 4-persons.
5,148 married couples with children.
1,614 single-parent households (311 men, 1,303 women).
50.8% of residents of Riverbank speak English at home.
41.5% of residents speak Spanish at home (66% speak English very well, 11% speak English well, 14% speak English not well, 9% don't speak English at all).
1.4% of residents speak other Indo-European language at home (71% speak English very well, 9% speak English well, 18% speak English not well, 2% don't speak English at all).
4.2% of residents speak Asian or Pacific Island language at home (60% speak English very well, 23% speak English well, 8% speak English not well, 9% don't speak English at all).
0.8% of residents speak other language at home (62% speak English very well, 18% speak English well, 20% speak English not well).
Foreign born population: 5,607 (22.6%)
(54.5% of them are naturalized citizens)
| Here: | 6.3 |
| State: | 6.0 |
| Here: | 5.1 |
| State: | 3.9 |

- Bedrooms in owner-occupied houses and condos in Riverbank, California
- 22no bedroom
- 181 bedroom
- 3512 bedrooms
- 2,6893 bedrooms
- 1,6324 bedrooms
- 3995+ bedrooms

- Bedrooms in renter-occupied apartments in Riverbank, California
- 118no bedroom
- 3221 bedroom
- 4832 bedrooms
- 9133 bedrooms
- 1874 bedrooms
- 2365+ bedrooms

- Cars and other vehicles available in Riverbank in owner-occupied houses/condos
- 47no vehicle
- 9231 vehicle
- 1,8822 vehicles
- 1,3583 vehicles
- 6484 vehicles
- 2525+ vehicles

- Cars and other vehicles available in Riverbank in renter-occupied apartments
- 154no vehicle
- 7501 vehicle
- 1,0082 vehicles
- 2123 vehicles
- 1034 vehicles
- 335+ vehicles

- Rooms in owner-occupied houses in Riverbank, California
- 01 room
- 272 rooms
- 533 rooms
- 5154 rooms
- 1,1855 rooms
- 1,1526 rooms
- 8997 rooms
- 7778 rooms
- 5039+ rooms

- Rooms in renter-occupied apartments in Riverbank, California
- 1181 room
- 452 rooms
- 2953 rooms
- 2984 rooms
- 5875 rooms
- 4416 rooms
- 1337 rooms
- 1398 rooms
- 2029+ rooms


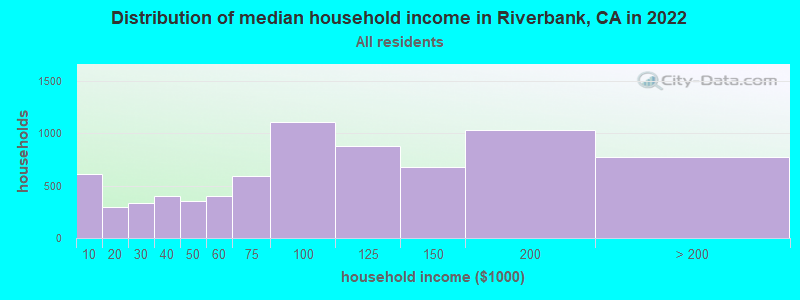
Riverbank, CA household income distribution

- 605Less than $10,000
- 299$10,000 to $19,999
- 329$20,000 to $29,999
- 403$30,000 to $39,999
- 351$40,000 to $49,999
- 400$50,000 to $59,999
- 591$60,000 to $74,999
- 1,105$75,000 to $99,999
- 872$100,000 to $124,999
- 677$125,000 to $149,999
- 1,025$150,000 to $199,999
- 770$200,000 or more
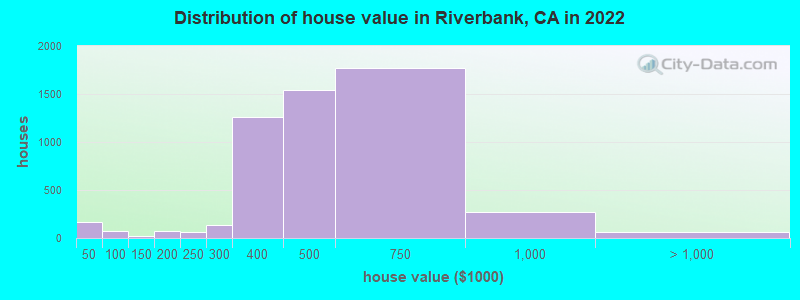
Home value of owner - occupied houses in 2022 in Riverbank, CA
-
- 81Less than $10,000
- 24$10,000 to $14,999
- 6$20,000 to $24,999
- 11$25,000 to $29,999
- 11$30,000 to $34,999
- 32$35,000 to $39,999
- 20$50,000 to $59,999
- 10$60,000 to $69,999
- 18$80,000 to $89,999
- 23$90,000 to $99,999
- 6$100,000 to $124,999
- 10$125,000 to $149,999
- 74$150,000 to $174,999
- 3$175,000 to $199,999
- 58$200,000 to $249,999
- 138$250,000 to $299,999
- 1,260$300,000 to $399,999
- 1,544$400,000 to $499,999
- 1,766$500,000 to $749,999
- 273$750,000 to $999,999
- 18$1,000,000 to $1,499,999
- 6$1,500,000 to $1,999,999
- 34$2,000,000 or more
Rent paid by renters in 2022 in Riverbank, CA
-
- 28$100 to $149
- 42$200 to $249
- 197$250 to $299
- 6$300 to $349
- 16$350 to $399
- 5$400 to $449
- 51$450 to $499
- 69$500 to $549
- 15$550 to $599
- 43$600 to $649
- 9$650 to $699
- 20$700 to $749
- 92$750 to $799
- 202$800 to $899
- 169$900 to $999
- 247$1,000 to $1,249
- 251$1,250 to $1,499
- 517$1,500 to $1,999
- 233$2,000 to $2,499
- 10$2,500 to $2,999
- 5$3,500 or more
- 63No cash rent


Percentage of workers working in this county: 74.3%
Number of people working at home: 728 (6.8% of all workers)
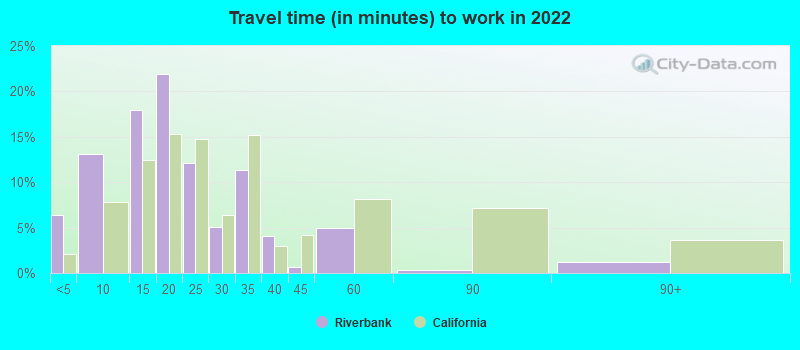
Travel time to work (commute)
- Less than 5 minutes: 259
- 5 to 9 minutes: 645
- 10 to 14 minutes: 1,131
- 15 to 19 minutes: 2,117
- 20 to 24 minutes: 1,466
- 25 to 29 minutes: 808
- 30 to 34 minutes: 1,811
- 35 to 39 minutes: 146
- 40 to 44 minutes: 200
- 45 to 59 minutes: 676
- 60 to 89 minutes: 276
- 90 or more minutes: 595
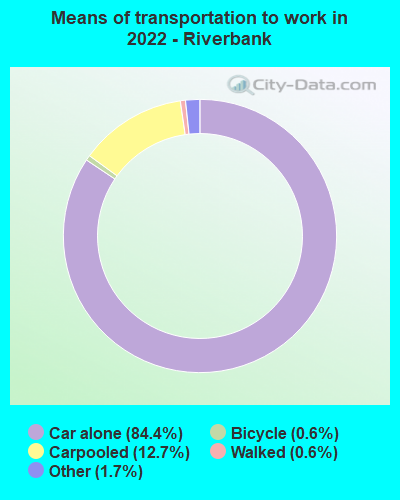
Means of transportation to work:
- Drove a car alone: 3,282 (69.7%)
- Carpooled: 594 (12.6%)
- Taxi: 72 (1.5%)
- Bicycle: 21 (0.4%)
- Walked: 30 (0.6%)
- Worked at home: 728 (15.5%)

- Unemployment by race in 2022
- Unemployment rate for White non-Hispanic residents
- 1.6%Males
- 6.0%Females
- Unemployment rate for American Indian and Alaska Native residents
- 13.0%Males
- Unemployment rate for Asian residents
- 9.6%Males
- 3.7%Females
- Unemployment rate for other race residents
- 1.9%Males
- 6.5%Females
- Unemployment rate for two or more race residents
- 1.4%Males
- 10.9%Females
- Unemployment rate for Hispanic or Latino residents
- 2.9%Males
- 10.2%Females

- Year of entry for the foreign-born population in Riverbank, California
- 6962010 or later
- 1,3592000 to 2009
- 1,6731990 to 1999
- 8441980 to 1989
- 7461970 to 1979
- 508Before 1970

First ancestries reported:
- American: 1,315 (8.7%)
- German: 418 (2.8%)
- Italian: 307 (2.0%)
- English: 250 (1.6%)
- Portuguese: 248 (1.6%)
- Irish: 172 (1.1%)
- European: 126 (0.8%)
- French: 51 (0.3%)
- Iranian: 44 (0.3%)
- Danish: 36 (0.2%)
- Hungarian: 33 (0.2%)
- Arab: 28 (0.2%)
- Norwegian: 24 (0.2%)
- Swedish: 24 (0.2%)
- British: 21 (0.1%)
- Dutch: 17 (0.1%)
- Ukrainian: 13 (0.09%)
- Scottish: 11 (0.07%)
- Brazilian: 10 (0.07%)
- Lebanese: 9 (0.06%)
- Eastern European: 9 (0.06%)
- Northern European: 9 (0.06%)
- Swiss: 6 (0.04%)
- Celtic: 5 (0.03%)
- Assyrian: 3 (0.02%)
- Welsh: 2 (0.01%)
- Greek: 1 (0.01%)
Most common places of birth for foreign-born residents (%):
| Riverbank: | 72.7% (3,944) |
| California: | 37.2% (3,881,193) |
| Riverbank: | 7.6% (410) |
| California: | 7.8% (818,297) |
| Riverbank: | 4.9% (267) |
| California: | 6.6% (684,672) |
| Riverbank: | 2.0% (106) |
| California: | 0.5% (53,260) |
Place of birth for U.S.-born residents:
- This state: 16,933
- Other state: 1,839
- Northeast: 129
- Midwest: 462
- South: 460
- West: 801
93.2% of Riverbank residents lived in the same house 1 years ago.
Out of people who lived in different houses, 40.2% lived in this county.
Out of people who lived in different counties, 94.2% lived in California.
| Riverbank: | 93.2% |
| State average: | 88.9% |
Education attainment for males 25 years and older:
- No schooling: 410
- Nursery to 4th grade: 82
- 5th and 6th grade: 368
- 7th and 8th grade: 122
- 9th grade: 146
- 10th grade: 66
- 11th grade: 50
- 12th grade, no diploma: 186
- High school graduate (or equivalency): 2,019
- Less than 1 year of college: 605
- Some college more than 1 year, no degree: 1,188
- Associate degree: 647
- Bachelor's degree: 1,249
- Master's degree: 199
- Professional school degree: 70
- Doctorate degree: 2

Education attainment for females 25 years and older:
- No schooling: 430
- Nursery to 4th grade: 164
- 5th and 6th grade: 230
- 7th and 8th grade: 138
- 9th grade: 126
- 10th grade: 66
- 11th grade: 162
- 12th grade, no diploma: 141
- High school graduate (or equivalency): 2,412
- Less than 1 year of college: 537
- Some college more than 1 year, no degree: 1,171
- Associate degree: 700
- Bachelor's degree: 954
- Master's degree: 372
- Professional school degree: 68
- Doctorate degree: 42


Housing units in structures:
- One, detached: 6,476
- One, attached: 299
- Two: 133
- 3 or 4: 56
- 5 to 9: 75
- 10 to 19: 15
- 20 to 49: 148
- 50 or more: 106
- Mobile homes: 190
- Boats, RVs, vans, etc.: 8
Median worth of mobile homes: $66,423
Housing units lacking complete kitchen facilities in 2022: 0.6%
House/condo owner moved in on average 9 years ago
Renter moved in on average 4 years ago

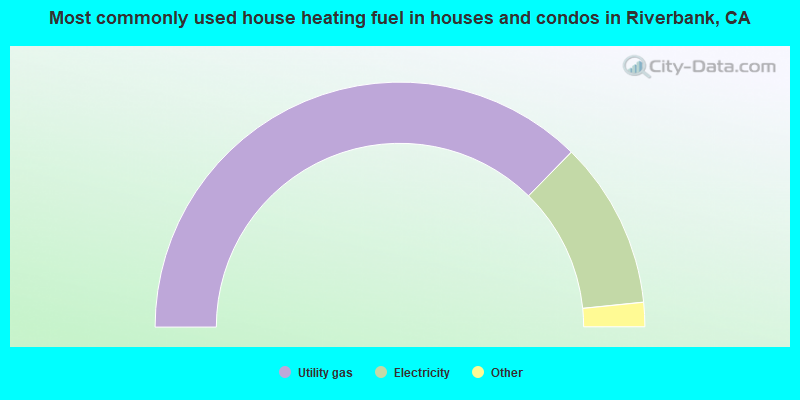
- 74.7%Utility gas
- 22.1%Electricity
- 1.6%Solar energy
- 0.9%Bottled, tank, or LP gas
- 0.4%No fuel used
- 0.2%Fuel oil, kerosene, etc.
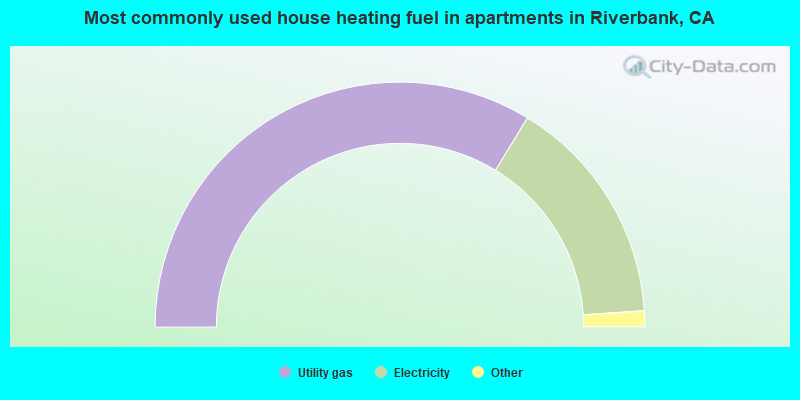
- 67.5%Utility gas
- 30.5%Electricity
- 1.4%Bottled, tank, or LP gas
- 0.6%No fuel used
Private vs. public school enrollment:
| Here: | 6.9% |
| California: | 10.5% |
| Here: | 7.2% |
| California: | 8.5% |
| Here: | 5.8% |
| California: | 15.9% |


