Riverdale, CA (California) Houses and Residents
| Riverdale: | $276,187 |
| California: | $715,900 |
Mean price in 2022:
Detached houses: $251,128
Here: $251,128 State: $988,808
Total population: 3,153 (Urban population: 0, Rural population: 2,568 (11 farm, 2,557 nonfarm))
Houses: 799 (711 occupied: 443 owner occupied, 274 renter occupied)
| % of renters here: | 38% |
| State: | 44% |
Housing density: 199 houses/condos per square mile
Median price asked for vacant for-sale houses and condos in 2022 in this county: $379,345.
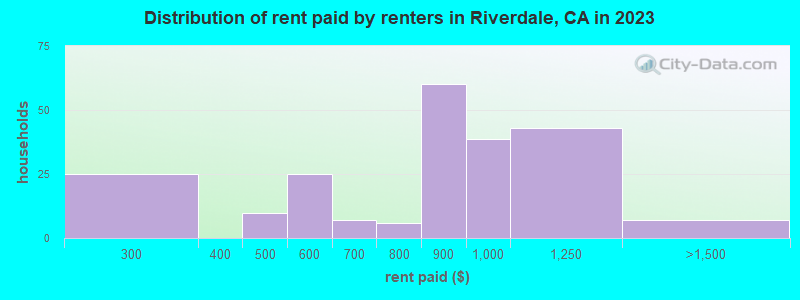
Median contract rent in 2022: $941 (lower quartile is $793, upper quartile is $1,162)
Median rent asked for vacant for-rent units in 2022: $661
Median gross rent in Riverdale, CA in 2022: $1,227
Housing units in Riverdale with a mortgage: 366 (16 second mortgage, 0 home equity loan, 8 both second mortgage and home equity loan)
Houses without a mortgage: 0
Median household income for houses/condos with a mortgage: $92,385
Median household income for apartments without a mortgage: $90,410
Median monthly housing costs: $1,325
Compare current foreclosures near Riverdale, CA:
| Photo | Address | Area | Beds / Baths | Price | Details |
|---|---|---|---|---|---|

|
#1
W Kruger Ave
Riverdale, CA 93656
|
1,688 sq. feet
|
2 baths 3 beds |
show details | |

|
#2
W Davis Ave
Riverdale, CA 93656
|
- sq. feet
|
- baths - beds |
show details | |

|
#3
Earl St
Riverdale, CA 93656
|
- sq. feet
|
- baths - beds |
show details | |

|
#4
W Davis Ave
Riverdale, CA 93656
|
- sq. feet
|
- baths - beds |
show details | |

|
#5
Pine Dr
Lemoore, CA 93245
|
1,689 sq. feet
|
2 baths 3 beds |
show details | |

|
#6
W Terrace Dr
Hanford, CA 93230
|
1,526 sq. feet
|
1 baths 2 beds |
show details | |

|
#7
Sansome St
Hanford, CA 93230
|
1,241 sq. feet
|
2 baths 4 beds |
show details | |

|
#8
Tony Dr
Hanford, CA 93230
|
1,420 sq. feet
|
2 baths 3 beds |
show details | |

|
#9
Central Ave
Hanford, CA 93230
|
1,604 sq. feet
|
2 baths 2 beds |
show details | |

|
#10
Michelle Ct
Hanford, CA 93230
|
1,156 sq. feet
|
2 baths 3 beds |
show details |
| Photo | Address | Area | Beds / Baths | Price | Details |
|---|---|---|---|---|---|

|
#11
Leoni Dr
Hanford, CA 93230
|
1,326 sq. feet
|
1 baths 2 beds |
show details | |

|
#12
N East St
Hanford, CA 93230
|
777 sq. feet
|
1 baths 2 beds |
show details | |

|
#13
B St
Lemoore, CA 93245
|
1,375 sq. feet
|
1 baths 3 beds |
show details | |

|
#14
E Ivy St
Hanford, CA 93230
|
1,245 sq. feet
|
2 baths 3 beds |
show details | |

|
#15
N Harris St
Hanford, CA 93230
|
1,721 sq. feet
|
2 baths 3 beds |
show details | |

|
#16
E Ostler St
Selma, CA 93662
|
1,089 sq. feet
|
1 baths 3 beds |
show details | |

|
#17
N 11th Ave
Hanford, CA 93230
|
1,052 sq. feet
|
1 baths 2 beds |
show details | |

|
#18
Pine Castle Dr
Hanford, CA 93230
|
1,560 sq. feet
|
2 baths 3 beds |
show details | |

|
#19
E Dinuba Ave
Fresno, CA 93725
|
1,080 sq. feet
|
2 baths 3 beds |
show details | |

|
#20
E Magnolia Ave
Hanford, CA 93230
|
1,470 sq. feet
|
2 baths 3 beds |
show details |
| Photo | Address | Area | Beds / Baths | Price | Details |
|---|---|---|---|---|---|

|
#21
W Walter Ave Unit 78
Fowler, CA 93625
|
1,421 sq. feet
|
2 baths 3 beds |
show details | |

|
#22
W Malaga Ave
Fresno, CA 93706
|
3,040 sq. feet
|
1 baths 3 beds |
show details | |

|
#23
Oriole St
Hanford, CA 93230
|
1,243 sq. feet
|
2 baths 3 beds |
show details | |

|
#24
E Fantz Ave
Fresno, CA 93706
|
1,100 sq. feet
|
2 baths 3 beds |
show details | |

|
#25
E Hopkins Ave
Fresno, CA 93706
|
1,591 sq. feet
|
2 baths 3 beds |
show details | |

|
#26
E Floral Ave
Selma, CA 93662
|
1,152 sq. feet
|
2 baths 2 beds |
show details | |

|
#27
N Burl Dr
Hanford, CA 93230
|
1,232 sq. feet
|
2 baths 3 beds |
show details | |

|
#28
Cottonwood Ct
Hanford, CA 93230
|
1,085 sq. feet
|
2 baths 3 beds |
show details | |

|
#29
Eastview Dr
Hanford, CA 93230
|
1,260 sq. feet
|
1 baths 3 beds |
show details | |

|
#30
E Cameron St
Hanford, CA 93230
|
992 sq. feet
|
1 baths 2 beds |
show details |
| Photo | Address | Area | Beds / Baths | Price | Details |
|---|---|---|---|---|---|

|
#31
Salem Dr
Hanford, CA 93230
|
1,178 sq. feet
|
2 baths 3 beds |
show details | |

|
#32
S Cherry Ave
Fresno, CA 93725
|
2,168 sq. feet
|
3 baths 4 beds |
show details | |

|
#33
Clover Ln
Hanford, CA 93230
|
1,360 sq. feet
|
2 baths 3 beds |
show details | |

|
#34
Hawthorn St
Hanford, CA 93230
|
1,365 sq. feet
|
2 baths 3 beds |
show details | |

|
#35
S Wishon Ave
Hanford, CA 93230
|
1,502 sq. feet
|
2 baths 4 beds |
show details | |

|
#36
Leoni Dr
Hanford, CA 93230
|
1,326 sq. feet
|
1 baths 2 beds |
show details | |

|
#37
S 7th St
Fowler, CA 93625
|
1,296 sq. feet
|
2 baths 4 beds |
show details | |

|
#38
Milan Dr
Lemoore, CA 93245
|
1,113 sq. feet
|
2 baths 3 beds |
show details | |

|
#39
Riviera Dr
Lemoore, CA 93245
|
1,329 sq. feet
|
2 baths 3 beds |
show details | |

|
#40
Castoro Way
Hanford, CA 93230
|
2,137 sq. feet
|
2 baths 3 beds |
show details |
| Photo | Address | Area | Beds / Baths | Price | Details |
|---|---|---|---|---|---|

|
#41
E Bush St
Lemoore, CA 93245
|
796 sq. feet
|
1 baths 2 beds |
show details | |

|
#42
W Burlwood Ln
Lemoore, CA 93245
|
1,484 sq. feet
|
2 baths 3 beds |
show details | |

|
#43
N Madison Way
Hanford, CA 93230
|
2,261 sq. feet
|
2 baths 4 beds |
show details | |

|
#44
Grand Ave
Lemoore, CA 93245
|
1,298 sq. feet
|
2 baths 3 beds |
show details | |

|
#45
Holly Ave
Lemoore, CA 93245
|
1,754 sq. feet
|
2 baths 4 beds |
show details | |

|
#46
Grant St
Armona, CA 93202
|
1,008 sq. feet
|
2 baths 3 beds |
show details | |

|
#47
Grant St
Armona, CA 93202
|
1,008 sq. feet
|
2 baths 3 beds |
show details | |

|
#48
W Terrace Dr
Hanford, CA 93230
|
1,526 sq. feet
|
1 baths 2 beds |
show details | |

|
#49
Laurence Ln
Hanford, CA 93230
|
2,132 sq. feet
|
3 baths 5 beds |
show details | |

|
Check over 1 million property listings on Foreclosure.com!
|
browse all offers | |||

Latest news about housing in Riverdale, CA collected exclusively by city-data.com from local newspapers, TV, and radio stations

 | Why I love living in SF (291 replies) |
| Is San Francisco the only city to have completely priced out its middle/working class? (89 replies) |
| Santa Cruz is ugly compared to Monterey (31 replies) |
| Riverside in Anaheim? (13 replies) |
| Orange, CA? (17 replies) |
| Is It Time To Leave LA? (44 replies) |

Median year apartment built: 1983
Household type by relationship:
Households: 2,774- Male householders: 396 (37 living alone), Female householders: 307 (18 living alone)
454 spouses (420 opposite-sex spouses), 101 unmarried partners, (101 opposite-sex unmarried partners), 1,082 children (1,042 natural, 40 adopted, 0 stepchildren), 66 grandchildren, 86 brothers or sisters, 12 parents, 0 foster children, 195 other relatives, 72 non-relatives
Size of family households: 171 2-persons, 100 3-persons, 175 4-persons, 83 5-persons, 65 6-persons, 55 7-or-more-persons.
Size of nonfamily households: 57 1-person.
331 married couples with children.
249 single-parent households (107 men, 142 women).
26.8% of residents of Riverdale speak English at home.
72.9% of residents speak Spanish at home (58% speak English very well, 8% speak English well, 11% speak English not well, 23% don't speak English at all).
0.4% of residents speak other Indo-European language at home (100% speak English very well).
1.0% of residents speak other language at home (100% speak English very well).
Foreign born population: 928 (33.5%)
(23.3% of them are naturalized citizens)
| Here: | 5.8 |
| State: | 6.0 |
| Here: | 4.8 |
| State: | 3.9 |

- Bedrooms in owner-occupied houses and condos in Riverdale, California
- 0no bedroom
- 01 bedroom
- 312 bedrooms
- 2773 bedrooms
- 1264 bedrooms
- 95+ bedrooms

- Bedrooms in renter-occupied apartments in Riverdale, California
- 0no bedroom
- 01 bedroom
- 1122 bedrooms
- 913 bedrooms
- 714 bedrooms
- 05+ bedrooms

- Cars and other vehicles available in Riverdale in owner-occupied houses/condos
- 0no vehicle
- 271 vehicle
- 1522 vehicles
- 1153 vehicles
- 1404 vehicles
- 105+ vehicles
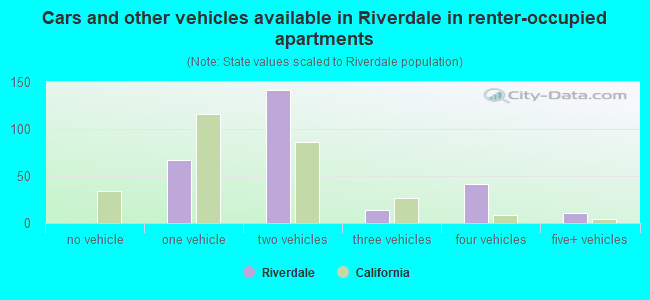
- Cars and other vehicles available in Riverdale in renter-occupied apartments
- 0no vehicle
- 541 vehicle
- 1502 vehicles
- 03 vehicles
- 374 vehicles
- 335+ vehicles

- Rooms in owner-occupied houses in Riverdale, California
- 01 room
- 02 rooms
- 03 rooms
- 514 rooms
- 1285 rooms
- 1566 rooms
- 707 rooms
- 208 rooms
- 189+ rooms
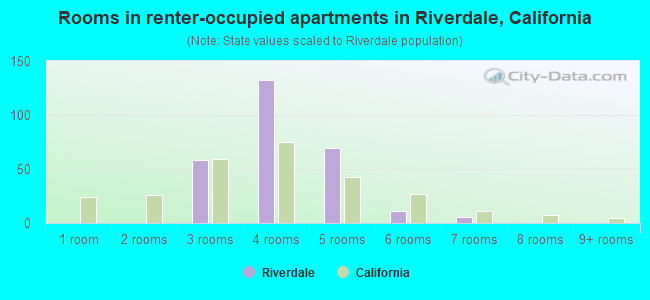
- Rooms in renter-occupied apartments in Riverdale, California
- 01 room
- 02 rooms
- 443 rooms
- 684 rooms
- 915 rooms
- 616 rooms
- 107 rooms
- 08 rooms
- 09+ rooms


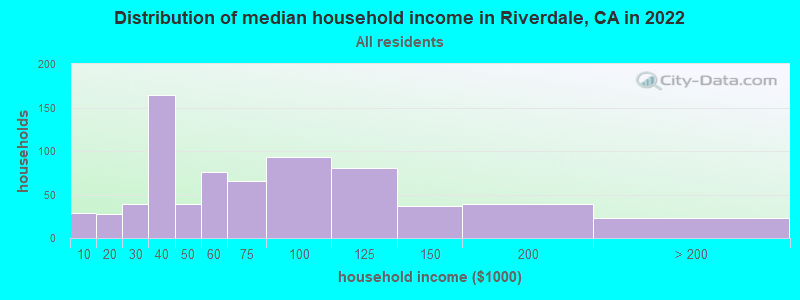
Riverdale, CA household income distribution

- 29Less than $10,000
- 28$10,000 to $19,999
- 39$20,000 to $29,999
- 164$30,000 to $39,999
- 39$40,000 to $49,999
- 76$50,000 to $59,999
- 66$60,000 to $74,999
- 93$75,000 to $99,999
- 80$100,000 to $124,999
- 37$125,000 to $149,999
- 39$150,000 to $199,999
- 23$200,000 or more
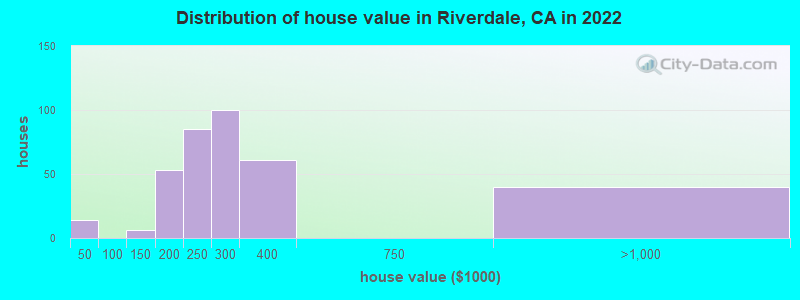
Home value of owner - occupied houses in 2022 in Riverdale, CA
-
- 14$20,000 to $24,999
- 6$100,000 to $124,999
- 34$150,000 to $174,999
- 18$175,000 to $199,999
- 84$200,000 to $249,999
- 99$250,000 to $299,999
- 60$300,000 to $399,999
- 39$750,000 to $999,999
Rent paid by renters in 2022 in Riverdale, CA
-
- 13$250 to $299
- 7$450 to $499
- 28$700 to $749
- 75$800 to $899
- 29$900 to $999
- 92$1,000 to $1,249

Percentage of workers working in this county: 88.1%
Number of people working at home: 78 (6.4% of all workers)
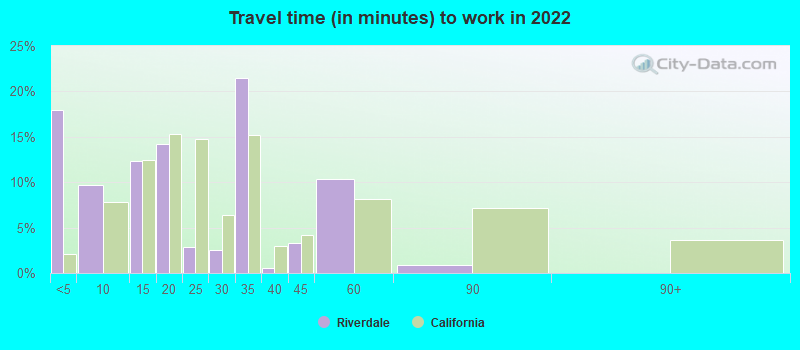
Travel time to work (commute)
- Less than 5 minutes: 71
- 5 to 9 minutes: 170
- 10 to 14 minutes: 47
- 15 to 19 minutes: 107
- 20 to 24 minutes: 135
- 25 to 29 minutes: 118
- 30 to 34 minutes: 266
- 35 to 39 minutes: 42
- 40 to 44 minutes: 90
- 45 to 59 minutes: 27
- 60 to 89 minutes: 41
- 90 or more minutes: 0
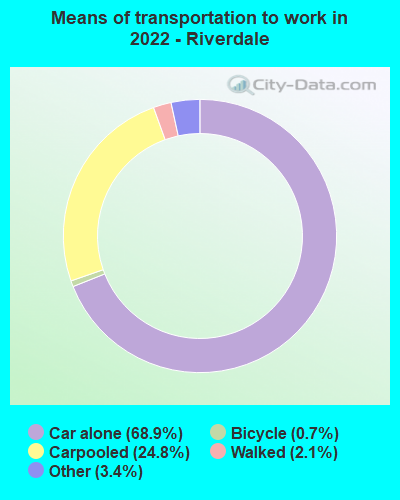
Means of transportation to work:
- Drove a car alone: 605 (60.9%)
- Carpooled: 191 (19.2%)
- Taxi: 43 (4.3%)
- Bicycle: 4 (0.4%)
- Walked: 15 (1.5%)
- Worked at home: 154 (15.5%)

- Unemployment by race in 2022
- Unemployment rate for other race residents
- 8.8%Males
- Unemployment rate for two or more race residents
- 11.2%Females
- Unemployment rate for Hispanic or Latino residents
- 3.9%Males
- 7.5%Females

- Year of entry for the foreign-born population in Riverdale, California
- 1412010 or later
- 2372000 to 2009
- 2431990 to 1999
- 2251980 to 1989
- 1571970 to 1979
- 36Before 1970

First ancestries reported:
- Scottish: 102 (5.5%)
- Portuguese: 76 (4.1%)
- English: 68 (3.6%)
- German: 54 (2.9%)
- Syrian: 40 (2.1%)
- European: 27 (1.4%)
- Swedish: 8 (0.4%)
- American: 7 (0.4%)
Most common places of birth for foreign-born residents (%):
| Riverdale: | 90.7% (839) |
| California: | 37.2% (3,881,193) |
| Riverdale: | 3.8% (35) |
| California: | 0.3% (30,949) |
| Riverdale: | 2.8% (26) |
| California: | 0.1% (8,444) |
Place of birth for U.S.-born residents:
- This state: 1,673
- Other state: 113
- Northeast: 0
- Midwest: 0
- South: 62
- West: 47
79.6% of Riverdale residents lived in the same house 1 years ago.
Out of people who lived in different houses, 49.7% lived in this county.
Out of people who lived in different counties, 100.0% lived in California.
| Riverdale: | 79.6% |
| State average: | 88.9% |
Education attainment for males 25 years and older:
- No schooling: 90
- Nursery to 4th grade: 10
- 5th and 6th grade: 94
- 7th and 8th grade: 21
- 9th grade: 77
- 10th grade: 74
- 11th grade: 31
- 12th grade, no diploma: 0
- High school graduate (or equivalency): 355
- Less than 1 year of college: 42
- Some college more than 1 year, no degree: 135
- Associate degree: 9
- Bachelor's degree: 9
- Master's degree: 48
- Professional school degree: 0
- Doctorate degree: 0

Education attainment for females 25 years and older:
- No schooling: 70
- Nursery to 4th grade: 0
- 5th and 6th grade: 89
- 7th and 8th grade: 23
- 9th grade: 35
- 10th grade: 45
- 11th grade: 6
- 12th grade, no diploma: 8
- High school graduate (or equivalency): 253
- Less than 1 year of college: 11
- Some college more than 1 year, no degree: 24
- Associate degree: 90
- Bachelor's degree: 109
- Master's degree: 131
- Professional school degree: 0
- Doctorate degree: 0


Housing units in structures:
- One, detached: 689
- One, attached: 52
- 5 to 9: 43
- 20 to 49: 13
Housing units lacking complete kitchen facilities in 2022: 7.9%
House/condo owner moved in on average 13 years ago
Renter moved in on average 1 years ago

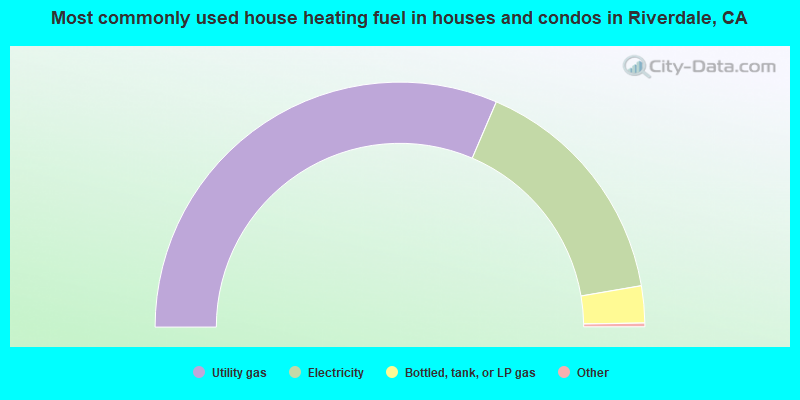
- 63.2%Utility gas
- 31.9%Electricity
- 4.9%Bottled, tank, or LP gas
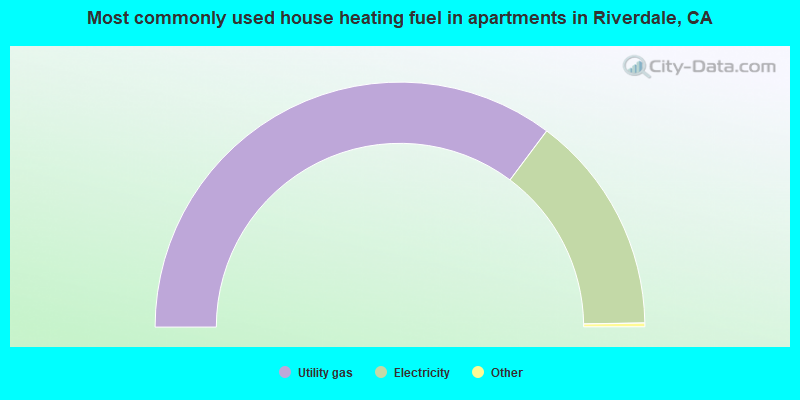
- 70.8%Utility gas
- 29.2%Electricity
Private vs. public school enrollment:
| Here: | 12.6% |
| California: | 10.5% |
| Here: | 13.5% |
| California: | 8.5% |
| Here: | 0.0% |
| California: | 15.9% |


