Riverhead, NY (New York) Houses and Residents
| Riverhead: | $455,862 |
| New York: | $400,400 |
Total population: 13,299 (Urban population: 9,898 (all inside urban clusters), Rural population: 783 (all nonfarm))
Houses: 5,648 (5,206 occupied: 2,993 owner occupied, 2,210 renter occupied)
| % of renters here: | 42% |
| State: | 46% |
Housing density: 374 houses/condos per square mile
Median price asked for vacant for-sale houses and condos in 2022: $143,614.
Median contract rent in 2022: $1,624 (lower quartile is $929, upper quartile is over $2,000)
Median rent asked for vacant for-rent units in 2022: $2,508
Median gross rent in Riverhead, NY in 2022: $1,852
Housing units in Riverhead with a mortgage: 1,725 (169 second mortgage, 0 home equity loan, 151 both second mortgage and home equity loan)
Houses without a mortgage: 68
Median household income for houses/condos with a mortgage: $135,961
Median household income for apartments without a mortgage: $65,404
Median monthly housing costs: $1,774
Compare current foreclosures near Riverhead, NY:
| Photo | Address | Area | Beds / Baths | Price | Details |
|---|---|---|---|---|---|

|
#1
Ann Ave
Riverhead, NY 11901
|
1,138 sq. feet
|
1 baths 3 beds |
show details | |

|
#2
Harrison Ave
Riverhead, NY 11901
|
1,620 sq. feet
|
2 baths 4 beds |
show details | |

|
#3
Moon Ave
Riverhead, NY 11901
|
1,120 sq. feet
|
3 baths 4 beds |
show details | |

|
#4
Lakeview Dr
Riverhead, NY 11901
|
3,715 sq. feet
|
3 baths 4 beds |
show details | |

|
#5
Maynard Ave
Riverhead, NY 11901
|
1,754 sq. feet
|
1 baths 4 beds |
show details | |

|
#6
Osborn Ave
Riverhead, NY 11901
|
2,140 sq. feet
|
2 baths 5 beds |
show details | |

|
#7
Willow Pond Dr
Riverhead, NY 11901
|
1,078 sq. feet
|
1 baths 1 beds |
show details | |

|
#8
Riverside Dr
Riverhead, NY 11901
|
2,102 sq. feet
|
1 baths 3 beds |
show details | |

|
#9
Deck St
Riverhead, NY 11901
|
1,190 sq. feet
|
2 baths 3 beds |
show details | |

|
#10
Brookhaven Ave
Riverhead, NY 11901
|
1,666 sq. feet
|
2 baths 4 beds |
show details |
| Photo | Address | Area | Beds / Baths | Price | Details |
|---|---|---|---|---|---|

|
#11
Riverleigh Ave Unit 147a
Riverhead, NY 11901
|
1,152 sq. feet
|
- baths 2 beds |
show details | |

|
#12
Pebble Way
Riverhead, NY 11901
|
1,494 sq. feet
|
- baths 3 beds |
show details | |

|
#13
E Main St
Riverhead, NY 11901
|
- sq. feet
|
- baths - beds |
show details | |

|
#14
Aldersgate Apt 310
Riverhead, NY 11901
|
- sq. feet
|
- baths - beds |
show details | |

|
#15
Old Country Rd Unit 340
Riverhead, NY 11901
|
- sq. feet
|
- baths - beds |
show details | |

|
#16
Church Ln
Riverhead, NY 11901
|
- sq. feet
|
- baths - beds |
show details | |

|
#17
W Main St Ste 407
Riverhead, NY 11901
|
- sq. feet
|
- baths - beds |
show details | |

|
#18
Middle Country Road
Riverhead, NY 11901
|
- sq. feet
|
- baths - beds |
show details | |

|
#19
Laurel Ln
Shirley, NY 11967
|
1,032 sq. feet
|
1 baths 3 beds |
$479,900
|
show details |

|
#20
N Sea Rd
Southampton, NY 11968
|
1,913 sq. feet
|
3 baths 4 beds |
$999,990
|
show details |
| Photo | Address | Area | Beds / Baths | Price | Details |
|---|---|---|---|---|---|

|
#21
Rocky Point Yaphank Rd
Rocky Point, NY 11778
|
850 sq. feet
|
1 baths 1 beds |
$192,900
|
show details |

|
#22
Rocky Point Yaphank Rd
Rocky Point, NY 11778
|
1,000 sq. feet
|
1 baths 2 beds |
$189,900
|
show details |

|
#23
Reeves Ave
Riverhead, NY 11901
|
- sq. feet
|
- baths - beds |
show details | |

|
#24
Old Country Rd Unit 22
Riverhead, NY 11901
|
- sq. feet
|
- baths - beds |
show details | |

|
#25
Mill Dr
Mastic Beach, NY 11951
|
- sq. feet
|
1 baths 3 beds |
$244,900
|
show details |

|
#26
Rocky Point Yaphank Rd Apt 146
Rocky Point, NY 11778
|
- sq. feet
|
1 baths 1 beds |
$199,900
|
show details |

|
#27
Meadowbrook Dr
Sound Beach, NY 11789
|
- sq. feet
|
1 baths 3 beds |
$249,900
|
show details |

|
#28
Monet Ct
Middle Island, NY 11953
|
- sq. feet
|
1 baths 1 beds |
$189,900
|
show details |

|
#29
Alcolade Dr E
Shirley, NY 11967
|
1,140 sq. feet
|
1 baths 3 beds |
show details | |

|
#30
Miller Rd
Southampton, NY 11968
|
2,128 sq. feet
|
2 baths 4 beds |
show details |
| Photo | Address | Area | Beds / Baths | Price | Details |
|---|---|---|---|---|---|

|
#31
Wading River Hollow Rd
Ridge, NY 11961
|
1,912 sq. feet
|
2 baths 3 beds |
show details | |

|
#32
Boxwood Dr
Shirley, NY 11967
|
1,544 sq. feet
|
2 baths 3 beds |
show details | |

|
#33
Canterbury Dr
Wading River, NY 11792
|
4,248 sq. feet
|
5 baths 5 beds |
show details | |

|
#34
Jefferson Dr
Mastic Beach, NY 11951
|
1,557 sq. feet
|
2 baths 3 beds |
show details | |

|
#35
Cranford Blvd
Mastic, NY 11950
|
1,952 sq. feet
|
2 baths 4 beds |
show details | |

|
#36
Hickory Bnd
Speonk, NY 11972
|
3,310 sq. feet
|
5 baths 4 beds |
show details | |

|
#37
Alfred Ave
Calverton, NY 11933
|
3,063 sq. feet
|
3 baths 4 beds |
show details | |

|
#38
Evergreen Rd
Rocky Point, NY 11778
|
1,344 sq. feet
|
3 baths 4 beds |
show details | |

|
#39
Pinewood Dr
Shirley, NY 11967
|
1,276 sq. feet
|
1 baths 3 beds |
show details | |

|
#40
Whittier Dr
Mastic Beach, NY 11951
|
- sq. feet
|
1 baths 2 beds |
show details |
| Photo | Address | Area | Beds / Baths | Price | Details |
|---|---|---|---|---|---|

|
#41
May Dr
Calverton, NY 11933
|
2,269 sq. feet
|
2 baths 4 beds |
show details | |

|
#42
N Swezeytown Rd
Middle Island, NY 11953
|
1,092 sq. feet
|
1 baths 3 beds |
show details | |

|
#43
Gerald Ln
Hampton Bays, NY 11946
|
1,960 sq. feet
|
3 baths 4 beds |
show details | |

|
#44
Silas Carter Rd
Manorville, NY 11949
|
- sq. feet
|
- baths - beds |
$310,000
|
show details |

|
#45
N Sea Rd
Southampton, NY 11968
|
3,317 sq. feet
|
4 baths 4 beds |
show details | |

|
#46
Red Creek Cir
Hampton Bays, NY 11946
|
3,500 sq. feet
|
3 baths 4 beds |
show details | |

|
#47
Red Creek Cir
Hampton Bays, NY 11946
|
3,162 sq. feet
|
2 baths 4 beds |
show details | |

|
#48
Sweetgum Ln
Miller Place, NY 11764
|
4,258 sq. feet
|
4 baths 5 beds |
show details | |

|
#49
W Woodland Dr
Wading River, NY 11792
|
2,181 sq. feet
|
3 baths 5 beds |
show details | |

|
Check over 1 million property listings on Foreclosure.com!
|
browse all offers | |||

Latest news about housing in Riverhead, NY collected exclusively by city-data.com from local newspapers, TV, and radio stations


Median year apartment built: 1992
Household type by relationship:
Households: 14,397- Male householders: 2,511 (532 living alone), Female householders: 2,682 (1,160 living alone)
2,553 spouses (2,540 opposite-sex spouses), 177 unmarried partners, (177 opposite-sex unmarried partners), 3,703 children (3,180 natural, 229 adopted, 294 stepchildren), 314 grandchildren, 620 brothers or sisters, 203 parents, 0 foster children, 812 other relatives, 328 non-relatives
- In group quarters: 490
Size of family households: 1,823 2-persons, 523 3-persons, 570 4-persons, 245 5-persons, 127 6-persons, 197 7-or-more-persons.
Size of nonfamily households: 1,706 1-person, 39 2-persons, 8 3-persons, 11 7-or-more-persons.
1,869 married couples with children.
439 single-parent households (83 men, 356 women).
65.2% of residents of Riverhead speak English at home.
28.3% of residents speak Spanish at home (32% speak English very well, 33% speak English well, 24% speak English not well, 11% don't speak English at all).
6.0% of residents speak other Indo-European language at home (44% speak English very well, 46% speak English well, 11% speak English not well).
0.4% of residents speak Asian or Pacific Island language at home (100% speak English very well).
2.3% of residents speak other language at home (76% speak English very well, 13% speak English well, 11% speak English not well).
Foreign born population: 4,471 (31.1%)
(44.9% of them are naturalized citizens)
| Here: | 5.6 |
| State: | 6.3 |
| Here: | 4.2 |
| State: | 3.8 |
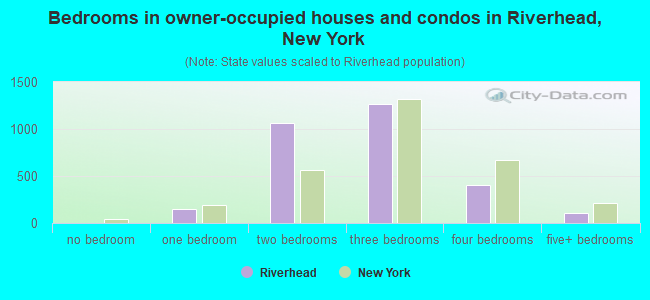
- Bedrooms in owner-occupied houses and condos in Riverhead, New York
- 0no bedroom
- 1481 bedroom
- 1,0662 bedrooms
- 1,2653 bedrooms
- 4054 bedrooms
- 1095+ bedrooms
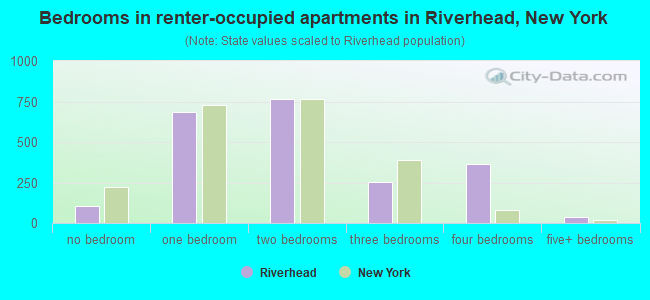
- Bedrooms in renter-occupied apartments in Riverhead, New York
- 105no bedroom
- 6861 bedroom
- 7632 bedrooms
- 2533 bedrooms
- 3654 bedrooms
- 395+ bedrooms
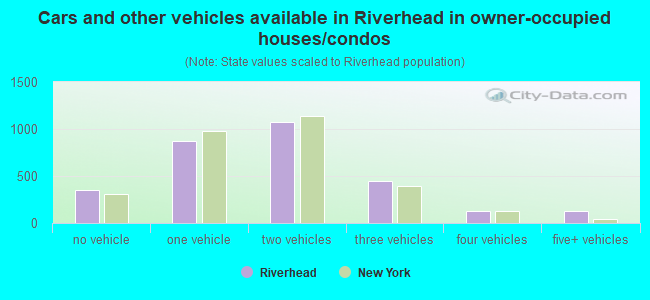
- Cars and other vehicles available in Riverhead in owner-occupied houses/condos
- 355no vehicle
- 8691 vehicle
- 1,0702 vehicles
- 4463 vehicles
- 1244 vehicles
- 1295+ vehicles
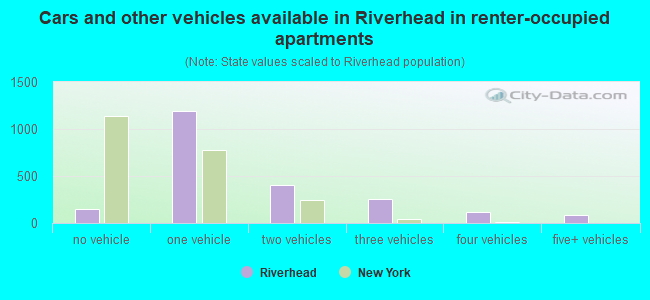
- Cars and other vehicles available in Riverhead in renter-occupied apartments
- 152no vehicle
- 1,1941 vehicle
- 4052 vehicles
- 2523 vehicles
- 1224 vehicles
- 855+ vehicles
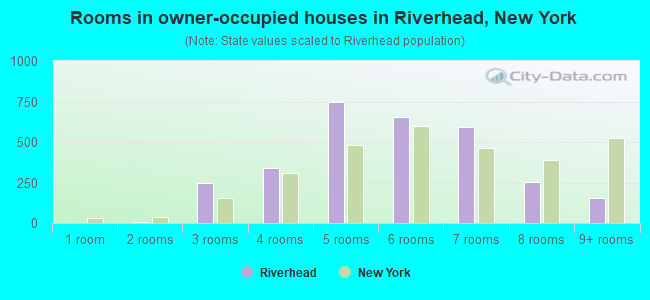
- Rooms in owner-occupied houses in Riverhead, New York
- 01 room
- 42 rooms
- 2503 rooms
- 3374 rooms
- 7445 rooms
- 6566 rooms
- 5927 rooms
- 2548 rooms
- 1579+ rooms
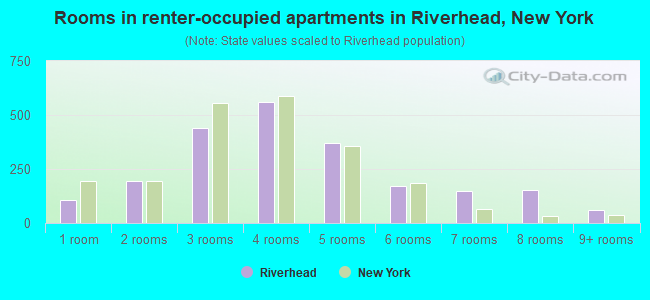
- Rooms in renter-occupied apartments in Riverhead, New York
- 1051 room
- 1962 rooms
- 4423 rooms
- 5614 rooms
- 3695 rooms
- 1706 rooms
- 1507 rooms
- 1538 rooms
- 629+ rooms
Riverhead, NY household income distribution

- 328Less than $10,000
- 430$10,000 to $19,999
- 308$20,000 to $29,999
- 288$30,000 to $39,999
- 424$40,000 to $49,999
- 391$50,000 to $59,999
- 508$60,000 to $74,999
- 781$75,000 to $99,999
- 404$100,000 to $124,999
- 407$125,000 to $149,999
- 508$150,000 to $199,999
- 430$200,000 or more
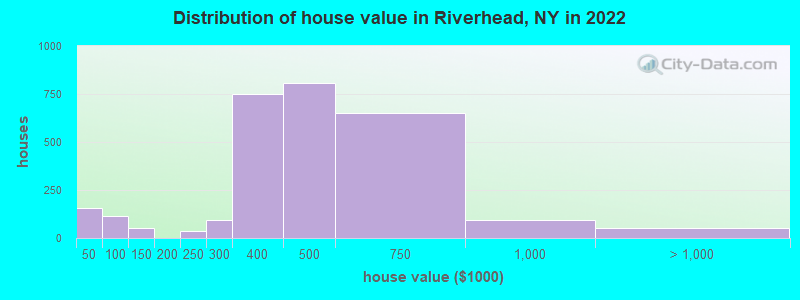
Home value of owner - occupied houses in 2022 in Riverhead, NY
-
- 25$25,000 to $29,999
- 29$35,000 to $39,999
- 98$40,000 to $49,999
- 6$50,000 to $59,999
- 6$70,000 to $79,999
- 43$100,000 to $124,999
- 9$125,000 to $149,999
- 34$200,000 to $249,999
- 95$250,000 to $299,999
- 750$300,000 to $399,999
- 806$400,000 to $499,999
- 651$500,000 to $749,999
- 94$750,000 to $999,999
- 21$1,000,000 to $1,499,999
- 31$2,000,000 or more
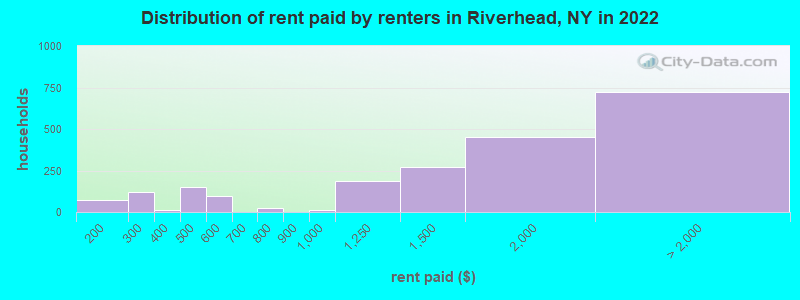
Rent paid by renters in 2022 in Riverhead, NY
-
- 71$100 to $149
- 80$200 to $249
- 39$250 to $299
- 13$300 to $349
- 153$400 to $449
- 97$550 to $599
- 24$700 to $749
- 10$900 to $999
- 183$1,000 to $1,249
- 269$1,250 to $1,499
- 451$1,500 to $1,999
- 275$2,000 to $2,499
- 144$2,500 to $2,999
- 65$3,000 to $3,499
- 71$3,500 or more
- 166No cash rent
Percentage of workers working in this county: 95.7%
Number of people working at home: 292 (4.8% of all workers)
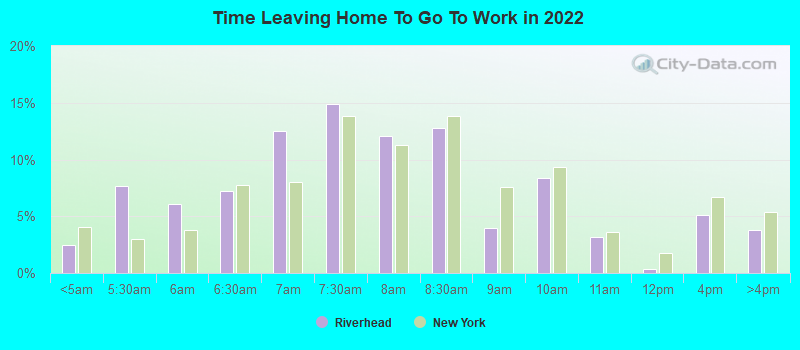
Travel time to work (commute)
- Less than 5 minutes: 467
- 5 to 9 minutes: 686
- 10 to 14 minutes: 1,023
- 15 to 19 minutes: 568
- 20 to 24 minutes: 476
- 25 to 29 minutes: 304
- 30 to 34 minutes: 702
- 35 to 39 minutes: 23
- 40 to 44 minutes: 320
- 45 to 59 minutes: 628
- 60 to 89 minutes: 280
- 90 or more minutes: 230
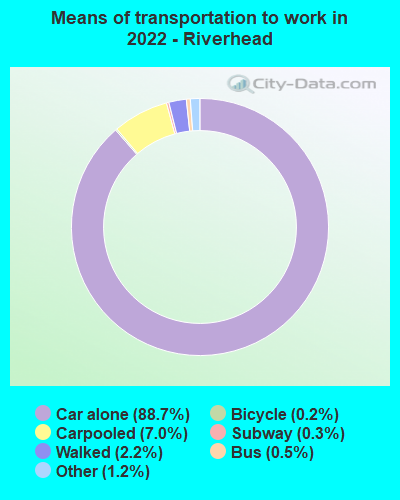
Means of transportation to work:
- Drove a car alone: 11,600 (82.5%)
- Carpooled: 1,053 (7.5%)
- Bus: 62 (0.4%)
- Long-distance train or commuter rail: 37 (0.3%)
- Taxi: 188 (1.3%)
- Bicycle: 16 (0.1%)
- Walked: 308 (2.2%)
- Worked at home: 292 (2.1%)
- Unemployment by race in 2022
- Unemployment rate for White non-Hispanic residents
- 5.1%Males
- 3.3%Females
- Unemployment rate for Black residents
- 13.7%Males
- Unemployment rate for other race residents
- 2.6%Males
- 9.6%Females
- Unemployment rate for two or more race residents
- 14.9%Males
- Unemployment rate for Hispanic or Latino residents
- 4.7%Males
- 25.7%Females
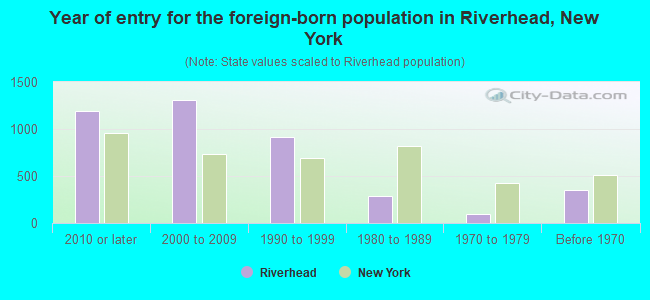
- Year of entry for the foreign-born population in Riverhead, New York
- 1,1872010 or later
- 1,3072000 to 2009
- 9171990 to 1999
- 2881980 to 1989
- 921970 to 1979
- 348Before 1970
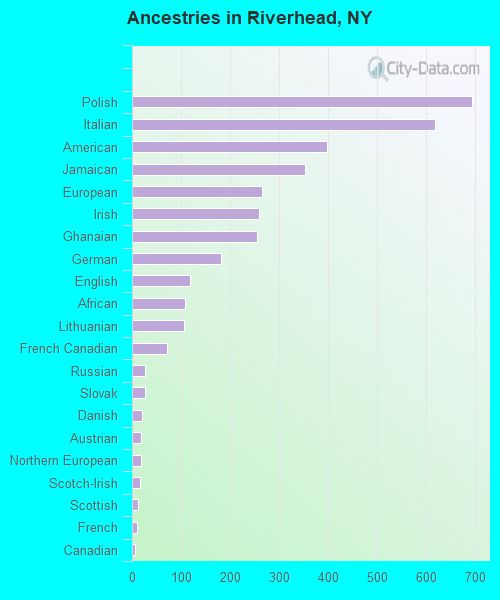
First ancestries reported:
- Polish: 693 (8.7%)
- Italian: 618 (7.8%)
- American: 397 (5.0%)
- Jamaican: 352 (4.4%)
- European: 264 (3.3%)
- Irish: 259 (3.3%)
- Ghanaian: 254 (3.2%)
- German: 182 (2.3%)
- English: 119 (1.5%)
- African: 109 (1.4%)
- Lithuanian: 105 (1.3%)
- French Canadian: 71 (0.9%)
- Russian: 27 (0.3%)
- Slovak: 26 (0.3%)
- Danish: 21 (0.3%)
- Austrian: 19 (0.2%)
- Northern European: 18 (0.2%)
- Scotch-Irish: 17 (0.2%)
- Scottish: 12 (0.2%)
- French: 10 (0.1%)
- Canadian: 7 (0.09%)
- Haitian: 5 (0.06%)
- Portuguese: 4 (0.05%)
Most common places of birth for foreign-born residents (%):
| Riverhead: | 21.8% (901) |
| New York: | 2.4% (108,067) |
| Riverhead: | 19.7% (811) |
| New York: | 2.5% (111,920) |
| Riverhead: | 16.5% (682) |
| New York: | 1.4% (61,245) |
| Riverhead: | 10.8% (445) |
| New York: | 5.0% (227,557) |
| Riverhead: | 8.5% (350) |
| New York: | 1.4% (65,102) |
| Riverhead: | 4.2% (175) |
| New York: | 1.4% (62,442) |
| Riverhead: | 2.9% (118) |
| New York: | 0.1% (2,564) |
| Riverhead: | 2.7% (110) |
| New York: | 4.8% (214,559) |
| Riverhead: | 2.6% (108) |
| New York: | 0.9% (39,058) |
| Riverhead: | 2.1% (85) |
| New York: | 11.1% (501,040) |
Place of birth for U.S.-born residents:
- This state: 8,241
- Other state: 1,580
- Northeast: 429
- Midwest: 46
- South: 896
- West: 105
86.4% of Riverhead residents lived in the same house 1 years ago.
Out of people who lived in different houses, 40.7% lived in this county.
Out of people who lived in different counties, 96.9% lived in New York.
| Riverhead: | 86.4% |
| State average: | 89.6% |
Education attainment for males 25 years and older:
- No schooling: 425
- Nursery to 4th grade: 186
- 5th and 6th grade: 231
- 7th and 8th grade: 325
- 9th grade: 112
- 10th grade: 28
- 11th grade: 129
- 12th grade, no diploma: 206
- High school graduate (or equivalency): 1,718
- Less than 1 year of college: 275
- Some college more than 1 year, no degree: 271
- Associate degree: 525
- Bachelor's degree: 387
- Master's degree: 341
- Professional school degree: 165
- Doctorate degree: 22
Education attainment for females 25 years and older:
- No schooling: 277
- Nursery to 4th grade: 82
- 5th and 6th grade: 104
- 7th and 8th grade: 88
- 9th grade: 86
- 10th grade: 31
- 11th grade: 34
- 12th grade, no diploma: 191
- High school graduate (or equivalency): 1,976
- Less than 1 year of college: 272
- Some college more than 1 year, no degree: 663
- Associate degree: 319
- Bachelor's degree: 494
- Master's degree: 346
- Professional school degree: 71
- Doctorate degree: 13


Housing units in structures:
- One, detached: 3,205
- One, attached: 840
- Two: 177
- 3 or 4: 405
- 5 to 9: 306
- 10 to 19: 247
- 20 to 49: 118
- 50 or more: 67
- Mobile homes: 279
Median worth of mobile homes: $45,489
Housing units lacking complete kitchen facilities in 2022: 0.9%
House/condo owner moved in on average 12 years ago
Renter moved in on average 4 years ago
- 55.2%Utility gas
- 37.1%Fuel oil, kerosene, etc.
- 5.3%Bottled, tank, or LP gas
- 2.3%Electricity
- 0.1%Wood
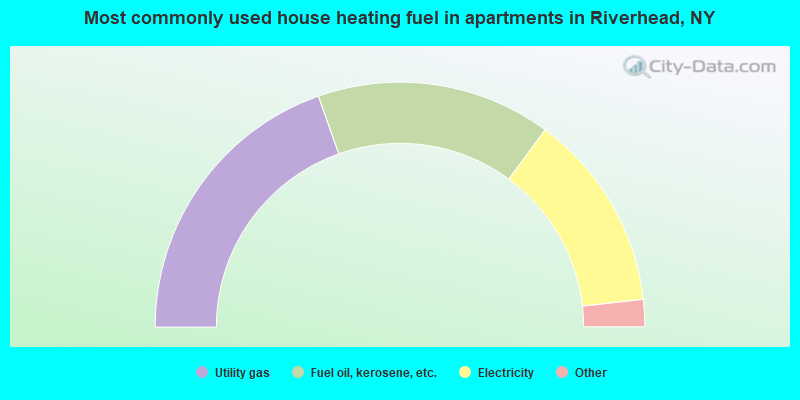
- 39.2%Utility gas
- 31.0%Fuel oil, kerosene, etc.
- 26.2%Electricity
- 2.0%No fuel used
- 1.6%Bottled, tank, or LP gas
Private vs. public school enrollment:
| Here: | 0.0% |
| New York: | 15.6% |
| Here: | 2.2% |
| New York: | 15.0% |
| Here: | 15.7% |
| New York: | 39.2% |