Robersonville, NC (North Carolina) Houses and Residents
| Robersonville: | $100,940 |
| North Carolina: | $280,600 |
Mean price in 2022:
Detached houses: $163,725
Here: $163,725 State: $375,326
Total population: 1,430 (Urban population: 0, Rural population: 1,662 (11 farm, 1,651 nonfarm))
Houses: 841 (668 occupied: 414 owner occupied, 263 renter occupied)
| % of renters here: | 39% |
| State: | 33% |
Housing density: 704 houses/condos per square mile
Median price asked for vacant for-sale houses and condos in 2022: $424,034.
Median contract rent in 2022: $554 (lower quartile is $465, upper quartile is $658)
Median rent asked for vacant for-rent units in 2022: $497
Median gross rent in Robersonville, NC in 2022: $791
Housing units in Robersonville with a mortgage: 243 (27 second mortgage, 0 home equity loan, 29 both second mortgage and home equity loan)
Houses without a mortgage: 0
Median household income for houses/condos with a mortgage: $70,936
Median household income for apartments without a mortgage: $42,196
Median monthly housing costs: $848
Compare current foreclosures near Robersonville, NC:
| Photo | Address | Area | Beds / Baths | Price | Details |
|---|---|---|---|---|---|

|
#1
Robert Everett Rd
Robersonville, NC 27871
|
2,136 sq. feet
|
1 baths 3 beds |
show details | |

|
#2
Nc 903
Robersonville, NC 27871
|
1,666 sq. feet
|
2 baths 6 beds |
show details | |

|
#3
Claude Green Rd
Robersonville, NC 27871
|
1,347 sq. feet
|
2 baths 3 beds |
show details | |

|
#4
Rogerson Rd
Robersonville, NC 27871
|
1,344 sq. feet
|
2 baths - beds |
show details | |

|
#5
Nc 903
Robersonville, NC 27871
|
- sq. feet
|
- baths - beds |
show details | |

|
#6
Salisbury Rd
Robersonville, NC 27871
|
- sq. feet
|
- baths - beds |
show details | |

|
#7
Nc 903
Robersonville, NC 27871
|
- sq. feet
|
- baths - beds |
show details | |

|
#8
Lloyd Corey Rd
Robersonville, NC 27871
|
- sq. feet
|
- baths - beds |
show details | |

|
#9
Lloyd Corey Rd
Robersonville, NC 27871
|
- sq. feet
|
- baths - beds |
show details | |

|
#10
Country Acres
Washington, NC 27889
|
1,080 sq. feet
|
2 baths 3 beds |
show details |
| Photo | Address | Area | Beds / Baths | Price | Details |
|---|---|---|---|---|---|

|
#11
E Circle Dr
Hamilton, NC 27840
|
1,250 sq. feet
|
1 baths 3 beds |
show details | |

|
#12
Douglas Ave
Greenville, NC 27834
|
1,320 sq. feet
|
2 baths 3 beds |
show details | |

|
#13
N Maple St
Oak City, NC 27857
|
1,857 sq. feet
|
2 baths 3 beds |
show details | |

|
#14
Adams Blvd
Greenville, NC 27858
|
1,505 sq. feet
|
1 baths 3 beds |
show details | |

|
#15
Moore Rd
Greenville, NC 27834
|
1,075 sq. feet
|
1 baths 3 beds |
show details | |

|
#16
Rhett Butler Rd
Greenville, NC 27834
|
2,052 sq. feet
|
2 baths 4 beds |
show details | |

|
#17
Old River Rd
Greenville, NC 27834
|
2,128 sq. feet
|
2 baths 4 beds |
show details | |

|
#18
Landing Cir
Grimesland, NC 27837
|
2,452 sq. feet
|
2 baths 4 beds |
show details | |

|
#19
Scarlett Ohara Rd
Greenville, NC 27834
|
1,944 sq. feet
|
2 baths 4 beds |
show details | |

|
#20
Hatton St
Williamston, NC 27892
|
1,075 sq. feet
|
2 baths 3 beds |
show details |
| Photo | Address | Area | Beds / Baths | Price | Details |
|---|---|---|---|---|---|

|
#21
Tucker Rd
Grimesland, NC 27837
|
1,512 sq. feet
|
2 baths 3 beds |
show details | |

|
#22
Old Creek Rd
Greenville, NC 27834
|
1,621 sq. feet
|
2 baths 3 beds |
show details | |

|
#23
Nc Highway 42 E
Tarboro, NC 27886
|
1,012 sq. feet
|
1 baths 2 beds |
show details | |

|
#24
Coakley Rd
Tarboro, NC 27886
|
1,025 sq. feet
|
1 baths 3 beds |
show details | |

|
#25
Katherines Pl
Greenville, NC 27834
|
1,890 sq. feet
|
2 baths 4 beds |
show details | |

|
#26
Olivia Dr
Greenville, NC 27834
|
1,568 sq. feet
|
2 baths 3 beds |
show details | |

|
#27
Roosevelt Spain Rd
Greenville, NC 27834
|
1,380 sq. feet
|
1 baths 3 beds |
show details | |

|
#28
Tracey Cir
Greenville, NC 27834
|
1,782 sq. feet
|
2 baths 3 beds |
show details | |

|
#29
Bradley Ave
Tarboro, NC 27886
|
1,140 sq. feet
|
1 baths 3 beds |
show details | |

|
#30
Martin Luther King Jr Dr
Tarboro, NC 27886
|
1,068 sq. feet
|
1 baths 3 beds |
show details |
| Photo | Address | Area | Beds / Baths | Price | Details |
|---|---|---|---|---|---|

|
#31
Old River Rd
Greenville, NC 27834
|
2,052 sq. feet
|
2 baths 4 beds |
show details | |

|
#32
Roosevelt Spain Rd
Greenville, NC 27834
|
1,328 sq. feet
|
1 baths 3 beds |
show details | |

|
#33
Slauter St
Greenville, NC 27834
|
1,944 sq. feet
|
2 baths 3 beds |
show details | |

|
#34
Holland Rd
Greenville, NC 27834
|
1,053 sq. feet
|
1 baths 3 beds |
show details | |

|
#35
Jackson Dr
Greenville, NC 27858
|
1,722 sq. feet
|
1 baths 3 beds |
show details | |

|
#36
Chance St
Greenville, NC 27834
|
2,052 sq. feet
|
2 baths 4 beds |
show details | |

|
#37
Us 258 N
Tarboro, NC 27886
|
1,792 sq. feet
|
2 baths 3 beds |
show details | |

|
#38
Stokes Rd
Greenville, NC 27834
|
2,079 sq. feet
|
2 baths 4 beds |
show details | |

|
#39
N Haines St
Williamston, NC 27892
|
1,000 sq. feet
|
1 baths 3 beds |
show details | |

|
#40
Sunny Side Rd
Greenville, NC 27834
|
2,254 sq. feet
|
2 baths 3 beds |
show details |
| Photo | Address | Area | Beds / Baths | Price | Details |
|---|---|---|---|---|---|

|
#41
Prince Rd
Greenville, NC 27858
|
1,837 sq. feet
|
2 baths 3 beds |
show details | |

|
#42
Everetts Rd
Williamston, NC 27892
|
1,836 sq. feet
|
2 baths 3 beds |
show details | |

|
#43
Bailey Rd
Williamston, NC 27892
|
1,792 sq. feet
|
2 baths 3 beds |
show details | |

|
#44
Nc Highway 11 N
Bethel, NC 27812
|
1,971 sq. feet
|
2 baths 3 beds |
show details | |

|
#45
Adams Blvd
Greenville, NC 27858
|
1,505 sq. feet
|
1 baths 3 beds |
show details | |

|
#46
Bonnie Best Rd
Williamston, NC 27892
|
1,056 sq. feet
|
1 baths 3 beds |
show details | |

|
#47
Abbitt Rd
Williamston, NC 27892
|
1,368 sq. feet
|
1 baths 3 beds |
show details | |

|
#48
Prison Camp Rd
Williamston, NC 27892
|
1,144 sq. feet
|
1 baths 2 beds |
show details | |

|
#49
Edwards St
Greenville, NC 27858
|
1,078 sq. feet
|
1 baths 2 beds |
show details | |

|
Check over 1 million property listings on Foreclosure.com!
|
browse all offers | |||

Latest news about housing in Robersonville, NC collected exclusively by city-data.com from local newspapers, TV, and radio stations

 | Greenville Area Developments (11696 replies) |
| Newcomer's Guide to NC Town and County Names & Locations (38 replies) |
| What rural areas are close to Greenville NC???? (9 replies) |
| Relocating from MD to NC, need help! (9 replies) |
| Help!!! We're Looking for a Friendly, Inexpensive, Safe, and Diverse Rocky Mount Neighborhood (32 replies) |
| Robersonville Area...Farmville/Ayden (3 replies) |

Median year apartment built: 1975
Household type by relationship:
Households: 1,503- Male householders: 272 (40 living alone), Female householders: 389 (129 living alone)
338 spouses (338 opposite-sex spouses), 13 unmarried partners, (13 opposite-sex unmarried partners), 301 children (270 natural, 23 adopted, 7 stepchildren), 94 grandchildren, 44 brothers or sisters, 0 parents, 0 foster children, 21 other relatives, 27 non-relatives
Size of family households: 323 2-persons, 75 3-persons, 37 4-persons, 27 5-persons, 23 7-or-more-persons.
Size of nonfamily households: 173 1-person, 22 2-persons.
131 married couples with children.
86 single-parent households (9 men, 77 women).
98.1% of residents of Robersonville speak English at home.
0.1% of residents speak Spanish at home (100% speak English very well).
0.6% of residents speak other Indo-European language at home (100% speak English very well).
1.1% of residents speak Asian or Pacific Island language at home (50% speak English very well, 25% speak English well, 25% speak English not well).
Foreign born population: 30 (2.0%)
(23.3% of them are naturalized citizens)
| Here: | 6.1 |
| State: | 6.4 |
| Here: | 4.8 |
| State: | 4.4 |

- Bedrooms in owner-occupied houses and condos in Robersonville, North Carolina
- 0no bedroom
- 01 bedroom
- 532 bedrooms
- 2953 bedrooms
- 534 bedrooms
- 135+ bedrooms

- Bedrooms in renter-occupied apartments in Robersonville, North Carolina
- 0no bedroom
- 291 bedroom
- 1152 bedrooms
- 1063 bedrooms
- 144 bedrooms
- 05+ bedrooms

- Cars and other vehicles available in Robersonville in owner-occupied houses/condos
- 19no vehicle
- 941 vehicle
- 1462 vehicles
- 633 vehicles
- 64 vehicles
- 875+ vehicles

- Cars and other vehicles available in Robersonville in renter-occupied apartments
- 52no vehicle
- 561 vehicle
- 1312 vehicles
- 183 vehicles
- 74 vehicles
- 05+ vehicles

- Rooms in owner-occupied houses in Robersonville, North Carolina
- 01 room
- 02 rooms
- 03 rooms
- 204 rooms
- 685 rooms
- 1946 rooms
- 737 rooms
- 368 rooms
- 249+ rooms

- Rooms in renter-occupied apartments in Robersonville, North Carolina
- 01 room
- 02 rooms
- 543 rooms
- 604 rooms
- 685 rooms
- 666 rooms
- 147 rooms
- 08 rooms
- 29+ rooms


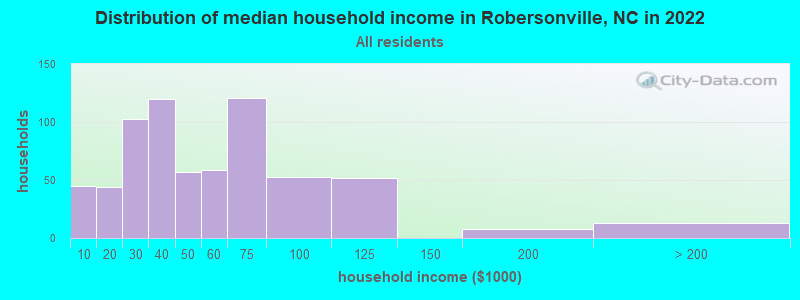
Robersonville, NC household income distribution

- 45Less than $10,000
- 44$10,000 to $19,999
- 103$20,000 to $29,999
- 120$30,000 to $39,999
- 57$40,000 to $49,999
- 59$50,000 to $59,999
- 121$60,000 to $74,999
- 53$75,000 to $99,999
- 52$100,000 to $124,999
- 8$150,000 to $199,999
- 13$200,000 or more
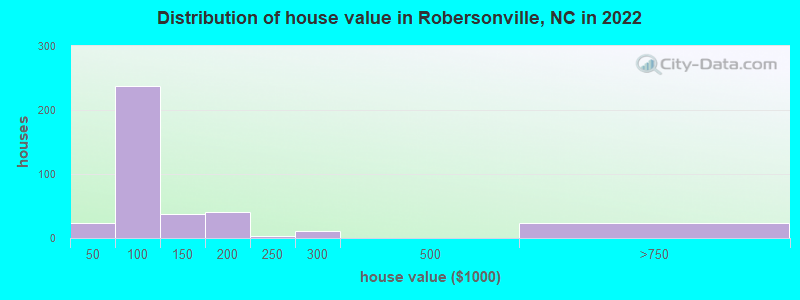
Home value of owner - occupied houses in 2022 in Robersonville, NC
-
- 11$25,000 to $29,999
- 11$40,000 to $49,999
- 17$50,000 to $59,999
- 130$60,000 to $69,999
- 1$70,000 to $79,999
- 47$80,000 to $89,999
- 29$90,000 to $99,999
- 29$100,000 to $124,999
- 8$125,000 to $149,999
- 35$150,000 to $174,999
- 3$175,000 to $199,999
- 2$200,000 to $249,999
- 10$250,000 to $299,999
- 21$500,000 to $749,999
- 1$2,000,000 or more
Rent paid by renters in 2022 in Robersonville, NC
-
- 10$100 to $149
- 1$200 to $249
- 17$250 to $299
- 8$300 to $349
- 6$350 to $399
- 9$400 to $449
- 26$450 to $499
- 44$500 to $549
- 19$550 to $599
- 37$600 to $649
- 7$650 to $699
- 7$700 to $749
- 4$800 to $899
- 2$1,000 to $1,249
- 38No cash rent

Percentage of workers working in this county: 41.0%
Number of people working at home: 35 (5.6% of all workers)
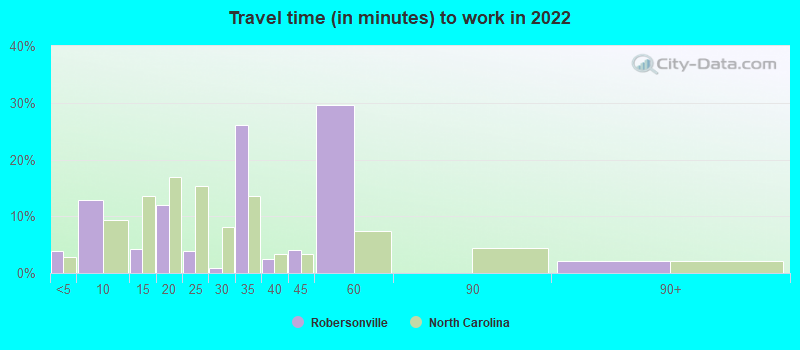
Travel time to work (commute)
- Less than 5 minutes: 8
- 5 to 9 minutes: 54
- 10 to 14 minutes: 19
- 15 to 19 minutes: 115
- 20 to 24 minutes: 148
- 25 to 29 minutes: 6
- 30 to 34 minutes: 100
- 35 to 39 minutes: 0
- 40 to 44 minutes: 7
- 45 to 59 minutes: 47
- 60 to 89 minutes: 47
- 90 or more minutes: 17
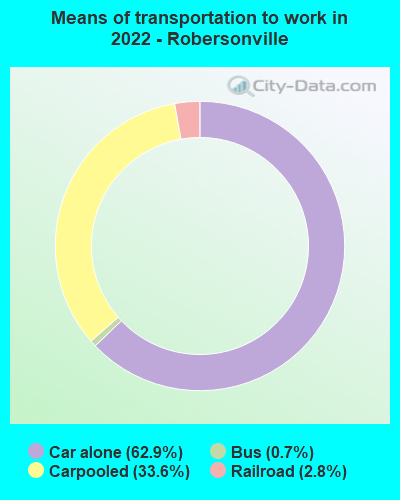
Means of transportation to work:
- Drove a car alone: 514 (56.7%)
- Carpooled: 277 (30.6%)
- Bus: 4 (0.4%)
- Light rail, streetcar or trolley: 37 (4.1%)
- Worked at home: 57 (6.3%)
- Unemployment by race in 2022
- Unemployment rate for Black residents
- 3.3%Males
- 6.8%Females

- Year of entry for the foreign-born population in Robersonville, North Carolina
- 212010 or later
- 62000 to 2009
- 01990 to 1999
- 01980 to 1989
- 71970 to 1979
- 0Before 1970
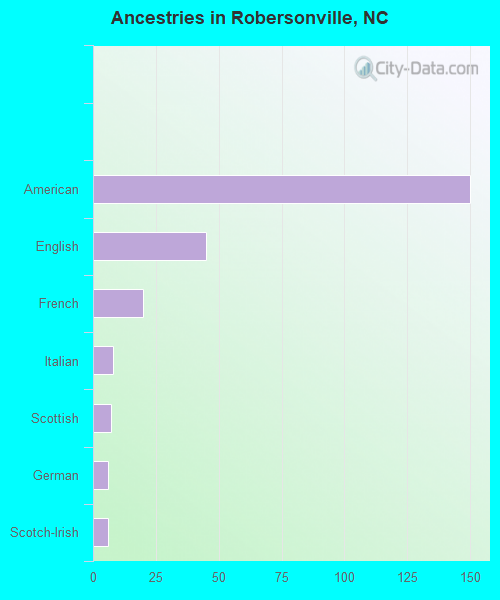
First ancestries reported:
- American: 150 (14.8%)
- English: 45 (4.4%)
- French: 20 (2.0%)
- Italian: 8 (0.8%)
- Scottish: 7 (0.7%)
- German: 6 (0.6%)
- Scotch-Irish: 6 (0.6%)
- Irish: 1 (0.10%)
Most common places of birth for foreign-born residents (%):
| Robersonville: | 46.7% (14) |
| North Carolina: | 1.8% (15,988) |
| Robersonville: | 13.3% (4) |
| North Carolina: | 0.5% (4,315) |
| Robersonville: | 10.0% (3) |
| North Carolina: | 2.9% (24,965) |
| Robersonville: | 10.0% (3) |
| North Carolina: | 2.4% (20,695) |
| Robersonville: | 6.7% (2) |
| North Carolina: | 1.8% (15,534) |
Place of birth for U.S.-born residents:
- This state: 1,113
- Other state: 342
- Northeast: 85
- Midwest: 19
- South: 188
- West: 47
87.9% of Robersonville residents lived in the same house 1 years ago.
Out of people who lived in different houses, 24.5% lived in this county.
Out of people who lived in different counties, 89.3% lived in North Carolina.
| Robersonville: | 87.9% |
| State average: | 87.3% |
Education attainment for males 25 years and older:
- No schooling: 21
- Nursery to 4th grade: 0
- 5th and 6th grade: 0
- 7th and 8th grade: 27
- 9th grade: 7
- 10th grade: 0
- 11th grade: 12
- 12th grade, no diploma: 5
- High school graduate (or equivalency): 176
- Less than 1 year of college: 53
- Some college more than 1 year, no degree: 121
- Associate degree: 23
- Bachelor's degree: 32
- Master's degree: 8
- Professional school degree: 0
- Doctorate degree: 23

Education attainment for females 25 years and older:
- No schooling: 0
- Nursery to 4th grade: 0
- 5th and 6th grade: 0
- 7th and 8th grade: 28
- 9th grade: 17
- 10th grade: 34
- 11th grade: 18
- 12th grade, no diploma: 4
- High school graduate (or equivalency): 192
- Less than 1 year of college: 64
- Some college more than 1 year, no degree: 99
- Associate degree: 62
- Bachelor's degree: 87
- Master's degree: 5
- Professional school degree: 4
- Doctorate degree: 1


Housing units in structures:
- One, detached: 735
- One, attached: 4
- Two: 76
- 3 or 4: 6
- 5 to 9: 12
- Mobile homes: 6
House/condo owner moved in on average 17 years ago
Renter moved in on average 5 years ago

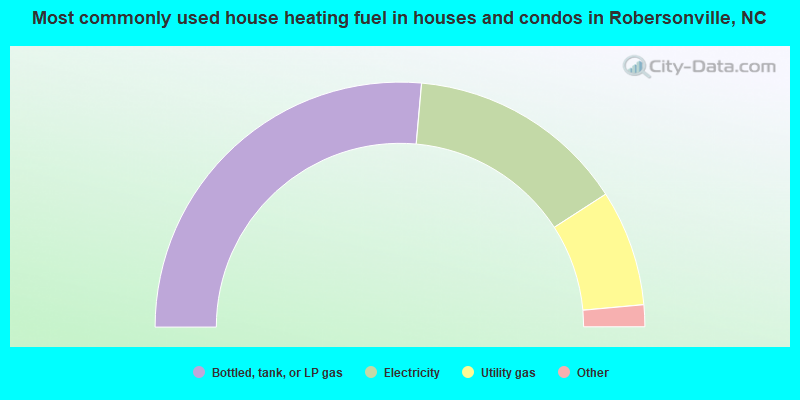
- 53.0%Bottled, tank, or LP gas
- 29.0%Electricity
- 15.4%Utility gas
- 1.5%Fuel oil, kerosene, etc.
- 1.0%Wood
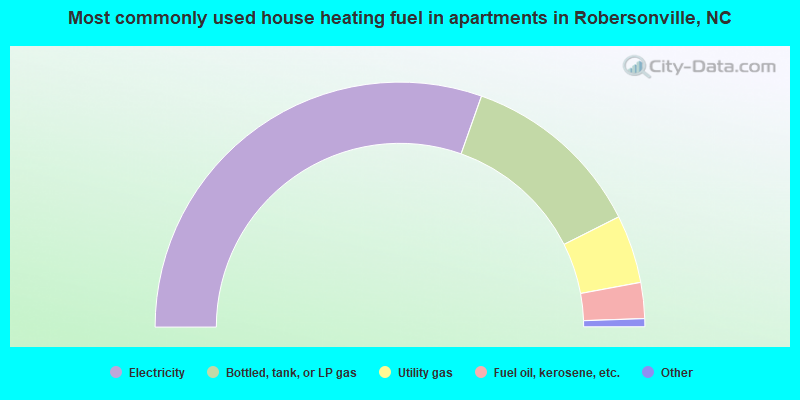
- 61.5%Electricity
- 24.6%Bottled, tank, or LP gas
- 9.1%Utility gas
- 4.8%Fuel oil, kerosene, etc.
Private vs. public school enrollment:
| Here: | 5.1% |
| North Carolina: | 13.8% |
| Here: | 3.3% |
| North Carolina: | 11.9% |
| Here: | 36.7% |
| North Carolina: | 19.3% |


