Robinson, IL (Illinois) Houses and Residents
| Robinson: | $99,651 |
| Illinois: | $251,600 |
Total population: 7,622 (Urban population: 6,698 (all inside urban clusters), Rural population: 0)
Houses: 3,213 (2,612 occupied: 1,784 owner occupied, 860 renter occupied)
| % of renters here: | 33% |
| State: | 33% |
Housing density: 886 houses/condos per square mile
Median price asked for vacant for-sale houses and condos in 2022: $70,807.
Median contract rent in 2022: $542 (lower quartile is $457, upper quartile is $724)
Median rent asked for vacant for-rent units in 2022: $1,424
Median gross rent in Robinson, IL in 2022: $802
Housing units in Robinson with a mortgage: 1,189 (200 second mortgage, 4 home equity loan, 169 both second mortgage and home equity loan)
Houses without a mortgage: 150
Median household income for houses/condos with a mortgage: $81,910
Median household income for apartments without a mortgage: $50,635
Median monthly housing costs: $789
Compare current foreclosures near Robinson, IL:
| Photo | Address | Area | Beds / Baths | Price | Details |
|---|---|---|---|---|---|

|
#1
W Updike St
Robinson, IL 62454
|
1,305 sq. feet
|
1 baths 4 beds |
show details | |

|
#2
E Laurel Ln
Robinson, IL 62454
|
1,574 sq. feet
|
2 baths 4 beds |
show details | |

|
#3
E Plum St
Robinson, IL 62454
|
- sq. feet
|
- baths - beds |
show details | |

|
#4
E Mefford St
Robinson, IL 62454
|
- sq. feet
|
- baths - beds |
show details | |

|
#5
E 900th Ave
Robinson, IL 62454
|
- sq. feet
|
- baths - beds |
show details | |

|
#6
S Prairie St Apt E1
Robinson, IL 62454
|
- sq. feet
|
- baths - beds |
show details | |

|
#7
State Highway 1
Robinson, IL 62454
|
- sq. feet
|
- baths - beds |
show details | |

|
#8
E Main St
Robinson, IL 62454
|
- sq. feet
|
- baths - beds |
show details | |

|
#9
N Cross St
Robinson, IL 62454
|
- sq. feet
|
- baths - beds |
show details | |

|
#10
W Tulip Ln
Robinson, IL 62454
|
- sq. feet
|
- baths - beds |
show details |
| Photo | Address | Area | Beds / Baths | Price | Details |
|---|---|---|---|---|---|

|
#11
N Truman St
Robinson, IL 62454
|
- sq. feet
|
- baths - beds |
show details | |

|
#12
S Park St
Robinson, IL 62454
|
- sq. feet
|
- baths - beds |
show details | |

|
#13
E Saint Petersburg St
Robinson, IL 62454
|
- sq. feet
|
- baths - beds |
show details | |

|
#14
E Clearwater St
Robinson, IL 62454
|
- sq. feet
|
- baths - beds |
show details | |

|
#15
S Willow Dr
Robinson, IL 62454
|
- sq. feet
|
- baths - beds |
show details | |

|
#16
E Plum St
Robinson, IL 62454
|
- sq. feet
|
- baths - beds |
show details | |

|
#17
N Robb St
Robinson, IL 62454
|
- sq. feet
|
- baths - beds |
show details | |

|
#18
W Iowa St
Oblong, IL 62449
|
907 sq. feet
|
1 baths 2 beds |
show details | |

|
#19
N County Road 800 W
Sullivan, IN 47882
|
1,341 sq. feet
|
2 baths 3 beds |
show details | |

|
#20
E Angling Rd
West Union, IL 62477
|
1,958 sq. feet
|
1 baths - beds |
show details |
| Photo | Address | Area | Beds / Baths | Price | Details |
|---|---|---|---|---|---|

|
#21
N County Road 700 W
Sullivan, IN 47882
|
- sq. feet
|
- baths - beds |
show details | |

|
#22
Gollyville Rd
Flat Rock, IL 62427
|
- sq. feet
|
- baths - beds |
show details | |

|
#23
N Plum St
Flat Rock, IL 62427
|
- sq. feet
|
- baths - beds |
show details | |

|
#24
E Illinois St
Oblong, IL 62449
|
- sq. feet
|
- baths - beds |
show details | |

|
#25
E Franklin St
Palestine, IL 62451
|
- sq. feet
|
- baths - beds |
show details | |

|
#26
N Jasper St
Oblong, IL 62449
|
- sq. feet
|
- baths - beds |
show details | |

|
#27
N Plum St
Flat Rock, IL 62427
|
- sq. feet
|
- baths - beds |
show details | |

|
#28
S Main St
Palestine, IL 62451
|
- sq. feet
|
- baths - beds |
show details | |

|
#29
N Steele St
Palestine, IL 62451
|
- sq. feet
|
- baths - beds |
show details | |

|
#30
E Washington Ave
Stoy, IL 62464
|
- sq. feet
|
- baths - beds |
show details |
| Photo | Address | Area | Beds / Baths | Price | Details |
|---|---|---|---|---|---|

|
#31
Church St.
Willow Hill, IL 62480
|
- sq. feet
|
- baths - beds |
show details | |

|
Check over 1 million property listings on Foreclosure.com!
|
browse all offers | |||

Latest news about housing in Robinson, IL collected exclusively by city-data.com from local newspapers, TV, and radio stations

 | Looking to buy a townhome/SF in Westmont,Downers grove. Need tips! (1 reply) |
| Young professional choosing Chicago over NYC need advice!! (33 replies) |
| what Makes Chicago Public Schools Bad (207 replies) |
| Charleston, Illinois (7 replies) |
| Is Chicago diverse? (51 replies) |
| We want an awesome treehouse/fort/playset (16 replies) |

Median year apartment built: 1964
Household type by relationship:
Households: 6,991- Male householders: 1,166 (380 living alone), Female householders: 1,397 (505 living alone)
1,152 spouses (1,133 opposite-sex spouses), 191 unmarried partners, (185 opposite-sex unmarried partners), 1,424 children (1,343 natural, 35 adopted, 45 stepchildren), 66 grandchildren, 19 brothers or sisters, 13 parents, 9 foster children, 43 other relatives, 17 non-relatives
- In group quarters: 1,488
Size of family households: 820 2-persons, 437 3-persons, 261 4-persons, 87 5-persons, 6 6-persons, 23 7-or-more-persons.
Size of nonfamily households: 933 1-person, 71 2-persons, 5 4-persons.
707 married couples with children.
401 single-parent households (92 men, 309 women).
95.6% of residents of Robinson speak English at home.
2.6% of residents speak Spanish at home (58% speak English very well, 9% speak English well, 15% speak English not well, 18% don't speak English at all).
1.0% of residents speak other Indo-European language at home (86% speak English very well, 14% speak English well).
0.1% of residents speak Asian or Pacific Island language at home (100% speak English very well).
0.4% of residents speak other language at home (100% speak English very well).
Foreign born population: 117 (1.7%)
(35.9% of them are naturalized citizens)
| Here: | 6.4 |
| State: | 6.4 |
| Here: | 4.5 |
| State: | 4.1 |

- Bedrooms in owner-occupied houses and condos in Robinson, Illinois
- 0no bedroom
- 501 bedroom
- 4012 bedrooms
- 9493 bedrooms
- 2814 bedrooms
- 1045+ bedrooms

- Bedrooms in renter-occupied apartments in Robinson, Illinois
- 21no bedroom
- 1211 bedroom
- 4772 bedrooms
- 2043 bedrooms
- 314 bedrooms
- 75+ bedrooms

- Cars and other vehicles available in Robinson in owner-occupied houses/condos
- 17no vehicle
- 4041 vehicle
- 8902 vehicles
- 3603 vehicles
- 1134 vehicles
- 05+ vehicles

- Cars and other vehicles available in Robinson in renter-occupied apartments
- 191no vehicle
- 4691 vehicle
- 1562 vehicles
- 383 vehicles
- 74 vehicles
- 05+ vehicles

- Rooms in owner-occupied houses in Robinson, Illinois
- 01 room
- 02 rooms
- 333 rooms
- 904 rooms
- 3295 rooms
- 4696 rooms
- 2267 rooms
- 2998 rooms
- 3409+ rooms

- Rooms in renter-occupied apartments in Robinson, Illinois
- 211 room
- 332 rooms
- 943 rooms
- 2714 rooms
- 1925 rooms
- 1216 rooms
- 727 rooms
- 508 rooms
- 79+ rooms


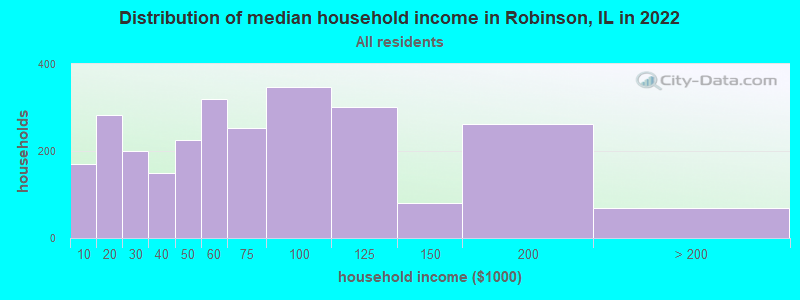
Robinson, IL household income distribution

- 170Less than $10,000
- 282$10,000 to $19,999
- 201$20,000 to $29,999
- 150$30,000 to $39,999
- 225$40,000 to $49,999
- 320$50,000 to $59,999
- 253$60,000 to $74,999
- 348$75,000 to $99,999
- 302$100,000 to $124,999
- 81$125,000 to $149,999
- 262$150,000 to $199,999
- 70$200,000 or more
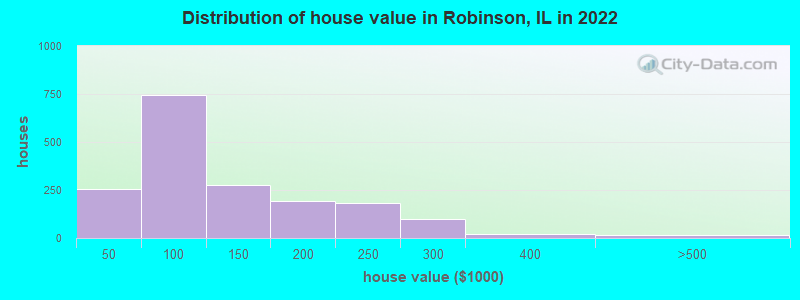
Home value of owner - occupied houses in 2022 in Robinson, IL
-
- 38Less than $10,000
- 7$10,000 to $14,999
- 7$15,000 to $19,999
- 32$25,000 to $29,999
- 65$30,000 to $34,999
- 25$35,000 to $39,999
- 76$40,000 to $49,999
- 98$50,000 to $59,999
- 113$60,000 to $69,999
- 128$70,000 to $79,999
- 233$80,000 to $89,999
- 96$90,000 to $99,999
- 177$100,000 to $124,999
- 99$125,000 to $149,999
- 90$150,000 to $174,999
- 100$175,000 to $199,999
- 182$200,000 to $249,999
- 99$250,000 to $299,999
- 21$300,000 to $399,999
- 14$400,000 to $499,999
Rent paid by renters in 2022 in Robinson, IL
-
- 36Less than $100
- 7$100 to $149
- 41$150 to $199
- 29$200 to $249
- 34$300 to $349
- 10$350 to $399
- 9$400 to $449
- 123$450 to $499
- 122$500 to $549
- 42$550 to $599
- 33$600 to $649
- 71$650 to $699
- 101$700 to $749
- 28$750 to $799
- 14$800 to $899
- 52$900 to $999
- 54$1,000 to $1,249
- 7$1,500 to $1,999
- 14No cash rent


Percentage of workers working in this county: 91.3%
Number of people working at home: 351 (12.4% of all workers)
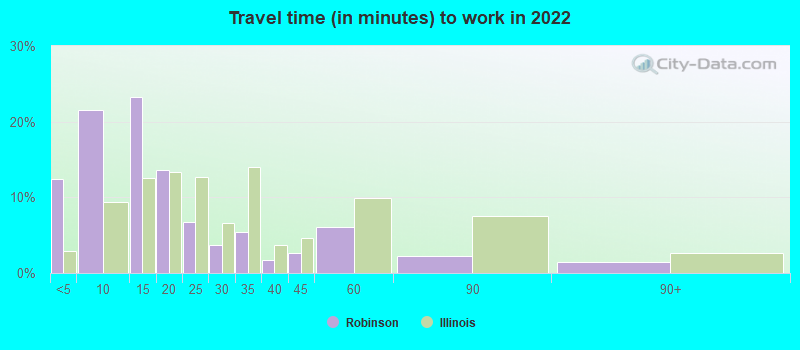
Travel time to work (commute)
- Less than 5 minutes: 657
- 5 to 9 minutes: 804
- 10 to 14 minutes: 409
- 15 to 19 minutes: 192
- 20 to 24 minutes: 88
- 25 to 29 minutes: 19
- 30 to 34 minutes: 73
- 35 to 39 minutes: 57
- 40 to 44 minutes: 56
- 45 to 59 minutes: 64
- 60 to 89 minutes: 43
- 90 or more minutes: 7
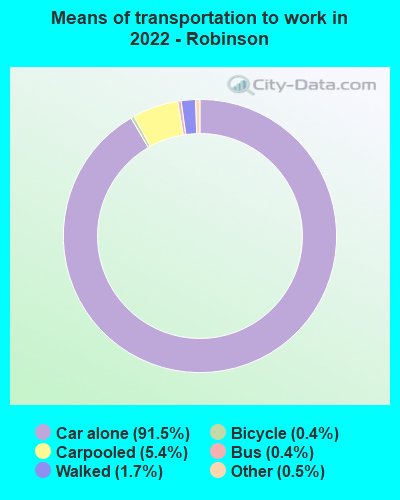
Means of transportation to work:
- Drove a car alone: 5,140 (84.3%)
- Carpooled: 322 (5.3%)
- Bus: 23 (0.4%)
- Taxi: 32 (0.5%)
- Bicycle: 25 (0.4%)
- Walked: 95 (1.6%)
- Worked at home: 351 (5.8%)

- Unemployment by race in 2022
- Unemployment rate for White non-Hispanic residents
- 4.8%Males
- 1.3%Females
- Unemployment rate for two or more race residents
- 52.4%Males
- 5.7%Females
- Unemployment rate for Hispanic or Latino residents
- 20.7%Males

- Year of entry for the foreign-born population in Robinson, Illinois
- 82010 or later
- 372000 to 2009
- 81990 to 1999
- 101980 to 1989
- 291970 to 1979
- 16Before 1970

First ancestries reported:
- Irish: 557 (16.5%)
- German: 539 (15.9%)
- English: 444 (13.1%)
- American: 337 (10.0%)
- European: 94 (2.8%)
- Italian: 85 (2.5%)
- French: 48 (1.4%)
- Croatian: 35 (1.0%)
- Czech: 28 (0.8%)
- Scottish: 25 (0.7%)
- British: 17 (0.5%)
- Scandinavian: 13 (0.4%)
- Polish: 12 (0.4%)
- Greek: 11 (0.3%)
- Dutch: 6 (0.2%)
- Scotch-Irish: 4 (0.1%)
- Turkish: 4 (0.1%)
- Russian: 2 (0.06%)
Most common places of birth for foreign-born residents (%):
| Robinson: | 33.3% (39) |
| Illinois: | 34.7% (626,958) |
| Robinson: | 22.2% (26) |
| Illinois: | 5.2% (93,003) |
| Robinson: | 17.9% (21) |
| Illinois: | 0.5% (8,778) |
| Robinson: | 14.5% (17) |
| Illinois: | 0.6% (11,009) |
| Robinson: | 6.0% (7) |
| Illinois: | 1.3% (22,793) |
| Robinson: | 5.1% (6) |
| Illinois: | 0.6% (10,720) |
Place of birth for U.S.-born residents:
- This state: 4,485
- Other state: 2,336
- Northeast: 95
- Midwest: 1,544
- South: 506
- West: 192
80.7% of Robinson residents lived in the same house 1 years ago.
Out of people who lived in different houses, 20.1% lived in this county.
Out of people who lived in different counties, 90.7% lived in Illinois.
| Robinson: | 80.7% |
| State average: | 88.3% |
Education attainment for males 25 years and older:
- No schooling: 26
- Nursery to 4th grade: 38
- 5th and 6th grade: 51
- 7th and 8th grade: 50
- 9th grade: 171
- 10th grade: 176
- 11th grade: 174
- 12th grade, no diploma: 40
- High school graduate (or equivalency): 735
- Less than 1 year of college: 176
- Some college more than 1 year, no degree: 432
- Associate degree: 379
- Bachelor's degree: 360
- Master's degree: 209
- Professional school degree: 23
- Doctorate degree: 11

Education attainment for females 25 years and older:
- No schooling: 7
- Nursery to 4th grade: 4
- 5th and 6th grade: 8
- 7th and 8th grade: 43
- 9th grade: 51
- 10th grade: 52
- 11th grade: 17
- 12th grade, no diploma: 33
- High school graduate (or equivalency): 501
- Less than 1 year of college: 140
- Some college more than 1 year, no degree: 253
- Associate degree: 422
- Bachelor's degree: 484
- Master's degree: 132
- Professional school degree: 0
- Doctorate degree: 18


Housing units in structures:
- One, detached: 2,686
- One, attached: 8
- Two: 100
- 3 or 4: 149
- 5 to 9: 80
- 10 to 19: 24
- 20 to 49: 131
- Mobile homes: 24
- Boats, RVs, vans, etc.: 9
Housing units lacking complete kitchen facilities in 2022: 9.9%
House/condo owner moved in on average 12 years ago
Renter moved in on average 5 years ago

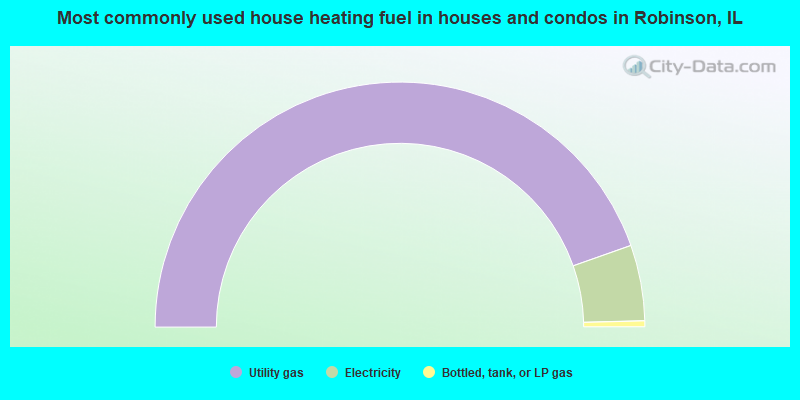
- 89.2%Utility gas
- 10.0%Electricity
- 0.8%Bottled, tank, or LP gas
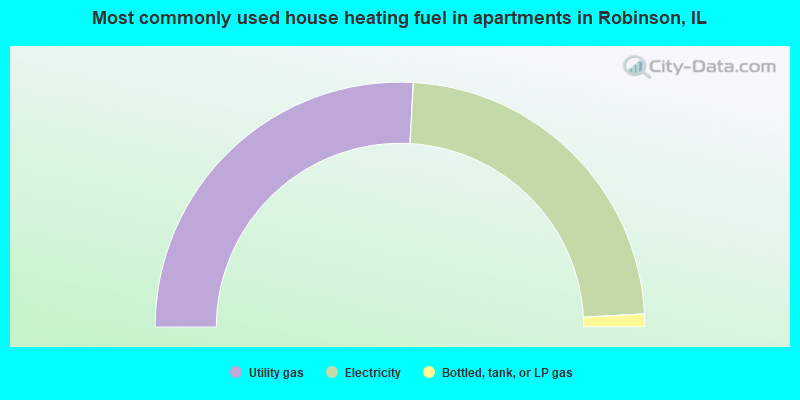
- 51.8%Utility gas
- 46.6%Electricity
- 1.7%Bottled, tank, or LP gas
Private vs. public school enrollment:
| Here: | 3.6% |
| Illinois: | 13.3% |
| Here: | 15.6% |
| Illinois: | 9.9% |
| Here: | 18.2% |
| Illinois: | 27.4% |


