Housing density: 943 houses/condos per square mile
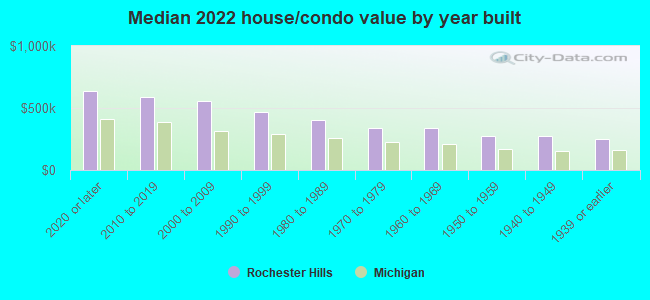
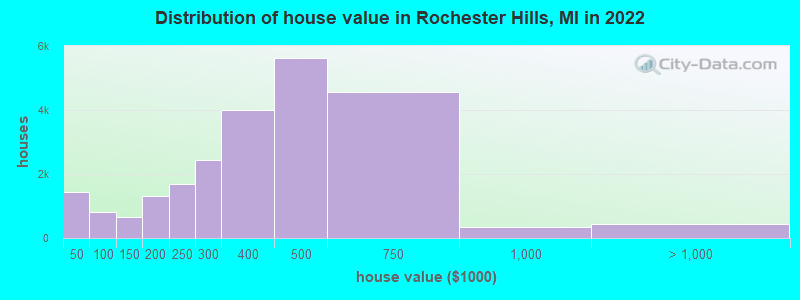
Median price asked for vacant for-sale houses and condos in 2022: $291,550.
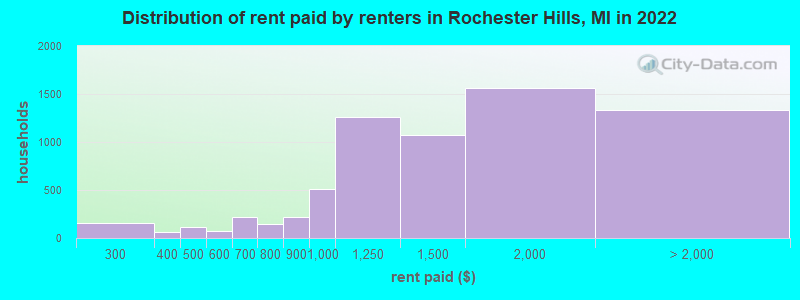
Median contract rent in 2022: $1,334 (lower quartile is $1,016, upper quartile is $1,843)
Median rent asked for vacant for-rent units in 2022: $2,914
Median gross rent in Rochester Hills, MI in 2022: $1,585
Housing units in Rochester Hills with a mortgage: 14,640 (1,969 second mortgage, 0 home equity loan, 1,848 both second mortgage and home equity loan) Houses without a mortgage: 211
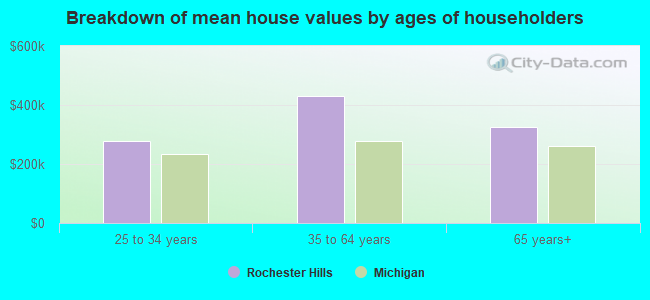
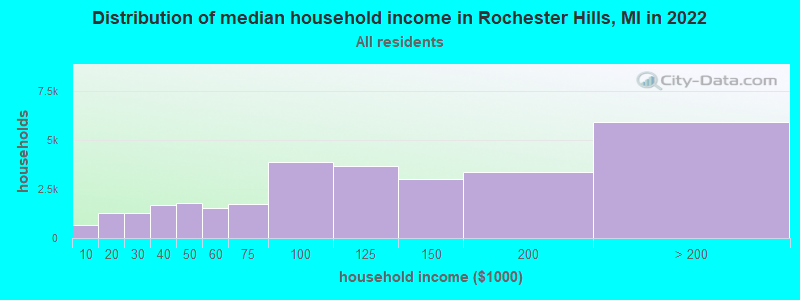
Median household income for houses/condos with a mortgage: $141,372
Median household income for apartments without a mortgage: $87,733
Median monthly housing costs: $1,504
Compare current foreclosures near Rochester Hills, MI:
Size of family households: 8,125 2-persons, 4,647 3-persons, 4,823 4-persons, 1,497 5-persons, 377 6-persons, 435 7-or-more-persons.
Size of nonfamily households: 9,187 1-person, 831 2-persons.
13,466 married couples with children.
2,363 single-parent households (625 men, 1,738 women).
76.7% of residents of Rochester Hills speak English at home.
2.7% of residents speak Spanish at home (75% speak English very well, 14% speak English well, 10% speak English not well, 1% don't speak English at all).
10.4% of residents speak other Indo-European language at home (80% speak English very well, 14% speak English well, 4% speak English not well, 1% don't speak English at all).
7.4% of residents speak Asian or Pacific Island language at home (59% speak English very well, 26% speak English well, 13% speak English not well, 1% don't speak English at all).
2.3% of residents speak other language at home (79% speak English very well, 14% speak English well, 5% speak English not well, 2% don't speak English at all).
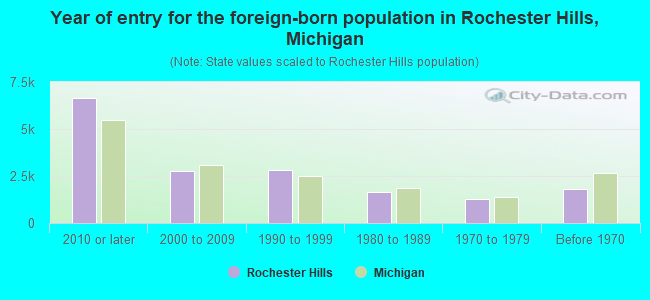
Foreign born population: 12,163 (16.0%)
(53.5% of them are naturalized citizens)
Year of entry for the foreign-born population in Rochester Hills, Michigan
6,6352010 or later
2,7642000 to 2009
2,8361990 to 1999
1,6481980 to 1989
1,2671970 to 1979
1,810Before 1970
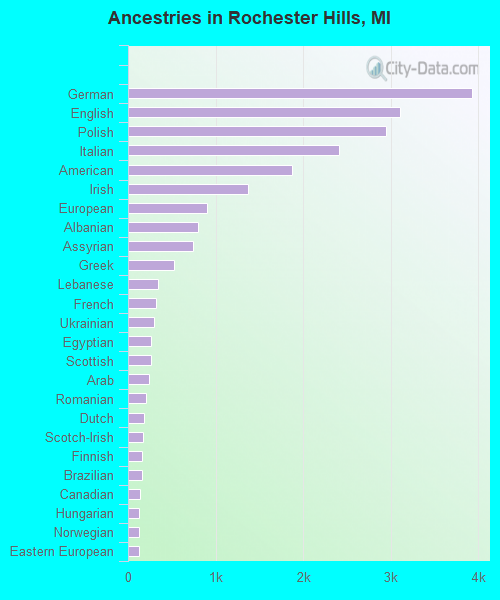
First ancestries reported:
German: 3,929 (10.1%)
English: 3,110 (8.0%)
Polish: 2,951 (7.6%)
Italian: 2,416 (6.2%)
American: 1,876 (4.8%)
Irish: 1,377 (3.5%)
European: 905 (2.3%)
Albanian: 803 (2.1%)
Assyrian: 745 (1.9%)
Greek: 531 (1.4%)
Lebanese: 348 (0.9%)
French: 320 (0.8%)
Ukrainian: 298 (0.8%)
Egyptian: 266 (0.7%)
Scottish: 264 (0.7%)
Arab: 240 (0.6%)
Romanian: 207 (0.5%)
Dutch: 183 (0.5%)
Scotch-Irish: 172 (0.4%)
Finnish: 162 (0.4%)
Brazilian: 159 (0.4%)
Canadian: 138 (0.4%)
Hungarian: 131 (0.3%)
Norwegian: 130 (0.3%)
Eastern European: 123 (0.3%)
Belgian: 122 (0.3%)
French Canadian: 116 (0.3%)
Jordanian: 114 (0.3%)
Macedonian: 109 (0.3%)
Slovak: 106 (0.3%)
Portuguese: 99 (0.3%)
British: 95 (0.2%)
Armenian: 84 (0.2%)
Czech: 76 (0.2%)
Serbian: 74 (0.2%)
Croatian: 71 (0.2%)
Ghanaian: 65 (0.2%)
Iranian: 62 (0.2%)
Australian: 61 (0.2%)
Moroccan: 60 (0.2%)
African: 58 (0.1%)
Welsh: 58 (0.1%)
Northern European: 55 (0.1%)
Russian: 53 (0.1%)
Danish: 46 (0.1%)
Palestinian: 45 (0.1%)
Swiss: 44 (0.1%)
Swedish: 42 (0.1%)
Scandinavian: 39 (0.1%)
Syrian: 28 (0.07%)
Lithuanian: 28 (0.07%)
Slavic: 24 (0.06%)
Czechoslovakian: 23 (0.06%)
Yugoslavian: 20 (0.05%)
Austrian: 19 (0.05%)
Maltese: 15 (0.04%)
South African: 11 (0.03%)
Iraqi: 10 (0.03%)
Barbadian: 9 (0.02%)
Nigerian: 8 (0.02%)
Latvian: 6 (0.02%)
Jamaican: 5 (0.01%)
Liberian: 3 (0.01%)
Most common places of birth for foreign-born residents (%):
India
Rochester Hills:
25.0% (3,731)
Michigan:
11.1% (77,240)
China, excluding Hong Kong and Taiwan
Rochester Hills:
10.0% (1,499)
Michigan:
4.9% (34,295)
Korea
Rochester Hills:
8.0% (1,198)
Michigan:
3.0% (20,884)
Mexico
Rochester Hills:
5.9% (883)
Michigan:
10.9% (75,965)
Brazil
Rochester Hills:
4.0% (592)
Michigan:
1.1% (7,485)
Canada
Rochester Hills:
3.7% (550)
Michigan:
5.0% (35,052)
Iraq
Rochester Hills:
3.4% (504)
Michigan:
8.1% (55,954)
Germany
Rochester Hills:
3.1% (467)
Michigan:
2.3% (16,126)
Italy
Rochester Hills:
2.8% (414)
Michigan:
1.1% (7,792)
Philippines
Rochester Hills:
2.5% (368)
Michigan:
2.8% (19,112)
Ukraine
Rochester Hills:
2.0% (306)
Michigan:
1.0% (6,829)
Other Middle Africa
Rochester Hills:
1.8% (267)
Michigan:
0.1% (536)
Pakistan
Rochester Hills:
1.8% (264)
Michigan:
1.5% (10,596)
Romania
Rochester Hills:
1.8% (262)
Michigan:
1.2% (8,563)
Egypt
Rochester Hills:
1.7% (259)
Michigan:
0.6% (3,827)
Place of birth for U.S.-born residents:
This state: 52,289
Other state: 11,129
Northeast: 2,936
Midwest: 4,856
South: 1,989
West: 1,348
88.8% of Rochester Hills residents lived in the same house 1 years ago. Out of people who lived in different houses, 35.8% lived in this county. Out of people who lived in different counties, 74.9% lived in Michigan.
Rochester Hills:
88.8%
State average:
88.4%
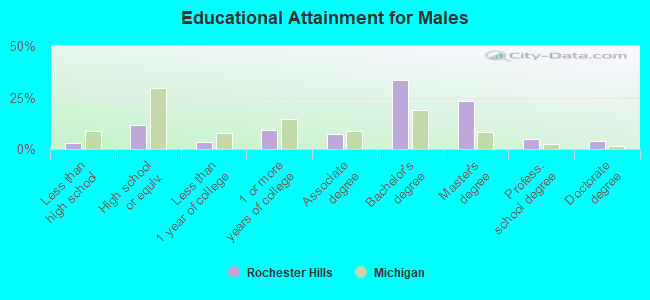
Education attainment for males 25 years and older:
No schooling: 48
Nursery to 4th grade: 7
5th and 6th grade: 0
7th and 8th grade: 0
9th grade: 301
10th grade: 109
11th grade: 3
12th grade, no diploma: 240
High school graduate (or equivalency): 2,916
Less than 1 year of college: 868
Some college more than 1 year, no degree: 2,245
Associate degree: 1,796
Bachelor's degree: 8,203
Master's degree: 5,697
Professional school degree: 1,220
Doctorate degree: 954
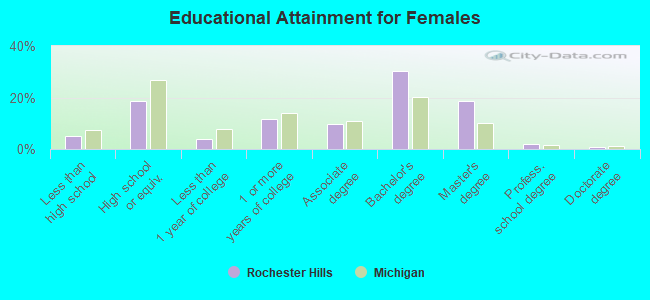
Education attainment for females 25 years and older:
No schooling: 275
Nursery to 4th grade: 0
5th and 6th grade: 0
7th and 8th grade: 43
9th grade: 165
10th grade: 369
11th grade: 0
12th grade, no diploma: 561
High school graduate (or equivalency): 5,233
Less than 1 year of college: 1,066
Some college more than 1 year, no degree: 3,328
Associate degree: 2,718
Bachelor's degree: 8,561
Master's degree: 5,305
Professional school degree: 511
Doctorate degree: 168
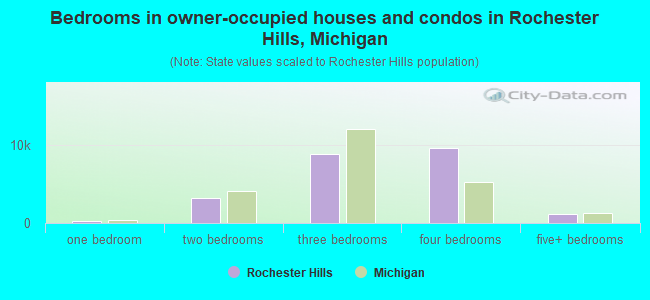
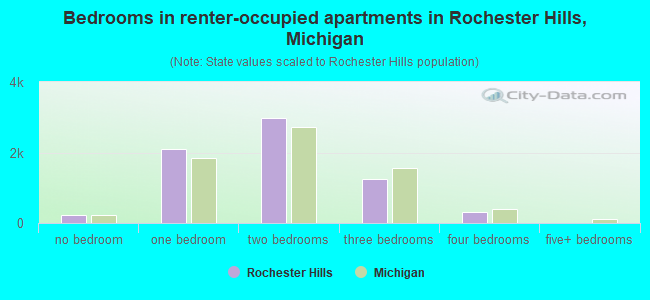
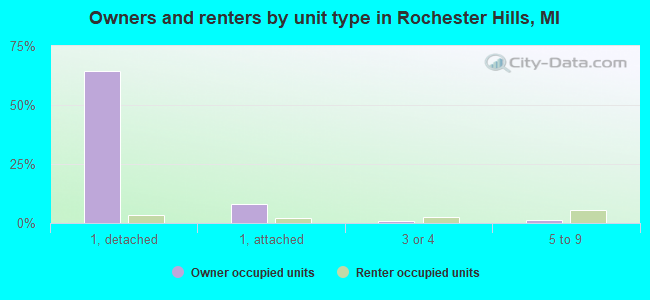
Housing units in structures:
One, detached: 20,007
One, attached: 3,147
3 or 4: 678
5 to 9: 2,582
10 to 19: 1,140
20 to 49: 345
50 or more: 1,521
Mobile homes: 1,552
Median worth of mobile homes: $9,999
Housing units lacking complete plumbing facilities in 2022: 0.1%
Housing units lacking complete kitchen facilities in 2022: 2.5%
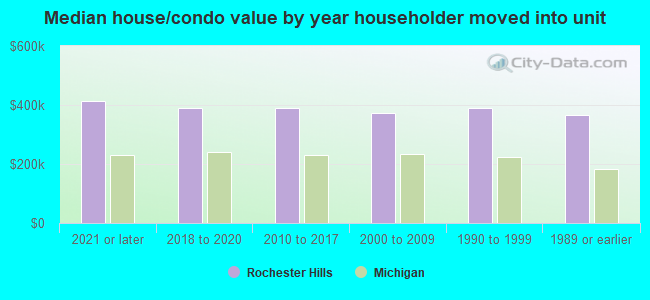
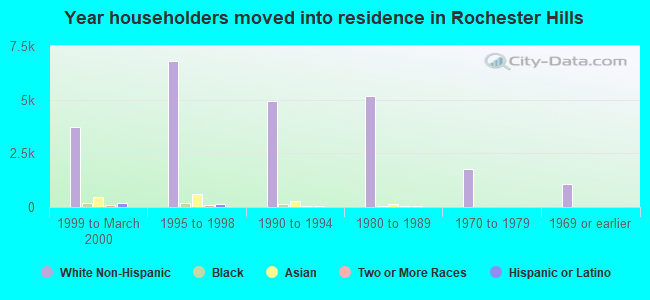
House/condo owner moved in on average 12 years ago