Rock Falls, IL (Illinois) Houses and Residents
Estimated median house or condo value in 2022: $87,655 (it was $63,000 in 2000 )
Rock Falls:
$87,655Illinois:
$251,600
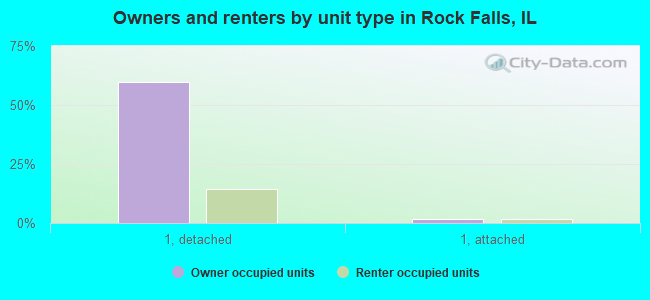
Lower value quartile - upper value quartile: $67,643 - $129,946Mean price in 2022: Detached houses: $111,387 Here:
$111,387State:
$310,164
Townhouses or other attached units: $232,365 Here:
$232,365State:
$286,230
In 2-unit structures: $133,730 Here:
$133,730State:
$299,638
Mobile homes: $166,813 Here:
$166,813State:
$78,855
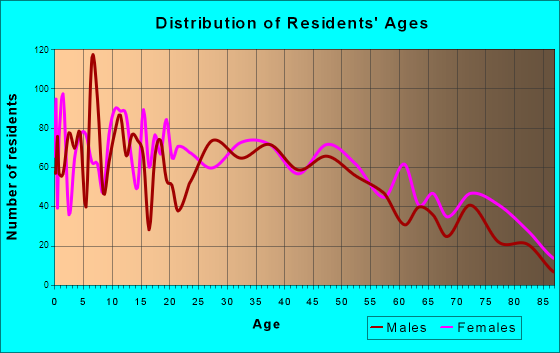
Total population: 9,062 (All urban)
Houses: 4,452 (3,987 occupied: 2,621 owner occupied, 1,417 renter occupied )
% of renters here:
35%State:
33%
Housing density: 1,342 houses/condos per square mile
Median price asked for vacant for-sale houses and condos in 2022: $44,453.
Median contract rent in 2022: $552 (lower quartile is $445, upper quartile is $609)
Median rent asked for vacant for-rent units in 2022: $734
Median gross rent in Rock Falls, IL in 2022: $750
Housing units in Rock Falls with a mortgage: 1,630 (131 second mortgage, 0 home equity loan, 115 both second mortgage and home equity loan )Houses without a mortgage: 55
Median household income for houses/condos with a mortgage: $59,421
Median household income for apartments without a mortgage: $49,707
Median monthly housing costs: $749
Data:
Median house or condo value ($)
Median house or condo value ($ change since 2000)
Median house or condo value ($) - White
Median house or condo value ($) - Black or African American
Median house or condo value ($) - Asian
Median house or condo value ($) - Hispanic or Latino
Median house or condo value ($) - American Indian and Alaska Native
Median house or condo value ($) - Multirace
Median house or condo value ($) - Other Race
Median price asked for mobile homes ($)
Household density (households per square mile)
Mean house or condo value by units in structure - 1, detached ($)
Mean house or condo value by units in structure - 1, attached ($)
Mean house or condo value by units in structure - 2 ($)
Mean house or condo value by units in structure by units in structure - 3 or 4 ($)
Mean house or condo value by units in structure - 5 or more ($)
Mean house or condo value by units in structure - Boat, RV, van, etc. ($)
Mean house or condo value by units in structure - Mobile home ($)
Median contract rent ($)
Median contract rent - Lower quartile ($)
Median contract rent - Upper quartile ($)
Median gross rent ($)
Urban houses (%)
Rural houses (%)
Houses occupied (%)
Houses occupied (% change since 2000)
Houses owner occupied (%)
Houses owner occupied (% change since 2000)
Houses renter occupied (%)
Houses renter occupied (% change since 2000)
Vacant housing units - For rent (%)
Vacant housing units - For rent (% change since 2000)
Vacant housing units - For sale only (%)
Vacant housing units - For sale only (% change since 2000)
Vacant housing units - Rented or sold, not occupied (%)
Vacant housing units - Rented or sold, not occupied (% change since 2000)
Vacant housing units - For seasonal, recreational, or occasional use (%)
Vacant housing units - For seasonal, recreational, or occasional use (% change since 2000)
Vacant housing units - For migrant workers (%)
Vacant housing units - For migrant workers (% change since 2000)
Vacant housing units - Other vacant (%)
Vacant housing units - Other vacant (% change since 2000)
Median monthly housing costs ($)
Median household income for houses/condos with a mortgage ($)
Median household income for houses/condos without a mortgage ($)
Median household income ($)
Median household income ($) - White
Median household income ($) - Black or African American
Median household income ($) - Asian
Median household income ($) - Hispanic or Latino
Median household income ($) - American Indian and Alaska Native
Median household income ($) - Multirace
Median household income ($) - Other Race
Mortgage status - with mortgage (%)
Mortgage status - with second mortgage (%)
Mortgage status - with home equity loan (%)
Mortgage status - with both second mortgage and home equity loan (%)
Mortgage status - without a mortgage (%)
Median year house/condo built
Median year apartment built
Household type by relationship - Male householder living alone (%)
Household type by relationship - Male householder not living alone (%)
Household type by relationship - Female householder living alone (%)
Household type by relationship - Female householder not living alone (%)
Household type by relationship - Opposite-Sex spouse (%)
Household type by relationship - Same-Sex spouse (%)
Household type by relationship - Opposite-Sex unmarried partner (%)
Household type by relationship - Same-Sex unmarried partner (%)
Household type by relationship - In group quarters (%)
Size of family households - 2-person household (%)
Size of family households - 3-person household (%)
Size of family households - 4-person household (%)
Size of family households - 5-person household (%)
Size of family households - 6-person household (%)
Size of family households - 7-or-more-person household (%)
Size of nonfamily households - 1-person household (%)
Size of nonfamily households - 2-person household (%)
Size of nonfamily households - 3-person household (%)
Size of nonfamily households - 4-person household (%)
Size of nonfamily households - 5-person household (%)
Size of nonfamily households - 6-person household (%)
Size of nonfamily households - 7-or-moreperson household (%)
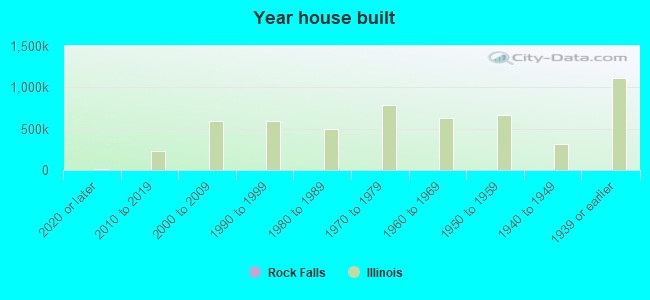
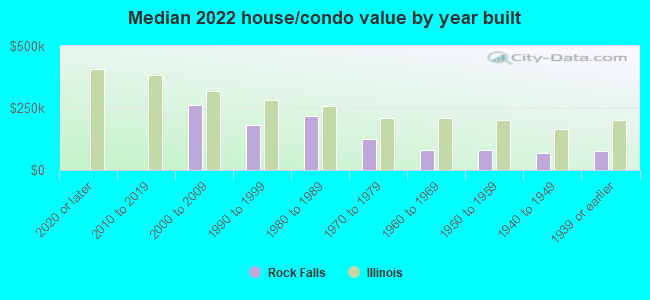
Year house built - Built 2010 or later (%)
Year house built - Built 2000 to 2009 (%)
Year house built - Built 1990 to 1999 (%)
Year house built - Built 1980 to 1989 (%)
Year house built - Built 1970 to 1979 (%)
Year house built - Built 1960 to 1969 (%)
Year house built - Built 1950 to 1959 (%)
Year house built - Built 1940 to 1949 (%)
Year house built - Built 1939 or earlier (%)
Median number of rooms in houses and condos
Median number of rooms in apartments
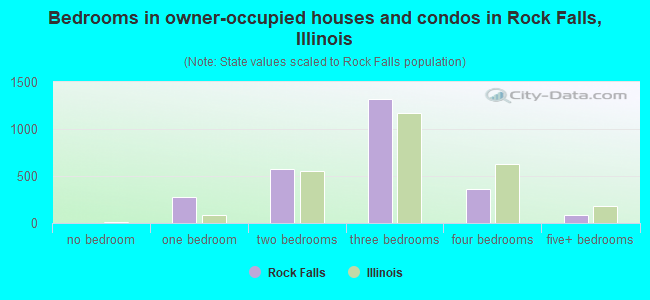
Median number of bedrooms in owner occupied houses
Mean number of bedrooms in owner occupied houses
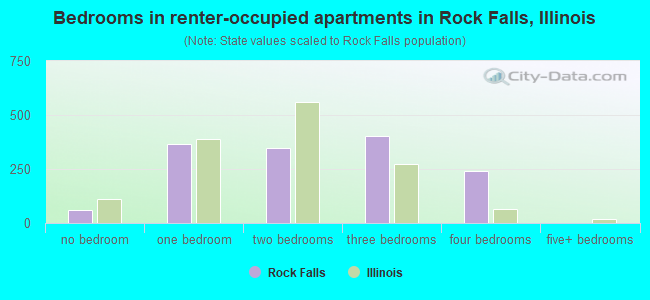
Median number of bedrooms in renter occupied houses
Mean number of bedrooms in renter occupied houses
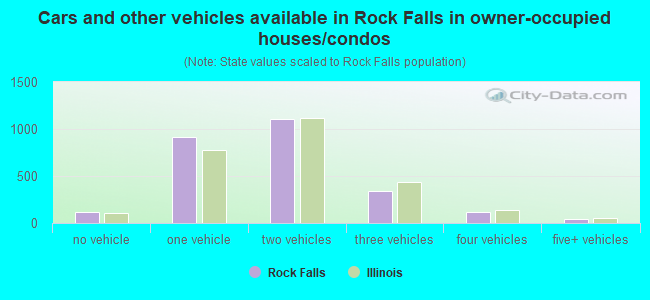
Median number of vehichles in owner occupied houses
Mean number of vehichles in owner occupied houses
Median number of vehichles in renter occupied houses
Mean number of vehichles in renter occupied houses
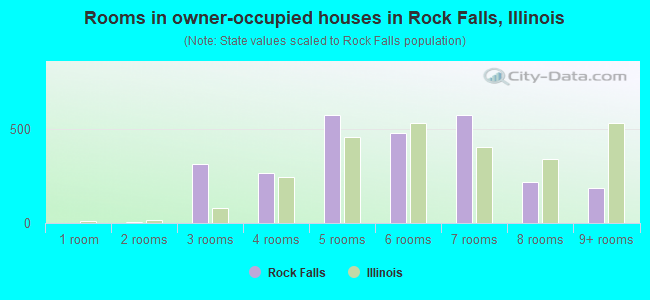
Rooms in owner-occupied houses - 1 room (%)
Rooms in owner-occupied houses - 2 rooms (%)
Rooms in owner-occupied houses - 3 rooms (%)
Rooms in owner-occupied houses - 4 rooms (%)
Rooms in owner-occupied houses - 5 rooms (%)
Rooms in owner-occupied houses - 6 rooms (%)
Rooms in owner-occupied houses - 7 rooms (%)
Rooms in owner-occupied houses - 8 rooms (%)
Rooms in owner-occupied houses - 9+ rooms (%)
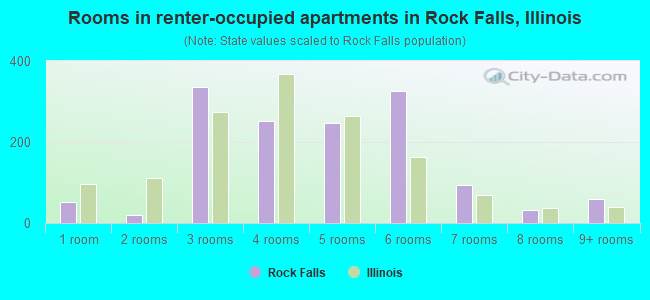
Rooms in renter-occupied houses - 1 room (%)
Rooms in renter-occupied houses - 2 rooms (%)
Rooms in renter-occupied houses - 3 rooms (%)
Rooms in renter-occupied houses - 4 rooms (%)
Rooms in renter-occupied houses - 5 rooms (%)
Rooms in renter-occupied houses - 6 rooms (%)
Rooms in renter-occupied houses - 7 rooms (%)
Rooms in renter-occupied houses - 8 rooms (%)
Rooms in renter-occupied houses - 9+ rooms (%)
Bedrooms in owner-occupied houses - no bedrooms (%)
Bedrooms in owner-occupied houses - 1 bedroom (%)
Bedrooms in owner-occupied houses - 2 bedrooms (%)
Bedrooms in owner-occupied houses - 3 bedrooms (%)
Bedrooms in owner-occupied houses - 4 bedrooms (%)
Bedrooms in owner-occupied houses - 5+ bedrooms (%)
Bedrooms in renter-occupied houses - no bedrooms (%)
Bedrooms in renter-occupied houses - 1 bedroom (%)
Bedrooms in renter-occupied houses - 2 bedrooms (%)
Bedrooms in renter-occupied houses - 3 bedrooms (%)
Bedrooms in renter-occupied houses - 4 bedrooms (%)
Bedrooms in renter-occupied houses - 5+ bedrooms (%)
Vehicles available in owner-occupied houses - no vehicle available (%)
Vehicles available in owner-occupied houses - 1 vehicle available(%)
Vehicles available in owner-occupied houses - 2 Vehicles available (%)
Vehicles available in owner-occupied houses - 3 Vehicles available (%)
Vehicles available in owner-occupied houses - 4 Vehicles available (%)
Vehicles available in owner-occupied houses - 5+ Vehicles available (%)
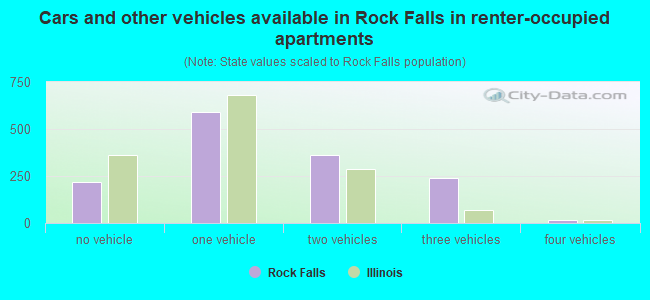
Vehicles available in renter-occupied houses - no vehicle available (%)
Vehicles available in renter-occupied houses - 1 vehicle available (%)
Vehicles available in renter-occupied houses - 2 Vehicles available (%)
Vehicles available in renter-occupied houses - 3 Vehicles available (%)
Vehicles available in renter-occupied houses - 4 Vehicles available (%)
Vehicles available in renter-occupied houses - 5+ Vehicles available (%)
Housing units in structures - 1, detached (%)
Housing units in structures - 1, attached (%)
Housing units in structures - 2 (%)
Housing units in structures - 3 or 4 (%)
Housing units in structures - 5 to 9 (%)
Housing units in structures - 10 to 19 (%)
Housing units in structures - 20 to 49 (%)
Housing units in structures - 50 or more (%)
Housing units in structures - Mobile home (%)
Housing units in structures - Boat, RV, van, etc. (%)
Housing units in structures - Owners - 1, detached (%)
Housing units in structures - Owners - 1, attached (%)
Housing units in structures - Owners - 2 (%)
Housing units in structures - Owners - 3 or 4 (%)
Housing units in structures - Owners - 5 to 9 (%)
Housing units in structures - Owners - 10 to 19 (%)
Housing units in structures - Owners - 20 to 49 (%)
Housing units in structures - Owners - 50 or more (%)
Housing units in structures - Owners - Mobile home (%)
Housing units in structures - Owners - Boat, RV, van, etc. (%)
Housing units in structures - Renters - 1, detached (%)
Housing units in structures - Renters - 1, attached (%)
Housing units in structures - Renters - 2 (%)
Housing units in structures - Renters - 3 or 4 (%)
Housing units in structures - Renters - 5 to 9 (%)
Housing units in structures - Renters - 10 to 19 (%)
Housing units in structures - Renters - 20 to 49 (%)
Housing units in structures - Renters - 50 or more (%)
Housing units in structures - Renters - Mobile home (%)
Housing units in structures - Renters - Boat, RV, van, etc. (%)
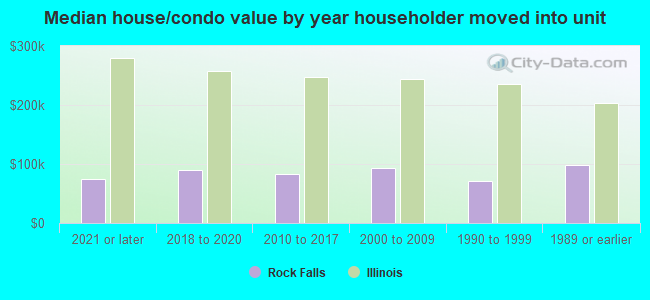
House/condo owner moved in on average (years ago)
Renter moved in on average (years ago)
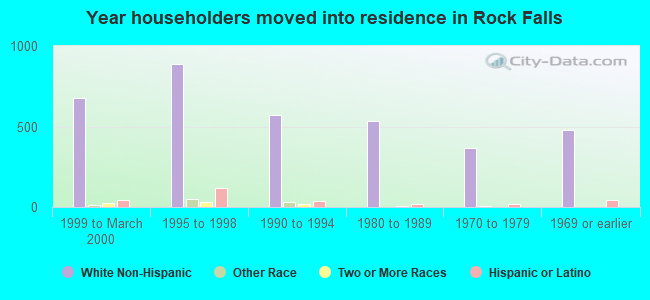
Year householder moved into unit - Moved in 1999 to March 2000 (%)
Year householder moved into unit - Moved in 1999 to March 2000 (%) - White
Year householder moved into unit - Moved in 1999 to March 2000 (%) - Black or African American
Year householder moved into unit - Moved in 1999 to March 2000 (%) - Asian
Year householder moved into unit - Moved in 1999 to March 2000 (%) - Hispanic or Latino
Year householder moved into unit - Moved in 1999 to March 2000 (%) - American Indian and Alaska Native
Year householder moved into unit - Moved in 1999 to March 2000 (%) - Multirace
Year householder moved into unit - Moved in 1999 to March 2000 (%) - Other Race
Year householder moved into unit - Moved in 1995 to 1998 (%)
Year householder moved into unit - Moved in 1995 to 1998 (%) - White
Year householder moved into unit - Moved in 1995 to 1998 (%) - Black or African American
Year householder moved into unit - Moved in 1995 to 1998 (%) - Asian
Year householder moved into unit - Moved in 1995 to 1998 (%) - Hispanic or Latino
Year householder moved into unit - Moved in 1995 to 1998 (%) - American Indian and Alaska Native
Year householder moved into unit - Moved in 1995 to 1998 (%) - Multirace
Year householder moved into unit - Moved in 1995 to 1998 (%) - Other Race
Year householder moved into unit - Moved in 1990 to 1994 (%)
Year householder moved into unit - Moved in 1990 to 1994 (%) - White
Year householder moved into unit - Moved in 1990 to 1994 (%) - Black or African American
Year householder moved into unit - Moved in 1990 to 1994 (%) - Asian
Year householder moved into unit - Moved in 1990 to 1994 (%) - Hispanic or Latino
Year householder moved into unit - Moved in 1990 to 1994 (%) - American Indian and Alaska Native
Year householder moved into unit - Moved in 1990 to 1994 (%) - Multirace
Year householder moved into unit - Moved in 1990 to 1994 (%) - Other Race
Year householder moved into unit - Moved in 1980 to 1989 (%)
Year householder moved into unit - Moved in 1980 to 1989 (%) - White
Year householder moved into unit - Moved in 1980 to 1989 (%) - Black or African American
Year householder moved into unit - Moved in 1980 to 1989 (%) - Asian
Year householder moved into unit - Moved in 1980 to 1989 (%) - Hispanic or Latino
Year householder moved into unit - Moved in 1980 to 1989 (%) - American Indian and Alaska Native
Year householder moved into unit - Moved in 1980 to 1989 (%) - Multirace
Year householder moved into unit - Moved in 1980 to 1989 (%) - Other Race
Year householder moved into unit - Moved in 1970 to 1979 (%)
Year householder moved into unit - Moved in 1970 to 1979 (%) - White
Year householder moved into unit - Moved in 1970 to 1979 (%) - Black or African American
Year householder moved into unit - Moved in 1970 to 1979 (%) - Asian
Year householder moved into unit - Moved in 1970 to 1979 (%) - Hispanic or Latino
Year householder moved into unit - Moved in 1970 to 1979 (%) - American Indian and Alaska Native
Year householder moved into unit - Moved in 1970 to 1979 (%) - Multirace
Year householder moved into unit - Moved in 1970 to 1979 (%) - Other Race
Year householder moved into unit - Moved in 1969 or earlier (%)
Year householder moved into unit - Moved in 1969 or earlier (%) - White
Year householder moved into unit - Moved in 1969 or earlier (%) - Black or African American
Year householder moved into unit - Moved in 1969 or earlier (%) - Asian
Year householder moved into unit - Moved in 1969 or earlier (%) - Hispanic or Latino
Year householder moved into unit - Moved in 1969 or earlier (%) - American Indian and Alaska Native
Year householder moved into unit - Moved in 1969 or earlier (%) - Multirace
Year householder moved into unit - Moved in 1969 or earlier (%) - Other Race
Housing units lacking complete plumbing facilities (%)
Housing units lacking complete kitchen facilities (%)
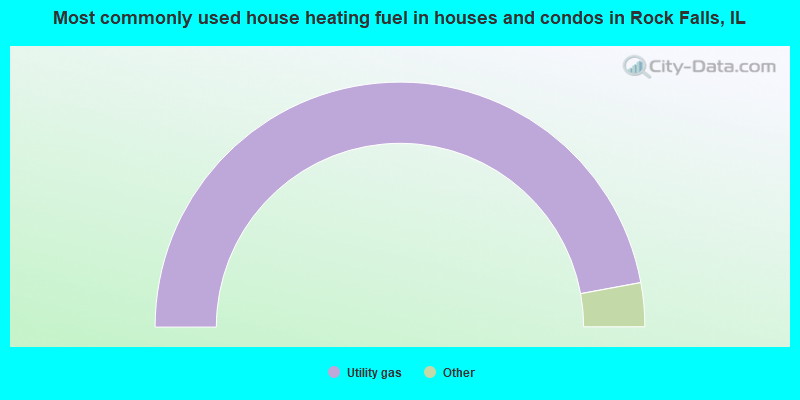
House heating fuel used in houses and condos - Utility gas (%)
House heating fuel used in houses and condos - Bottled, tank, or LP gas (%)
House heating fuel used in houses and condos - Electricity (%)
House heating fuel used in houses and condos - Fuel oil, kerosene, etc. (%)
House heating fuel used in houses and condos - Coal or coke (%)
House heating fuel used in houses and condos - Wood (%)
House heating fuel used in houses and condos - Solar energy (%)
House heating fuel used in houses and condos - Other fuel (%)
House heating fuel used in houses and condos - No fuel used (%)
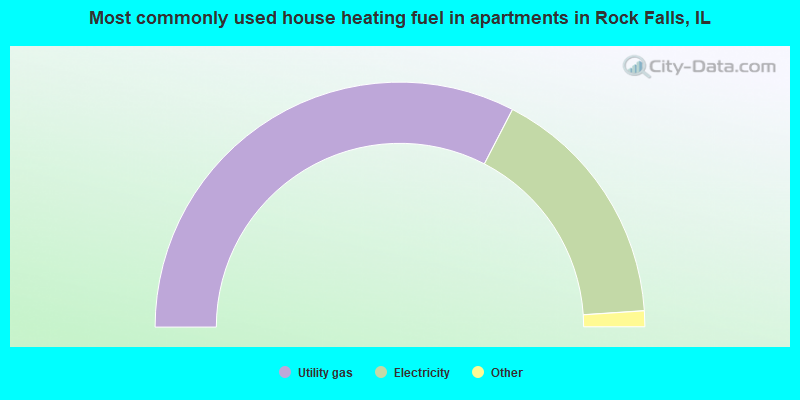
House heating fuel used in apartments - Utility gas (%)
House heating fuel used in apartments - Bottled, tank, or LP gas (%)
House heating fuel used in apartments - Electricity (%)
House heating fuel used in apartments - Fuel oil, kerosene, etc. (%)
House heating fuel used in apartments - Coal or coke (%)
House heating fuel used in apartments - Wood (%)
House heating fuel used in apartments - Solar energy (%)
House heating fuel used in apartments - Other fuel (%)
House heating fuel used in apartments - No fuel used (%)
Median year house/condo built: 1956Median year apartment built: 1966Household type by relationship:
Households: 8,781
Male householders: 1,937 (851 living alone ), Female householders: 1,976 (736 living alone )1,176 spouses (1,165 opposite-sex spouses ), 448 unmarried partners , (448 opposite-sex unmarried partners ), 2,482 children (2,362 natural , 6 adopted , 113 stepchildren ), 164 grandchildren , 58 brothers or sisters , 113 parents , 0 foster children , 29 other relatives , 280 non-relatives In group quarters: 113
Size of family households: 830 2-persons , 446 3-persons , 413 4-persons , 368 5-persons , 19 6-persons .
Size of nonfamily households: 1,672 1-person , 216 2-persons , 64 3-persons , 4 4-persons .
819 married couples with children. single-parent households (215 men , 765 women ).
88.0% of residents of Rock Falls speak English at home. of residents speak Spanish at home (87% speak English very well , 8% speak English well , 5% speak English not well ).of residents speak other Indo-European language at home (100% speak English very well ).of residents speak other language at home (41% speak English very well , 36% speak English well , 23% speak English not well ).
Foreign born population: 327 (3.7%)of them are naturalized citizens )
Median number of rooms in houses and condos:
Median number of rooms in apartments
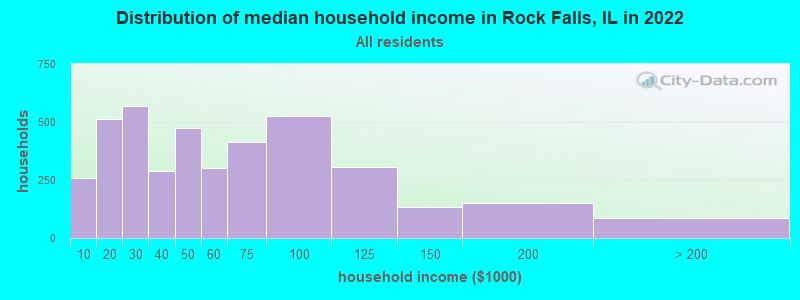
Rock Falls, IL household income distribution 260 Less than $10,000511 $10,000 to $19,999567 $20,000 to $29,999288 $30,000 to $39,999476 $40,000 to $49,999300 $50,000 to $59,999412 $60,000 to $74,999525 $75,000 to $99,999304 $100,000 to $124,999135 $125,000 to $149,999151 $150,000 to $199,99986 $200,000 or more
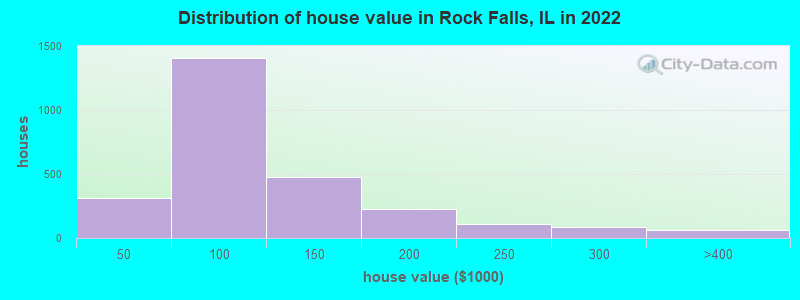
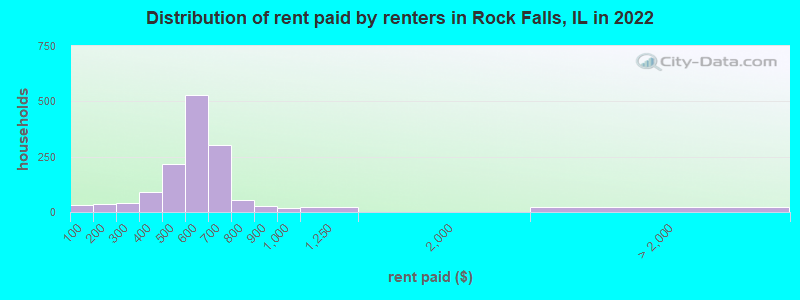
Home value of owner - occupied houses in 2022 in Rock Falls, IL 57 Less than $10,00020 $10,000 to $14,99910 $20,000 to $24,9999 $25,000 to $29,99995 $30,000 to $34,99926 $35,000 to $39,99989 $40,000 to $49,999143 $50,000 to $59,999443 $60,000 to $69,999385 $70,000 to $79,999222 $80,000 to $89,999119 $90,000 to $99,999318 $100,000 to $124,999156 $125,000 to $149,999168 $150,000 to $174,99961 $175,000 to $199,999108 $200,000 to $249,99985 $250,000 to $299,99946 $300,000 to $399,99920 $400,000 to $499,999Rent paid by renters in 2022 in Rock Falls, IL 32 Less than $10024 $100 to $1499 $150 to $19919 $200 to $24922 $250 to $29928 $300 to $34961 $350 to $399168 $400 to $44949 $450 to $499274 $500 to $549256 $550 to $599208 $600 to $64995 $650 to $6999 $700 to $74944 $750 to $79924 $800 to $89918 $900 to $99921 $1,000 to $1,24923 No cash rent
Percentage of workers working in this county: 69.9%Number of people working at home: 224 (5.4% of all workers )
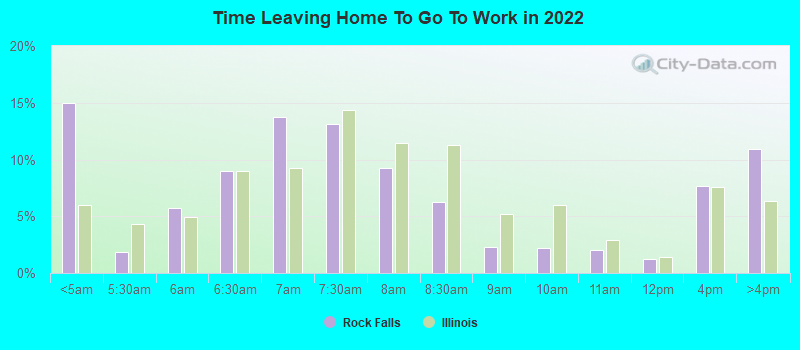
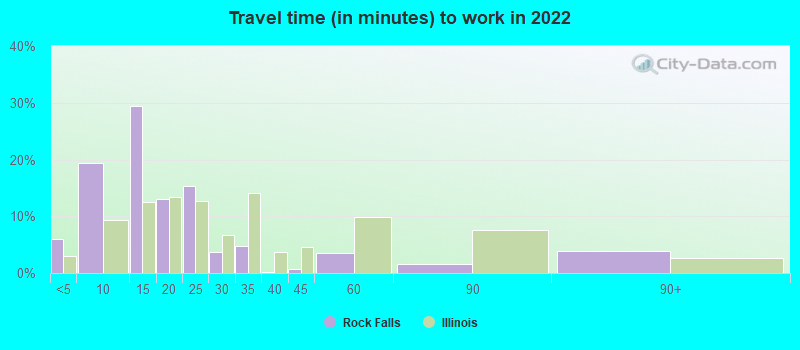
Travel time to work (commute)
Less than 5 minutes: 1895 to 9 minutes: 56310 to 14 minutes: 1,35415 to 19 minutes: 46720 to 24 minutes: 66825 to 29 minutes: 11330 to 34 minutes: 13635 to 39 minutes: 11640 to 44 minutes: 845 to 59 minutes: 17660 to 89 minutes: 3390 or more minutes: 27
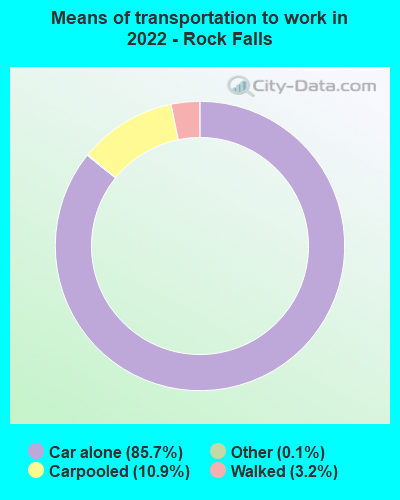
Means of transportation to work:
Drove a car alone: 2,258 (77.6%)Carpooled: 307 (10.6%)Bus : 1 (0.0%)Taxi: 4 (0.1%)Walked: 85 (2.9%)Worked at home: 224 (7.7%)
Unemployment by race in 2022
Unemployment rate for White non-Hispanic residents 2.5% Males3.4% FemalesUnemployment rate for Black residents 100.0% FemalesUnemployment rate for other race residents 13.6% MalesUnemployment rate for two or more race residents 6.1% Males4.4% FemalesUnemployment rate for Hispanic or Latino residents 8.0% Males1.7% Females
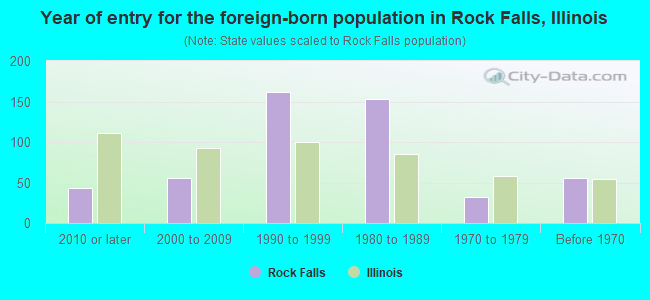
Year of entry for the foreign-born population in Rock Falls, Illinois
43 2010 or later 55 2000 to 2009 162 1990 to 1999 153 1980 to 1989 32 1970 to 1979 55 Before 1970
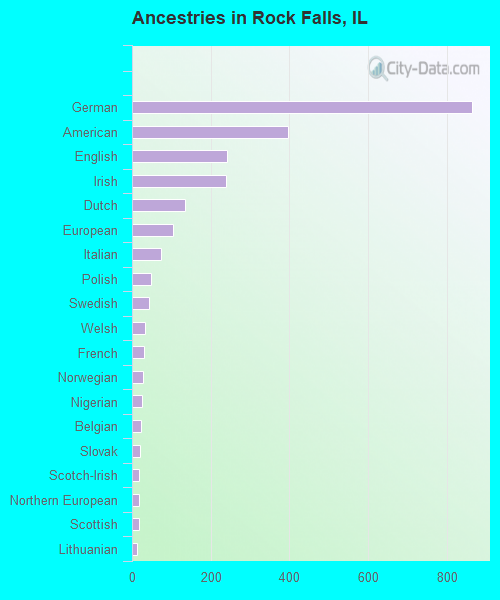
First ancestries reported:
German: 864 (24.1%)
American: 396 (11.1%)
English: 241 (6.7%)
Irish: 239 (6.7%)
Dutch: 135 (3.8%)
European: 104 (2.9%)
Italian: 74 (2.1%)
Polish: 48 (1.3%)
Swedish: 44 (1.2%)
Welsh: 32 (0.9%)
French: 30 (0.8%)
Norwegian: 28 (0.8%)
Nigerian: 26 (0.7%)
Belgian: 24 (0.7%)
Slovak: 21 (0.6%)
Scotch-Irish: 18 (0.5%)
Northern European: 17 (0.5%)
Scottish: 17 (0.5%)
Lithuanian: 13 (0.4%)
Pennsylvania German: 7 (0.2%)
British: 6 (0.2%)
Romanian: 4 (0.1%)
African: 1 (0.03%) Most common places of birth for foreign-born residents (%): Mexico Rock Falls:
87.5% (286)Illinois:
34.7% (626,958)
Nigeria Rock Falls:
8.0% (26)Illinois:
1.2% (21,186)
Canada Rock Falls:
3.1% (10)Illinois:
1.1% (19,306)
Place of birth for U.S.-born residents:
This state: 7,315Other state: 1,062Northeast: 68Midwest: 575South: 296West: 120 88.9% of Rock Falls residents lived in the same house 1 years ago.
Out of people who lived in different houses, 37.9% lived in this county.
Out of people who lived in different counties, 87.4% lived in Illinois.
Rock Falls:
88.9%State average:
88.3%
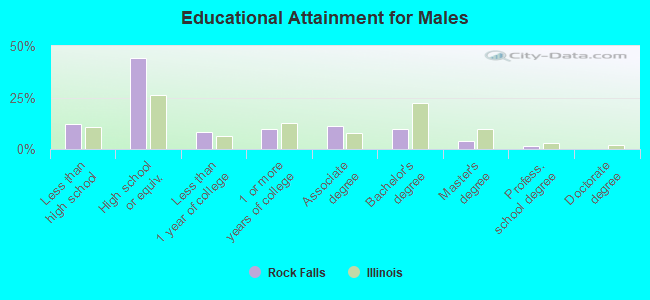
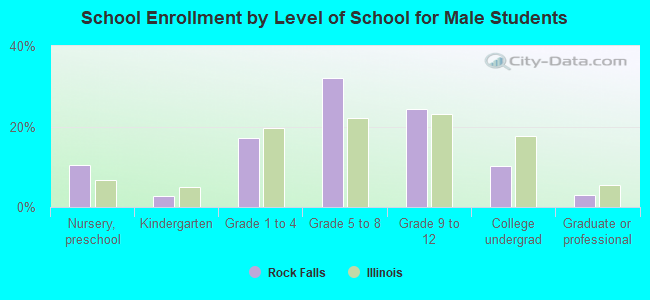
Education attainment for males 25 years and older:
No schooling: 30Nursery to 4th grade: 155th and 6th grade: 667th and 8th grade: 229th grade: 5710th grade: 2211th grade: 4812th grade, no diploma: 86High school graduate (or equivalency): 1,252Less than 1 year of college: 238Some college more than 1 year, no degree: 269Associate degree: 311Bachelor's degree: 269Master's degree: 109Professional school degree: 43Doctorate degree: 0
Education attainment for females 25 years and older:
No schooling: 27Nursery to 4th grade: 435th and 6th grade: 167th and 8th grade: 299th grade: 9710th grade: 9511th grade: 1412th grade, no diploma: 85High school graduate (or equivalency): 1,045Less than 1 year of college: 314Some college more than 1 year, no degree: 421Associate degree: 385Bachelor's degree: 304Master's degree: 146Professional school degree: 0Doctorate degree: 0
Housing units in structures:
One, detached: 3,482One, attached: 40Two: 963 or 4: 3425 to 9: 15610 to 19: 6220 to 49: 6150 or more: 135Mobile homes: 75Housing units lacking complete plumbing facilities in 2022: 1.6%Housing units lacking complete kitchen facilities in 2022: 2.1%House/condo owner moved in on average 12 years ago
Renter moved in on average 3 years ago
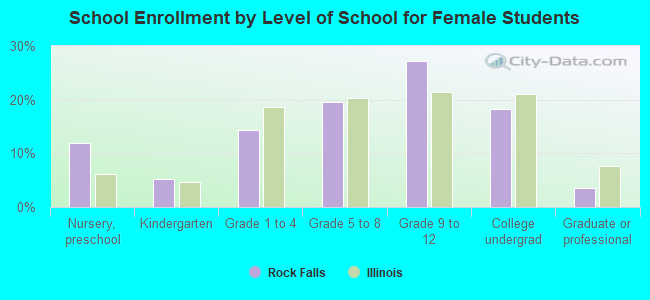
Private vs. public school enrollment:
Students in private schools in grades 1 to 8 (elementary and middle school): 18 Students in private schools in grades 9 to 12 (high school): 0 Students in private undergraduate colleges: 14