Rock Hill, SC (South Carolina) Houses and Residents
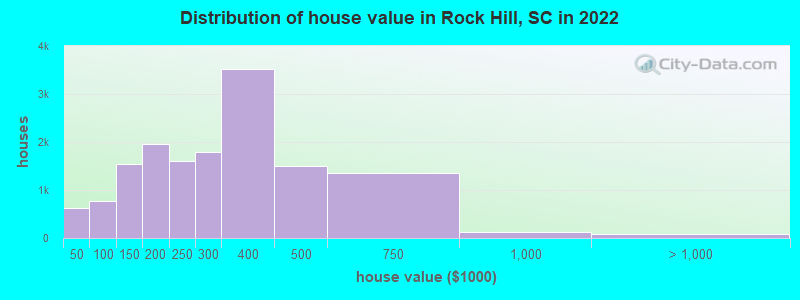
Estimated median house or condo value in 2022: $291,600 (it was $90,100 in 2000 )
Rock Hill:
$291,600South Carolina:
$254,600
Lower value quartile - upper value quartile: $184,500 - $376,700Mean price in 2022: Detached houses: $261,162 Here:
$261,162State:
$368,255
Townhouses or other attached units: $202,420 Here:
$202,420State:
$292,023
In 2-unit structures: $151,654 Here:
$151,654State:
$358,283
In 3-to-4-unit structures: $155,497 Here:
$155,497State:
$230,702
In 5-or-more-unit structures: $143,523 Here:
$143,523State:
$326,361
Mobile homes: $92,626 Here:
$92,626State:
$102,531
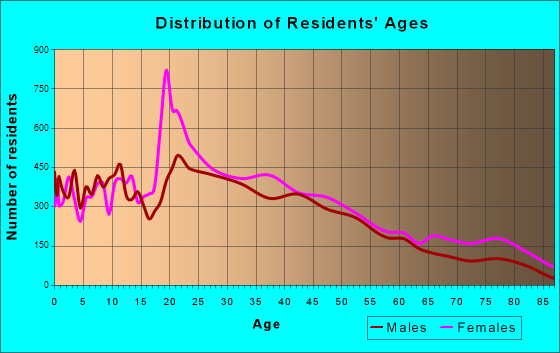
Total population: 69,967 (Urban population: 49,813, Rural population: 396 (16 farm, 380 nonfarm ))
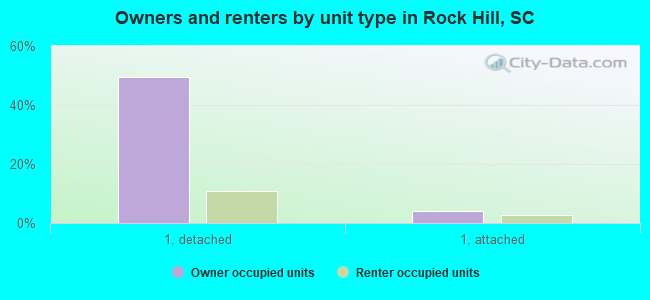
Houses: 35,186 (32,770 occupied: 18,554 owner occupied, 14,216 renter occupied )
% of renters here:
43%State:
28%
Housing density: 1,134 houses/condos per square mile
Median price asked for vacant for-sale houses and condos in 2022: $419,303.
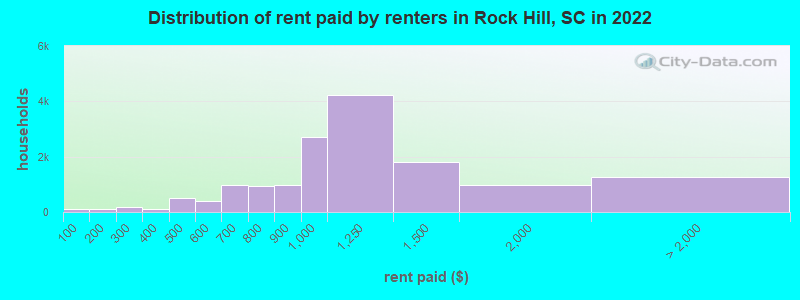
Median contract rent in 2022: $1,017 (lower quartile is $855, upper quartile is $1,210)
Median rent asked for vacant for-rent units in 2022: $961
Median gross rent in Rock Hill, SC in 2022: $1,222
Housing units in Rock Hill with a mortgage: 13,325 (1,974 second mortgage, 0 home equity loan, 1,914 both second mortgage and home equity loan )Houses without a mortgage: 405
Median household income for houses/condos with a mortgage: $88,991
Median household income for apartments without a mortgage: $63,521
Median monthly housing costs: $1,193
Data:
Median house or condo value ($)
Median house or condo value ($ change since 2000)
Median house or condo value ($) - White
Median house or condo value ($) - Black or African American
Median house or condo value ($) - Asian
Median house or condo value ($) - Hispanic or Latino
Median house or condo value ($) - American Indian and Alaska Native
Median house or condo value ($) - Multirace
Median house or condo value ($) - Other Race
Median price asked for mobile homes ($)
Household density (households per square mile)
Mean house or condo value by units in structure - 1, detached ($)
Mean house or condo value by units in structure - 1, attached ($)
Mean house or condo value by units in structure - 2 ($)
Mean house or condo value by units in structure by units in structure - 3 or 4 ($)
Mean house or condo value by units in structure - 5 or more ($)
Mean house or condo value by units in structure - Boat, RV, van, etc. ($)
Mean house or condo value by units in structure - Mobile home ($)
Median contract rent ($)
Median contract rent - Lower quartile ($)
Median contract rent - Upper quartile ($)
Median gross rent ($)
Urban houses (%)
Rural houses (%)
Houses occupied (%)
Houses occupied (% change since 2000)
Houses owner occupied (%)
Houses owner occupied (% change since 2000)
Houses renter occupied (%)
Houses renter occupied (% change since 2000)
Vacant housing units - For rent (%)
Vacant housing units - For rent (% change since 2000)
Vacant housing units - For sale only (%)
Vacant housing units - For sale only (% change since 2000)
Vacant housing units - Rented or sold, not occupied (%)
Vacant housing units - Rented or sold, not occupied (% change since 2000)
Vacant housing units - For seasonal, recreational, or occasional use (%)
Vacant housing units - For seasonal, recreational, or occasional use (% change since 2000)
Vacant housing units - For migrant workers (%)
Vacant housing units - For migrant workers (% change since 2000)
Vacant housing units - Other vacant (%)
Vacant housing units - Other vacant (% change since 2000)
Median monthly housing costs ($)
Median household income for houses/condos with a mortgage ($)
Median household income for houses/condos without a mortgage ($)
Median household income ($)
Median household income ($) - White
Median household income ($) - Black or African American
Median household income ($) - Asian
Median household income ($) - Hispanic or Latino
Median household income ($) - American Indian and Alaska Native
Median household income ($) - Multirace
Median household income ($) - Other Race
Mortgage status - with mortgage (%)
Mortgage status - with second mortgage (%)
Mortgage status - with home equity loan (%)
Mortgage status - with both second mortgage and home equity loan (%)
Mortgage status - without a mortgage (%)
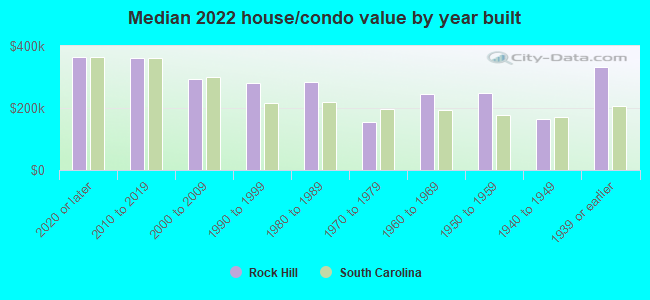
Median year house/condo built
Median year apartment built
Household type by relationship - Male householder living alone (%)
Household type by relationship - Male householder not living alone (%)
Household type by relationship - Female householder living alone (%)
Household type by relationship - Female householder not living alone (%)
Household type by relationship - Opposite-Sex spouse (%)
Household type by relationship - Same-Sex spouse (%)
Household type by relationship - Opposite-Sex unmarried partner (%)
Household type by relationship - Same-Sex unmarried partner (%)
Household type by relationship - In group quarters (%)
Size of family households - 2-person household (%)
Size of family households - 3-person household (%)
Size of family households - 4-person household (%)
Size of family households - 5-person household (%)
Size of family households - 6-person household (%)
Size of family households - 7-or-more-person household (%)
Size of nonfamily households - 1-person household (%)
Size of nonfamily households - 2-person household (%)
Size of nonfamily households - 3-person household (%)
Size of nonfamily households - 4-person household (%)
Size of nonfamily households - 5-person household (%)
Size of nonfamily households - 6-person household (%)
Size of nonfamily households - 7-or-moreperson household (%)
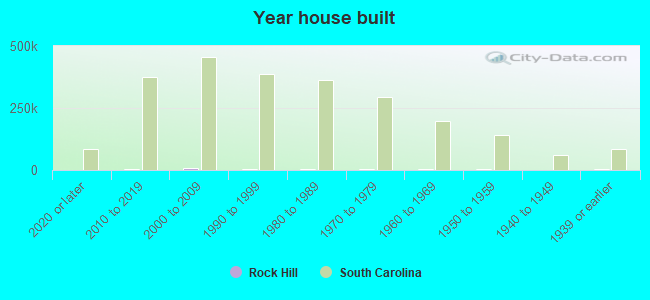
Year house built - Built 2010 or later (%)
Year house built - Built 2000 to 2009 (%)
Year house built - Built 1990 to 1999 (%)
Year house built - Built 1980 to 1989 (%)
Year house built - Built 1970 to 1979 (%)
Year house built - Built 1960 to 1969 (%)
Year house built - Built 1950 to 1959 (%)
Year house built - Built 1940 to 1949 (%)
Year house built - Built 1939 or earlier (%)
Median number of rooms in houses and condos
Median number of rooms in apartments
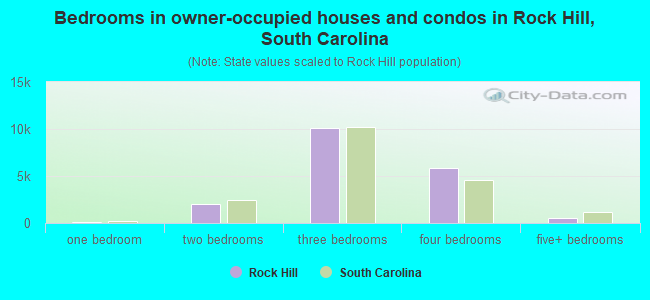
Median number of bedrooms in owner occupied houses
Mean number of bedrooms in owner occupied houses
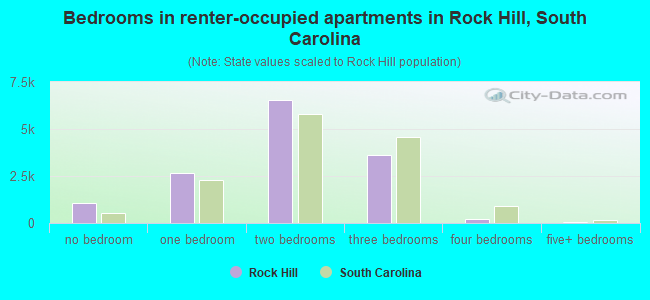
Median number of bedrooms in renter occupied houses
Mean number of bedrooms in renter occupied houses
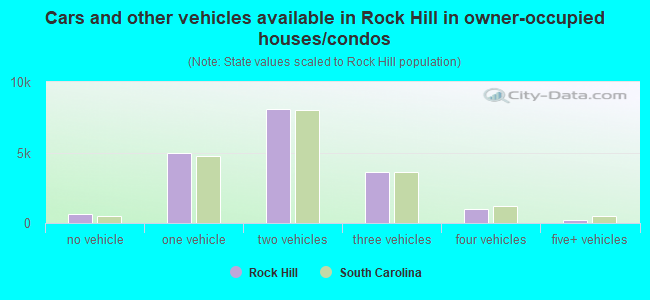
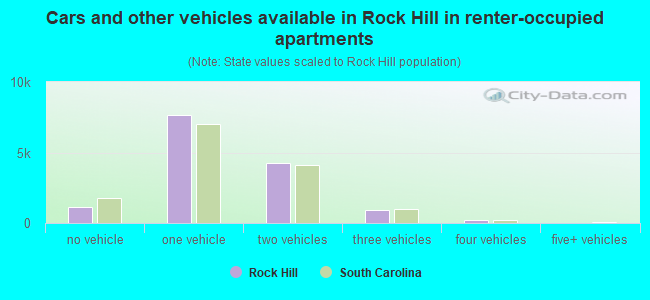
Median number of vehichles in owner occupied houses
Mean number of vehichles in owner occupied houses
Median number of vehichles in renter occupied houses
Mean number of vehichles in renter occupied houses
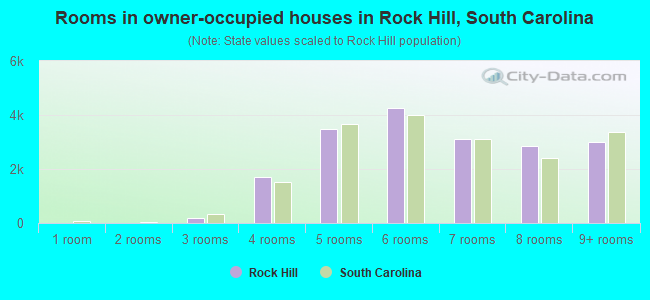
Rooms in owner-occupied houses - 1 room (%)
Rooms in owner-occupied houses - 2 rooms (%)
Rooms in owner-occupied houses - 3 rooms (%)
Rooms in owner-occupied houses - 4 rooms (%)
Rooms in owner-occupied houses - 5 rooms (%)
Rooms in owner-occupied houses - 6 rooms (%)
Rooms in owner-occupied houses - 7 rooms (%)
Rooms in owner-occupied houses - 8 rooms (%)
Rooms in owner-occupied houses - 9+ rooms (%)
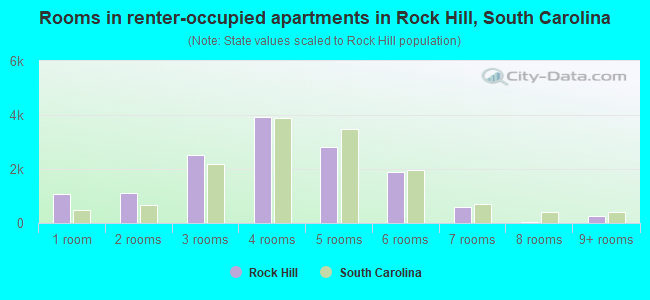
Rooms in renter-occupied houses - 1 room (%)
Rooms in renter-occupied houses - 2 rooms (%)
Rooms in renter-occupied houses - 3 rooms (%)
Rooms in renter-occupied houses - 4 rooms (%)
Rooms in renter-occupied houses - 5 rooms (%)
Rooms in renter-occupied houses - 6 rooms (%)
Rooms in renter-occupied houses - 7 rooms (%)
Rooms in renter-occupied houses - 8 rooms (%)
Rooms in renter-occupied houses - 9+ rooms (%)
Bedrooms in owner-occupied houses - no bedrooms (%)
Bedrooms in owner-occupied houses - 1 bedroom (%)
Bedrooms in owner-occupied houses - 2 bedrooms (%)
Bedrooms in owner-occupied houses - 3 bedrooms (%)
Bedrooms in owner-occupied houses - 4 bedrooms (%)
Bedrooms in owner-occupied houses - 5+ bedrooms (%)
Bedrooms in renter-occupied houses - no bedrooms (%)
Bedrooms in renter-occupied houses - 1 bedroom (%)
Bedrooms in renter-occupied houses - 2 bedrooms (%)
Bedrooms in renter-occupied houses - 3 bedrooms (%)
Bedrooms in renter-occupied houses - 4 bedrooms (%)
Bedrooms in renter-occupied houses - 5+ bedrooms (%)
Vehicles available in owner-occupied houses - no vehicle available (%)
Vehicles available in owner-occupied houses - 1 vehicle available(%)
Vehicles available in owner-occupied houses - 2 Vehicles available (%)
Vehicles available in owner-occupied houses - 3 Vehicles available (%)
Vehicles available in owner-occupied houses - 4 Vehicles available (%)
Vehicles available in owner-occupied houses - 5+ Vehicles available (%)
Vehicles available in renter-occupied houses - no vehicle available (%)
Vehicles available in renter-occupied houses - 1 vehicle available (%)
Vehicles available in renter-occupied houses - 2 Vehicles available (%)
Vehicles available in renter-occupied houses - 3 Vehicles available (%)
Vehicles available in renter-occupied houses - 4 Vehicles available (%)
Vehicles available in renter-occupied houses - 5+ Vehicles available (%)
Housing units in structures - 1, detached (%)
Housing units in structures - 1, attached (%)
Housing units in structures - 2 (%)
Housing units in structures - 3 or 4 (%)
Housing units in structures - 5 to 9 (%)
Housing units in structures - 10 to 19 (%)
Housing units in structures - 20 to 49 (%)
Housing units in structures - 50 or more (%)
Housing units in structures - Mobile home (%)
Housing units in structures - Boat, RV, van, etc. (%)
Housing units in structures - Owners - 1, detached (%)
Housing units in structures - Owners - 1, attached (%)
Housing units in structures - Owners - 2 (%)
Housing units in structures - Owners - 3 or 4 (%)
Housing units in structures - Owners - 5 to 9 (%)
Housing units in structures - Owners - 10 to 19 (%)
Housing units in structures - Owners - 20 to 49 (%)
Housing units in structures - Owners - 50 or more (%)
Housing units in structures - Owners - Mobile home (%)
Housing units in structures - Owners - Boat, RV, van, etc. (%)
Housing units in structures - Renters - 1, detached (%)
Housing units in structures - Renters - 1, attached (%)
Housing units in structures - Renters - 2 (%)
Housing units in structures - Renters - 3 or 4 (%)
Housing units in structures - Renters - 5 to 9 (%)
Housing units in structures - Renters - 10 to 19 (%)
Housing units in structures - Renters - 20 to 49 (%)
Housing units in structures - Renters - 50 or more (%)
Housing units in structures - Renters - Mobile home (%)
Housing units in structures - Renters - Boat, RV, van, etc. (%)
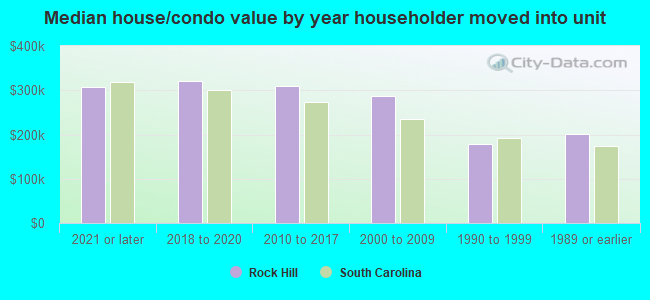
House/condo owner moved in on average (years ago)
Renter moved in on average (years ago)
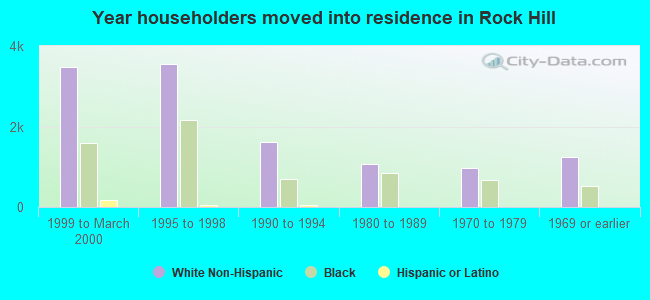
Year householder moved into unit - Moved in 1999 to March 2000 (%)
Year householder moved into unit - Moved in 1999 to March 2000 (%) - White
Year householder moved into unit - Moved in 1999 to March 2000 (%) - Black or African American
Year householder moved into unit - Moved in 1999 to March 2000 (%) - Asian
Year householder moved into unit - Moved in 1999 to March 2000 (%) - Hispanic or Latino
Year householder moved into unit - Moved in 1999 to March 2000 (%) - American Indian and Alaska Native
Year householder moved into unit - Moved in 1999 to March 2000 (%) - Multirace
Year householder moved into unit - Moved in 1999 to March 2000 (%) - Other Race
Year householder moved into unit - Moved in 1995 to 1998 (%)
Year householder moved into unit - Moved in 1995 to 1998 (%) - White
Year householder moved into unit - Moved in 1995 to 1998 (%) - Black or African American
Year householder moved into unit - Moved in 1995 to 1998 (%) - Asian
Year householder moved into unit - Moved in 1995 to 1998 (%) - Hispanic or Latino
Year householder moved into unit - Moved in 1995 to 1998 (%) - American Indian and Alaska Native
Year householder moved into unit - Moved in 1995 to 1998 (%) - Multirace
Year householder moved into unit - Moved in 1995 to 1998 (%) - Other Race
Year householder moved into unit - Moved in 1990 to 1994 (%)
Year householder moved into unit - Moved in 1990 to 1994 (%) - White
Year householder moved into unit - Moved in 1990 to 1994 (%) - Black or African American
Year householder moved into unit - Moved in 1990 to 1994 (%) - Asian
Year householder moved into unit - Moved in 1990 to 1994 (%) - Hispanic or Latino
Year householder moved into unit - Moved in 1990 to 1994 (%) - American Indian and Alaska Native
Year householder moved into unit - Moved in 1990 to 1994 (%) - Multirace
Year householder moved into unit - Moved in 1990 to 1994 (%) - Other Race
Year householder moved into unit - Moved in 1980 to 1989 (%)
Year householder moved into unit - Moved in 1980 to 1989 (%) - White
Year householder moved into unit - Moved in 1980 to 1989 (%) - Black or African American
Year householder moved into unit - Moved in 1980 to 1989 (%) - Asian
Year householder moved into unit - Moved in 1980 to 1989 (%) - Hispanic or Latino
Year householder moved into unit - Moved in 1980 to 1989 (%) - American Indian and Alaska Native
Year householder moved into unit - Moved in 1980 to 1989 (%) - Multirace
Year householder moved into unit - Moved in 1980 to 1989 (%) - Other Race
Year householder moved into unit - Moved in 1970 to 1979 (%)
Year householder moved into unit - Moved in 1970 to 1979 (%) - White
Year householder moved into unit - Moved in 1970 to 1979 (%) - Black or African American
Year householder moved into unit - Moved in 1970 to 1979 (%) - Asian
Year householder moved into unit - Moved in 1970 to 1979 (%) - Hispanic or Latino
Year householder moved into unit - Moved in 1970 to 1979 (%) - American Indian and Alaska Native
Year householder moved into unit - Moved in 1970 to 1979 (%) - Multirace
Year householder moved into unit - Moved in 1970 to 1979 (%) - Other Race
Year householder moved into unit - Moved in 1969 or earlier (%)
Year householder moved into unit - Moved in 1969 or earlier (%) - White
Year householder moved into unit - Moved in 1969 or earlier (%) - Black or African American
Year householder moved into unit - Moved in 1969 or earlier (%) - Asian
Year householder moved into unit - Moved in 1969 or earlier (%) - Hispanic or Latino
Year householder moved into unit - Moved in 1969 or earlier (%) - American Indian and Alaska Native
Year householder moved into unit - Moved in 1969 or earlier (%) - Multirace
Year householder moved into unit - Moved in 1969 or earlier (%) - Other Race
Housing units lacking complete plumbing facilities (%)
Housing units lacking complete kitchen facilities (%)
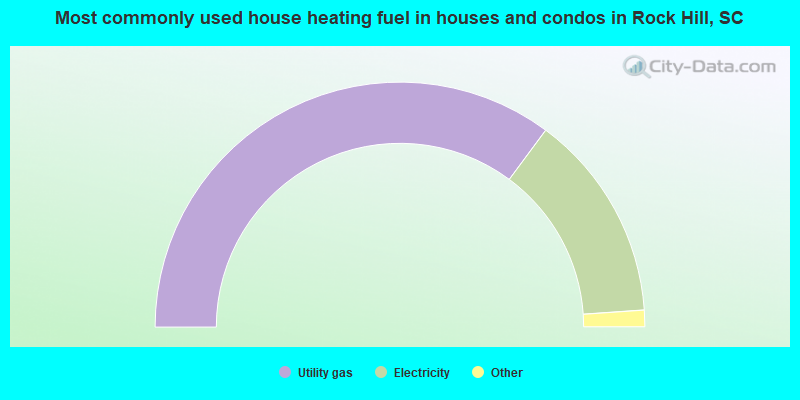
House heating fuel used in houses and condos - Utility gas (%)
House heating fuel used in houses and condos - Bottled, tank, or LP gas (%)
House heating fuel used in houses and condos - Electricity (%)
House heating fuel used in houses and condos - Fuel oil, kerosene, etc. (%)
House heating fuel used in houses and condos - Coal or coke (%)
House heating fuel used in houses and condos - Wood (%)
House heating fuel used in houses and condos - Solar energy (%)
House heating fuel used in houses and condos - Other fuel (%)
House heating fuel used in houses and condos - No fuel used (%)
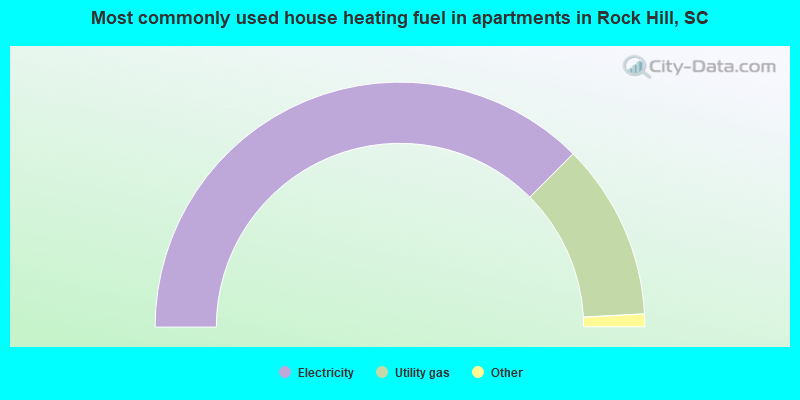
House heating fuel used in apartments - Utility gas (%)
House heating fuel used in apartments - Bottled, tank, or LP gas (%)
House heating fuel used in apartments - Electricity (%)
House heating fuel used in apartments - Fuel oil, kerosene, etc. (%)
House heating fuel used in apartments - Coal or coke (%)
House heating fuel used in apartments - Wood (%)
House heating fuel used in apartments - Solar energy (%)
House heating fuel used in apartments - Other fuel (%)
House heating fuel used in apartments - No fuel used (%)
Median year house/condo built: 1999Median year apartment built: 1991Household type by relationship:
Households: 75,361
Male householders: 13,238 (4,532 living alone ), Female householders: 19,532 (7,970 living alone )13,084 spouses (12,658 opposite-sex spouses ), 2,204 unmarried partners , (1,903 opposite-sex unmarried partners ), 19,016 children (17,345 natural , 453 adopted , 1,218 stepchildren ), 1,065 grandchildren , 1,041 brothers or sisters , 671 parents , 0 foster children , 689 other relatives , 1,846 non-relatives In group quarters: 2,975
Size of family households: 9,352 2-persons , 3,880 3-persons , 3,271 4-persons , 878 5-persons , 484 6-persons , 215 7-or-more-persons .
Size of nonfamily households: 12,502 1-person , 2,032 2-persons , 156 3-persons .
9,122 married couples with children. single-parent households (678 men , 3,843 women ).
93.1% of residents of Rock Hill speak English at home. of residents speak Spanish at home (73% speak English very well , 16% speak English well , 8% speak English not well , 3% don't speak English at all ).of residents speak other Indo-European language at home (91% speak English very well , 5% speak English well , 3% speak English not well ).of residents speak Asian or Pacific Island language at home (71% speak English very well , 5% speak English well , 24% speak English not well ).of residents speak other language at home (100% speak English very well ).
Foreign born population: 3,088 (4.1%)of them are naturalized citizens )
Median number of rooms in houses and condos:
Median number of rooms in apartments
Owner-occupied Renter-occupied
Rooms in owner-occupied houses in Rock Hill, South Carolina
0 1 room 0 2 rooms 168 3 rooms 1,709 4 rooms 3,481 5 rooms 4,257 6 rooms 3,113 7 rooms 2,838 8 rooms 2,988 9+ rooms
Rooms in renter-occupied apartments in Rock Hill, South Carolina
1,071 1 room 1,116 2 rooms 2,512 3 rooms 3,915 4 rooms 2,800 5 rooms 1,905 6 rooms 598 7 rooms 48 8 rooms 251 9+ rooms
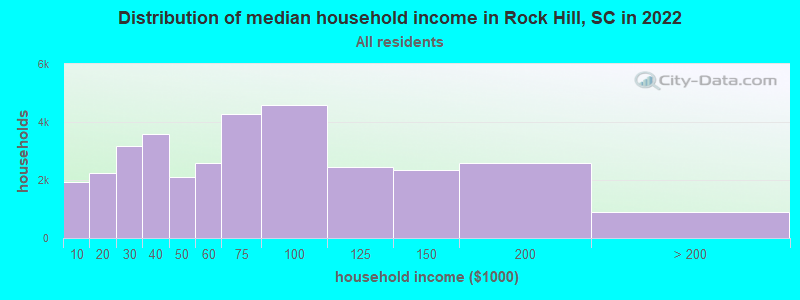
Rock Hill, SC household income distribution 1,938 Less than $10,0002,249 $10,000 to $19,9993,182 $20,000 to $29,9993,574 $30,000 to $39,9992,101 $40,000 to $49,9992,595 $50,000 to $59,9994,264 $60,000 to $74,9994,602 $75,000 to $99,9992,436 $100,000 to $124,9992,359 $125,000 to $149,9992,578 $150,000 to $199,999892 $200,000 or more
Home value of owner - occupied houses in 2022 in Rock Hill, SC 107 Less than $10,00038 $10,000 to $14,999115 $15,000 to $19,999105 $20,000 to $24,9999 $25,000 to $29,999149 $30,000 to $34,99919 $35,000 to $39,99972 $40,000 to $49,999112 $50,000 to $59,999159 $60,000 to $69,99960 $70,000 to $79,999153 $80,000 to $89,999220 $90,000 to $99,999695 $100,000 to $124,999852 $125,000 to $149,9991,038 $150,000 to $174,999924 $175,000 to $199,9991,593 $200,000 to $249,9991,797 $250,000 to $299,9993,529 $300,000 to $399,9991,509 $400,000 to $499,9991,359 $500,000 to $749,999126 $750,000 to $999,99953 $1,000,000 to $1,499,99932 $2,000,000 or moreRent paid by renters in 2022 in Rock Hill, SC 100 Less than $10056 $100 to $14956 $150 to $19995 $200 to $24967 $250 to $2995 $300 to $34989 $350 to $399199 $400 to $449312 $450 to $499197 $500 to $549197 $550 to $599447 $600 to $649520 $650 to $699561 $700 to $749363 $750 to $799961 $800 to $8992,699 $900 to $9994,242 $1,000 to $1,2491,820 $1,250 to $1,499973 $1,500 to $1,99999 $2,000 to $2,499120 $2,500 to $2,999339 $3,000 to $3,49920 $3,500 or more676 No cash rent
Percentage of workers working in this county: 71.0%Number of people working at home: 4,236 (10.5% of all workers )
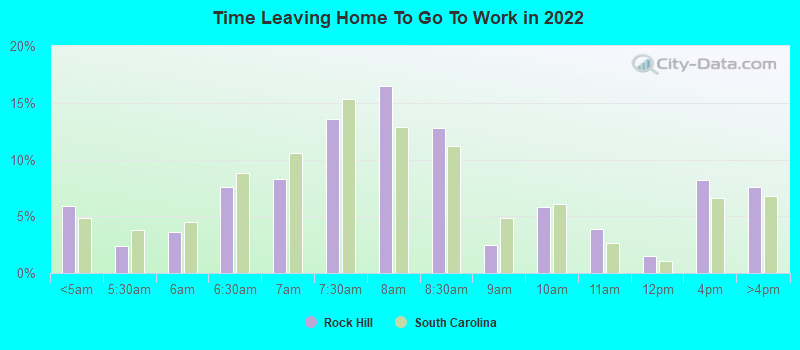
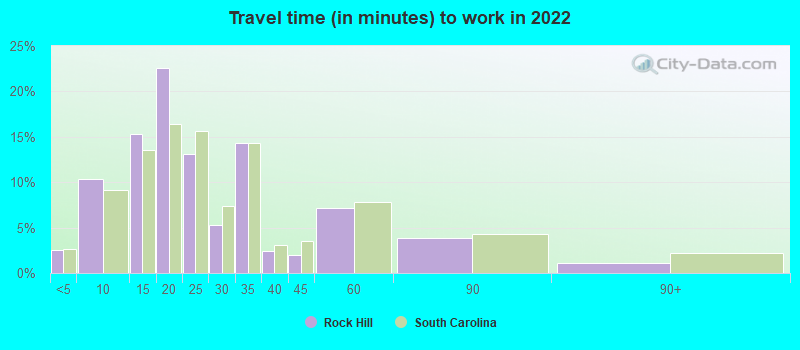
Travel time to work (commute)
Less than 5 minutes: 7915 to 9 minutes: 4,70710 to 14 minutes: 4,75615 to 19 minutes: 6,07320 to 24 minutes: 5,37925 to 29 minutes: 2,68030 to 34 minutes: 4,78335 to 39 minutes: 63740 to 44 minutes: 1,22745 to 59 minutes: 3,05660 to 89 minutes: 1,60690 or more minutes: 904
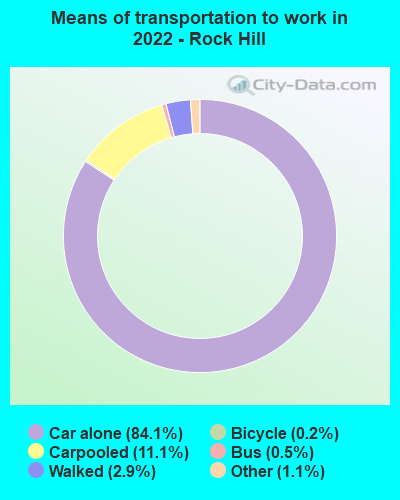
Means of transportation to work:
Drove a car alone: 36,747 (75.2%)Carpooled: 3,720 (7.6%)Bus : 187 (0.4%)Light rail, streetcar or trolley : 30 (0.1%)Taxi: 809 (1.7%)Bicycle: 111 (0.2%)Walked: 1,323 (2.7%)Worked at home: 4,236 (8.7%)
Unemployment by race in 2022
Unemployment rate for White non-Hispanic residents 3.3% Males1.9% FemalesUnemployment rate for Black residents 3.4% Males3.1% FemalesUnemployment rate for Asian residents 14.3% Males23.6% FemalesUnemployment rate for other race residents 2.3% FemalesUnemployment rate for two or more race residents 1.6% MalesUnemployment rate for Hispanic or Latino residents 0.5% Males0.6% Females
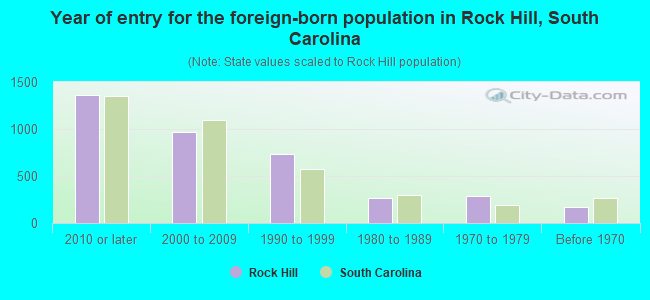
Year of entry for the foreign-born population in Rock Hill, South Carolina
1,362 2010 or later 971 2000 to 2009 735 1990 to 1999 264 1980 to 1989 287 1970 to 1979 166 Before 1970
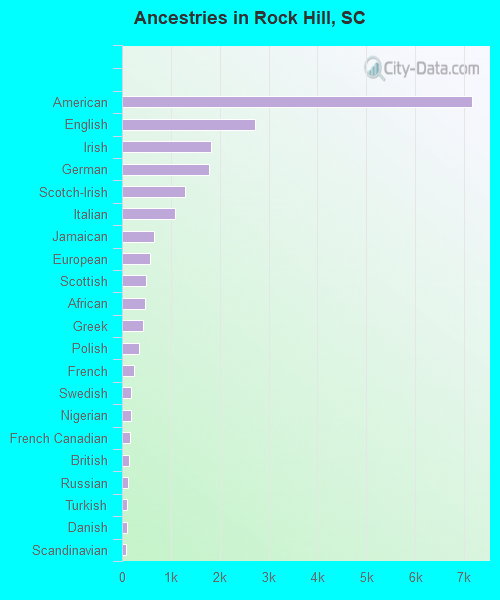
First ancestries reported:
American: 7,156 (15.4%)
English: 2,714 (5.9%)
Irish: 1,829 (3.9%)
German: 1,784 (3.8%)
Scotch-Irish: 1,300 (2.8%)
Italian: 1,080 (2.3%)
Jamaican: 660 (1.4%)
European: 571 (1.2%)
Scottish: 484 (1.0%)
African: 481 (1.0%)
Greek: 436 (0.9%)
Polish: 356 (0.8%)
French: 254 (0.5%)
Swedish: 188 (0.4%)
Nigerian: 179 (0.4%)
French Canadian: 167 (0.4%)
British: 140 (0.3%)
Russian: 115 (0.2%)
Turkish: 101 (0.2%)
Danish: 93 (0.2%)
Scandinavian: 75 (0.2%)
Eastern European: 61 (0.1%)
Lebanese: 56 (0.1%)
Welsh: 53 (0.1%)
Dutch: 44 (0.09%)
Norwegian: 41 (0.09%)
Swiss: 30 (0.06%)
Slovak: 23 (0.05%)
Jordanian: 20 (0.04%)
Croatian: 20 (0.04%)
Lithuanian: 17 (0.04%)
Brazilian: 16 (0.03%)
Haitian: 15 (0.03%)
Albanian: 14 (0.03%)
Liberian: 13 (0.03%)
Armenian: 13 (0.03%)
Ukrainian: 13 (0.03%)
Israeli: 12 (0.03%)
Czechoslovakian: 12 (0.03%)
Hungarian: 12 (0.03%)
West Indian: 11 (0.02%)
Czech: 8 (0.02%)
Iranian: 8 (0.02%)
Belgian: 8 (0.02%)
Austrian: 8 (0.02%)
Yugoslavian: 6 (0.01%)
Most common places of birth for foreign-born residents (%): Mexico Rock Hill:
17.5% (658)South Carolina:
22.5% (60,774)
Jamaica Rock Hill:
12.2% (458)South Carolina:
2.6% (7,073)
Nigeria Rock Hill:
6.2% (231)South Carolina:
0.6% (1,652)
El Salvador Rock Hill:
5.2% (196)South Carolina:
1.1% (2,998)
Honduras Rock Hill:
5.0% (188)South Carolina:
4.8% (12,834)
Uganda Rock Hill:
4.5% (170)South Carolina:
0.1% (312)
Germany Rock Hill:
4.5% (168)South Carolina:
3.7% (9,982)
Guyana Rock Hill:
3.0% (111)South Carolina:
0.2% (598)
China, excluding Hong Kong and Taiwan Rock Hill:
2.9% (110)South Carolina:
3.2% (8,721)
Dominican Republic Rock Hill:
2.5% (95)South Carolina:
0.9% (2,357)
Ecuador Rock Hill:
2.5% (93)South Carolina:
0.9% (2,502)
Vietnam Rock Hill:
2.4% (89)South Carolina:
2.3% (6,308)
Canada Rock Hill:
2.3% (88)South Carolina:
3.0% (8,193)
Philippines Rock Hill:
2.2% (82)South Carolina:
4.1% (11,031)
France Rock Hill:
1.9% (73)South Carolina:
0.7% (1,940)
Nicaragua Rock Hill:
1.6% (61)South Carolina:
0.3% (733)
Jordan Rock Hill:
1.6% (59)South Carolina:
0.1% (353)
India Rock Hill:
1.5% (57)South Carolina:
6.8% (18,307)
Place of birth for U.S.-born residents:
This state: 36,956Other state: 33,849Northeast: 6,784Midwest: 5,030South: 20,927West: 1,108 86.2% of Rock Hill residents lived in the same house 1 years ago.
Out of people who lived in different houses, 16.8% lived in this county.
Out of people who lived in different counties, 45.2% lived in South Carolina.
Rock Hill:
86.2%State average:
86.5%
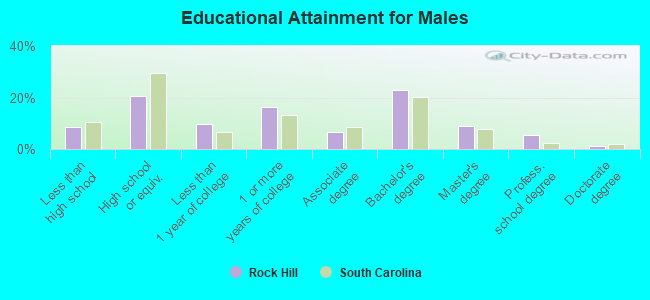
Education attainment for males 25 years and older:
No schooling: 184Nursery to 4th grade: 05th and 6th grade: 897th and 8th grade: 989th grade: 54410th grade: 64811th grade: 18312th grade, no diploma: 185High school graduate (or equivalency): 4,721Less than 1 year of college: 2,185Some college more than 1 year, no degree: 3,741Associate degree: 1,550Bachelor's degree: 5,236Master's degree: 2,049Professional school degree: 1,267Doctorate degree: 282
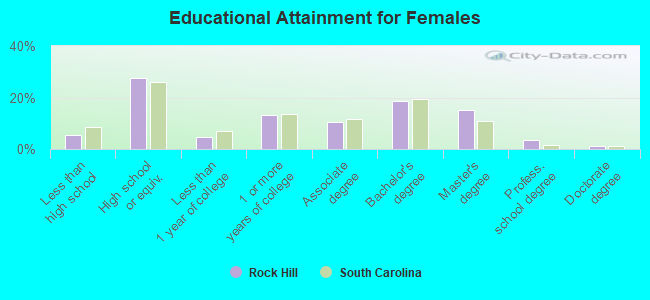
Education attainment for females 25 years and older:
No schooling: 42Nursery to 4th grade: 675th and 6th grade: 507th and 8th grade: 609th grade: 57710th grade: 17711th grade: 42712th grade, no diploma: 105High school graduate (or equivalency): 7,707Less than 1 year of college: 1,343Some college more than 1 year, no degree: 3,680Associate degree: 2,928Bachelor's degree: 5,151Master's degree: 4,221Professional school degree: 990Doctorate degree: 285
Housing units in structures:
One, detached: 21,320One, attached: 2,542Two: 6563 or 4: 1,9725 to 9: 1,73510 to 19: 2,10320 to 49: 1,89250 or more: 2,372Mobile homes: 594Median worth of mobile homes: $27,600
Housing units lacking complete plumbing facilities in 2022: 0.8%Housing units lacking complete kitchen facilities in 2022: 2.3%House/condo owner moved in on average 10 years ago
Renter moved in on average 3 years ago
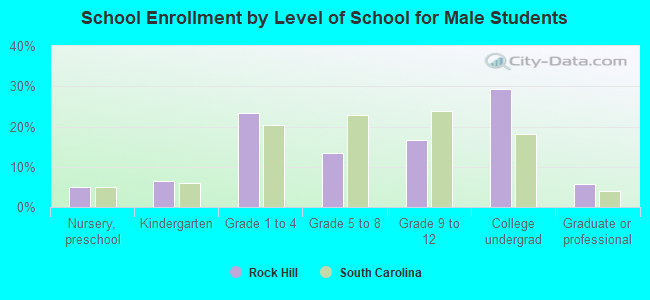
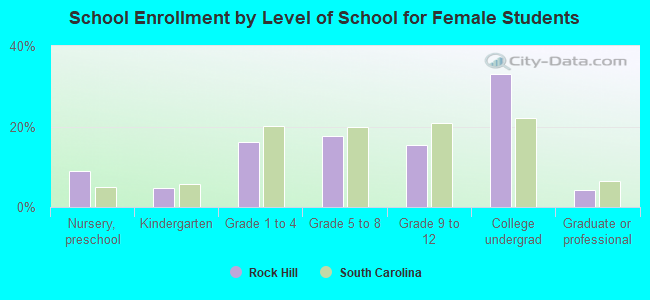
Private vs. public school enrollment:
Students in private schools in grades 1 to 8 (elementary and middle school): 154 Here:
2.3%South Carolina:
14.4%
Students in private schools in grades 9 to 12 (high school): 0 Here:
0.0%South Carolina:
11.1%
Students in private undergraduate colleges: 1,025 Here:
17.7%South Carolina:
21.9%