Rock Island, WA (Washington) Houses and Residents
| Rock Island: | $261,051 |
| Washington: | $569,500 |
Mean price in 2022:
Detached houses: $306,119
Here: $306,119 State: $734,307 Mobile homes: $197,170
Here: $197,170 State: $218,362
Total population: 792 (All urban)
Houses: 443 (429 occupied: 362 owner occupied, 68 renter occupied)
| % of renters here: | 16% |
| State: | 36% |
Housing density: 750 houses/condos per square mile
Median price asked for vacant for-sale houses and condos in 2022 in this county: $382,117.
Median contract rent in 2022: $752 (lower quartile is $589, upper quartile is $1,057)
Median gross rent in Rock Island, WA in 2022: $862
Housing units in Rock Island with a mortgage: 218 (3 second mortgage, 0 home equity loan, 1 both second mortgage and home equity loan)
Houses without a mortgage: 10
Median household income for houses/condos with a mortgage: $55,234
Median household income for apartments without a mortgage: $48,473
Median monthly housing costs: $1,026
Compare current foreclosures near Rock Island, WA:
| Photo | Address | Area | Beds / Baths | Price | Details |
|---|---|---|---|---|---|

|
#1
Island Loop
Rock Island, WA 98850
|
- sq. feet
|
2 baths 3 beds |
show details | |

|
#2
Center St
Rock Island, WA 98850
|
958 sq. feet
|
1 baths 2 beds |
show details | |

|
#3
Douglas St
Rock Island, WA 98850
|
- sq. feet
|
- baths - beds |
show details | |

|
#4
Island Loop Rd
Rock Island, WA 98850
|
- sq. feet
|
- baths - beds |
show details | |

|
#5
Easy Street
Monitor, WA 98836
|
- sq. feet
|
1 baths 4 beds |
$279,900
|
show details |

|
#6
Dean Ave S
East Wenatchee, WA 98802
|
1,087 sq. feet
|
1 baths 3 beds |
show details | |

|
#7
3rd Ave NE
Quincy, WA 98848
|
1,370 sq. feet
|
2 baths 3 beds |
show details | |

|
#8
H St SW
Quincy, WA 98848
|
2,616 sq. feet
|
2 baths 4 beds |
show details | |

|
#9
Marie Ave
Wenatchee, WA 98801
|
- sq. feet
|
1 baths 3 beds |
show details | |

|
#10
8th St
Wenatchee, WA 98801
|
1,083 sq. feet
|
1 baths 2 beds |
show details |
| Photo | Address | Area | Beds / Baths | Price | Details |
|---|---|---|---|---|---|

|
#11
Lambert St
Wenatchee, WA 98801
|
1,816 sq. feet
|
2 baths 4 beds |
show details | |

|
#12
Methow St
Wenatchee, WA 98801
|
1,423 sq. feet
|
1 baths 3 beds |
show details | |

|
#13
7th St NE
East Wenatchee, WA 98802
|
2,463 sq. feet
|
2 baths 4 beds |
show details | |

|
#14
J St SW
Quincy, WA 98848
|
1,080 sq. feet
|
1 baths 3 beds |
show details | |

|
#15
8th St SE
East Wenatchee, WA 98802
|
1,240 sq. feet
|
2 baths 3 beds |
show details | |

|
#16
Rock Island Rd
East Wenatchee, WA 98802
|
908 sq. feet
|
1 baths 2 beds |
show details | |

|
#17
S Franklin Ave
Wenatchee, WA 98801
|
962 sq. feet
|
1 baths 2 beds |
show details | |

|
#18
Weaver Rd
East Wenatchee, WA 98802
|
1,848 sq. feet
|
2 baths 4 beds |
show details | |

|
#19
Washington St
Wenatchee, WA 98801
|
2,970 sq. feet
|
2 baths 3 beds |
show details | |

|
#20
Easy St
Wenatchee, WA 98801
|
2,795 sq. feet
|
4 baths 6 beds |
show details |
| Photo | Address | Area | Beds / Baths | Price | Details |
|---|---|---|---|---|---|

|
#21
Amherst Ave
Wenatchee, WA 98801
|
1,440 sq. feet
|
2 baths 3 beds |
show details | |

|
#22
Bermuda St
Malaga, WA 98828
|
1,040 sq. feet
|
1 baths 3 beds |
show details | |

|
#23
8th St SE
East Wenatchee, WA 98802
|
1,240 sq. feet
|
1 baths 2 beds |
show details | |

|
#24
12th St NE
East Wenatchee, WA 98802
|
1,692 sq. feet
|
3 baths 3 beds |
show details | |

|
#25
Lambert St
Wenatchee, WA 98801
|
1,816 sq. feet
|
2 baths 3 beds |
show details | |

|
#26
Castlerock Ave
Wenatchee, WA 98801
|
2,122 sq. feet
|
1 baths 2 beds |
show details | |

|
#27
Millerdale Ave
Wenatchee, WA 98801
|
1,588 sq. feet
|
1 baths 3 beds |
show details | |

|
#28
Mulberry Ln
Wenatchee, WA 98801
|
1,331 sq. feet
|
2 baths 3 beds |
show details | |

|
#29
22nd St NW
East Wenatchee, WA 98802
|
1,620 sq. feet
|
2 baths 3 beds |
show details | |

|
#30
Rosewood Ave
Wenatchee, WA 98801
|
1,350 sq. feet
|
2 baths 4 beds |
show details |
| Photo | Address | Area | Beds / Baths | Price | Details |
|---|---|---|---|---|---|

|
#31
Cashmere St
Wenatchee, WA 98801
|
1,269 sq. feet
|
2 baths 3 beds |
show details | |

|
#32
13th St NE
East Wenatchee, WA 98802
|
2,309 sq. feet
|
1 baths 3 beds |
show details | |

|
#33
15th St NE
East Wenatchee, WA 98802
|
2,887 sq. feet
|
1 baths 3 beds |
show details | |

|
#34
Fuller St
Wenatchee, WA 98801
|
936 sq. feet
|
1 baths 2 beds |
show details | |

|
#35
5th St
Wenatchee, WA 98801
|
1,976 sq. feet
|
1 baths 2 beds |
show details | |

|
#36
N Ashland Ave
East Wenatchee, WA 98802
|
1,636 sq. feet
|
1 baths 2 beds |
show details | |

|
#37
N Jerome Ln
East Wenatchee, WA 98802
|
1,800 sq. feet
|
2 baths 3 beds |
show details | |

|
#38
Virginia Way
Wenatchee, WA 98801
|
1,855 sq. feet
|
2 baths 3 beds |
show details | |

|
#39
Highland Dr
Wenatchee, WA 98801
|
828 sq. feet
|
2 baths 4 beds |
show details | |

|
#40
Malaga Alcoa Hwy
Malaga, WA 98828
|
- sq. feet
|
- baths - beds |
show details |
| Photo | Address | Area | Beds / Baths | Price | Details |
|---|---|---|---|---|---|

|
#41
F St SW # B
Quincy, WA 98848
|
- sq. feet
|
- baths - beds |
show details | |

|
#42
L St SW
Quincy, WA 98848
|
- sq. feet
|
- baths - beds |
show details | |

|
#43
Malaga Alcoa Hwy
Malaga, WA 98828
|
- sq. feet
|
- baths - beds |
show details | |

|
#44
Easy St
Wenatchee, WA 98801
|
- sq. feet
|
- baths - beds |
show details | |

|
#45
Maiden Ln
Wenatchee, WA 98801
|
6,784 sq. feet
|
- baths - beds |
show details | |

|
#46
7th Ave SW
Quincy, WA 98848
|
- sq. feet
|
- baths - beds |
show details | |

|
#47
NW Delcon Ct
East Wenatchee, WA 98802
|
- sq. feet
|
- baths - beds |
show details | |

|
#48
Stella Ave # G362
Wenatchee, WA 98801
|
- sq. feet
|
- baths - beds |
show details | |

|
#49
SE Marlette Rd
East Wenatchee, WA 98802
|
- sq. feet
|
- baths - beds |
show details | |

|
Check over 1 million property listings on Foreclosure.com!
|
browse all offers | |||


Median year apartment built: 1983
Household type by relationship:
Households: 1,274- Male householders: 221 (43 living alone), Female householders: 200 (46 living alone)
219 spouses (209 opposite-sex spouses), 42 unmarried partners, (42 opposite-sex unmarried partners), 467 children (429 natural, 19 adopted, 19 stepchildren), 8 grandchildren, 26 brothers or sisters, 28 parents, 0 foster children, 28 other relatives, 31 non-relatives
Size of family households: 59 2-persons, 97 3-persons, 57 4-persons, 70 5-persons, 11 6-persons, 4 7-or-more-persons.
Size of nonfamily households: 95 1-person, 14 2-persons, 2 3-persons, 13 4-persons.
253 married couples with children.
84 single-parent households (0 men, 84 women).
50.4% of residents of Rock Island speak English at home.
49.4% of residents speak Spanish at home (58% speak English very well, 16% speak English well, 16% speak English not well, 10% don't speak English at all).
0.1% of residents speak other Indo-European language at home (100% speak English well).
0.1% of residents speak other language at home (100% speak English very well).
Foreign born population: 316 (24.8%)
(31.0% of them are naturalized citizens)
| Here: | 4.9 |
| State: | 6.5 |
| Here: | 3.8 |
| State: | 3.9 |

- Bedrooms in owner-occupied houses and condos in Rock Island, Washington
- 0no bedroom
- 141 bedroom
- 852 bedrooms
- 2203 bedrooms
- 404 bedrooms
- 35+ bedrooms

- Bedrooms in renter-occupied apartments in Rock Island, Washington
- 6no bedroom
- 101 bedroom
- 342 bedrooms
- 183 bedrooms
- 04 bedrooms
- 05+ bedrooms

- Cars and other vehicles available in Rock Island in owner-occupied houses/condos
- 10no vehicle
- 661 vehicle
- 1552 vehicles
- 423 vehicles
- 564 vehicles
- 335+ vehicles

- Cars and other vehicles available in Rock Island in renter-occupied apartments
- 0no vehicle
- 241 vehicle
- 262 vehicles
- 113 vehicles
- 74 vehicles
- 05+ vehicles

- Rooms in owner-occupied houses in Rock Island, Washington
- 01 room
- 112 rooms
- 393 rooms
- 824 rooms
- 1235 rooms
- 566 rooms
- 377 rooms
- 118 rooms
- 39+ rooms

- Rooms in renter-occupied apartments in Rock Island, Washington
- 61 room
- 42 rooms
- 73 rooms
- 374 rooms
- 135 rooms
- 06 rooms
- 07 rooms
- 08 rooms
- 09+ rooms


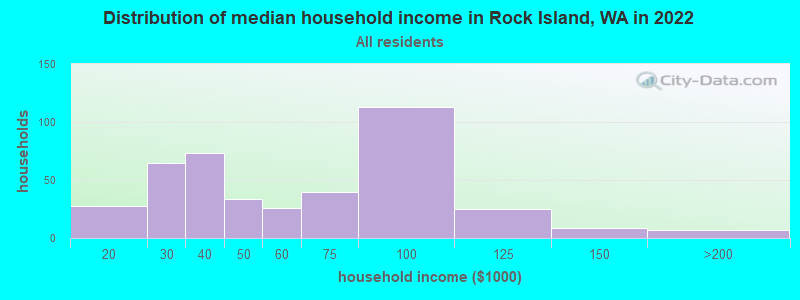
Rock Island, WA household income distribution

- 28$10,000 to $19,999
- 65$20,000 to $29,999
- 73$30,000 to $39,999
- 34$40,000 to $49,999
- 26$50,000 to $59,999
- 40$60,000 to $74,999
- 113$75,000 to $99,999
- 25$100,000 to $124,999
- 9$125,000 to $149,999
- 5$150,000 to $199,999
- 2$200,000 or more
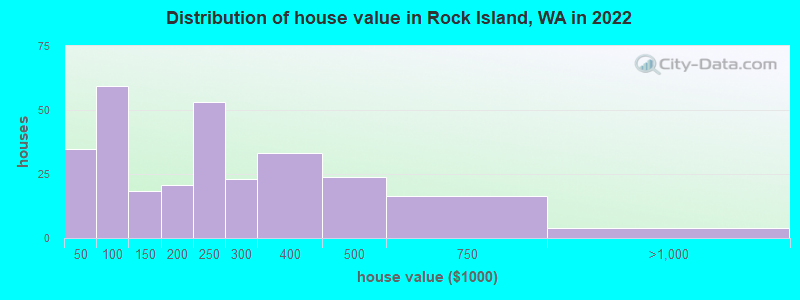
Home value of owner - occupied houses in 2022 in Rock Island, WA
-
- 2$15,000 to $19,999
- 10$25,000 to $29,999
- 2$30,000 to $34,999
- 18$40,000 to $49,999
- 9$50,000 to $59,999
- 14$80,000 to $89,999
- 16$90,000 to $99,999
- 6$100,000 to $124,999
- 12$125,000 to $149,999
- 1$150,000 to $174,999
- 19$175,000 to $199,999
- 53$200,000 to $249,999
- 22$250,000 to $299,999
- 33$300,000 to $399,999
- 23$400,000 to $499,999
- 16$500,000 to $749,999
- 3$750,000 to $999,999
Rent paid by renters in 2022 in Rock Island, WA
-
- 7$150 to $199
- 3$450 to $499
- 6$550 to $599
- 7$700 to $749
- 2$800 to $899
- 5$900 to $999
- 13$1,000 to $1,249
- 4$1,500 to $1,999
- 3No cash rent

Percentage of workers working in this county: 43.5%
Number of people working at home: 28 (5.6% of all workers)
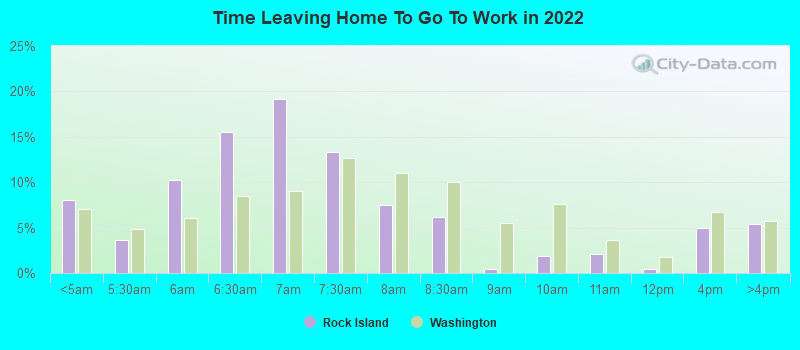
Travel time to work (commute)
- Less than 5 minutes: 24
- 5 to 9 minutes: 19
- 10 to 14 minutes: 35
- 15 to 19 minutes: 120
- 20 to 24 minutes: 87
- 25 to 29 minutes: 39
- 30 to 34 minutes: 87
- 35 to 39 minutes: 0
- 40 to 44 minutes: 9
- 45 to 59 minutes: 4
- 60 to 89 minutes: 13
- 90 or more minutes: 8
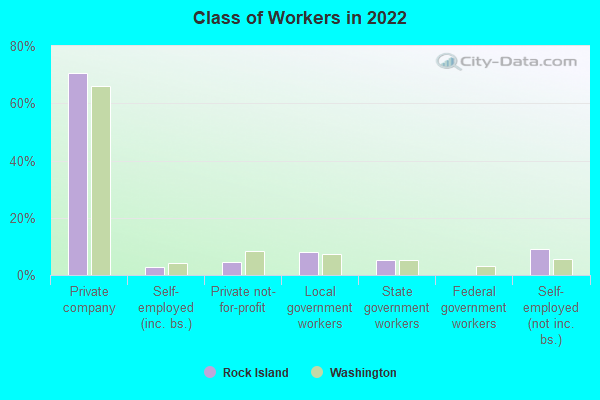
Means of transportation to work:
- Drove a car alone: 285 (74.4%)
- Carpooled: 67 (17.5%)
- Bus or trolley bus: 7 (1.8%)
- Motorcycle: 3 (0.8%)
- Walked: 8 (2.1%)
- Other means: 2 (0.5%)
- Worked at home: 11 (2.9%)
- Unemployment by race in 2022
- Unemployment rate for White non-Hispanic residents
- 0.8%Males
- 2.3%Females
- Unemployment rate for other race residents
- 15.8%Males
- Unemployment rate for Hispanic or Latino residents
- 19.1%Males

- Year of entry for the foreign-born population in Rock Island, Washington
- 602010 or later
- 1422000 to 2009
- 551990 to 1999
- 821980 to 1989
- 221970 to 1979
- 8Before 1970

First ancestries reported:
- American: 64 (7.1%)
- German: 43 (4.8%)
- Danish: 27 (3.0%)
- English: 22 (2.4%)
- French Canadian: 12 (1.3%)
- Nigerian: 8 (0.9%)
- Irish: 5 (0.6%)
- Scottish: 3 (0.3%)
- Northern European: 1 (0.1%)
- Swedish: 1 (0.1%)
Most common places of birth for foreign-born residents (%):
| Rock Island: | 72.8% (230) |
| Washington: | 21.1% (241,655) |
| Rock Island: | 16.1% (51) |
| Washington: | 1.2% (13,855) |
| Rock Island: | 7.3% (23) |
| Washington: | 0.4% (4,144) |
Place of birth for U.S.-born residents:
- This state: 720
- Other state: 220
- Northeast: 17
- Midwest: 22
- South: 32
- West: 148
91.6% of Rock Island residents lived in the same house 1 years ago.
Out of people who lived in different houses, 36.7% lived in this county.
Out of people who lived in different counties, 100.0% lived in Washington.
| Rock Island: | 91.6% |
| State average: | 85.2% |
Education attainment for males 25 years and older:
- No schooling: 36
- Nursery to 4th grade: 35
- 5th and 6th grade: 12
- 7th and 8th grade: 17
- 9th grade: 38
- 10th grade: 6
- 11th grade: 8
- 12th grade, no diploma: 0
- High school graduate (or equivalency): 80
- Less than 1 year of college: 4
- Some college more than 1 year, no degree: 58
- Associate degree: 24
- Bachelor's degree: 20
- Master's degree: 9
- Professional school degree: 0
- Doctorate degree: 2

Education attainment for females 25 years and older:
- No schooling: 1
- Nursery to 4th grade: 19
- 5th and 6th grade: 59
- 7th and 8th grade: 17
- 9th grade: 20
- 10th grade: 0
- 11th grade: 14
- 12th grade, no diploma: 9
- High school graduate (or equivalency): 109
- Less than 1 year of college: 22
- Some college more than 1 year, no degree: 58
- Associate degree: 30
- Bachelor's degree: 16
- Master's degree: 16
- Professional school degree: 0
- Doctorate degree: 0


Housing units in structures:
- One, detached: 268
- Mobile homes: 163
- Boats, RVs, vans, etc.: 10
House/condo owner moved in on average 10 years ago
Renter moved in on average 6 years ago

Private vs. public school enrollment:
| Here: | 2.5% |
| Washington: | 12.4% |
| Here: | 6.7% |
| Washington: | 9.2% |
| Here: | 16.0% |
| Washington: | 16.5% |


