Rockford, IL (Illinois) Houses and Residents
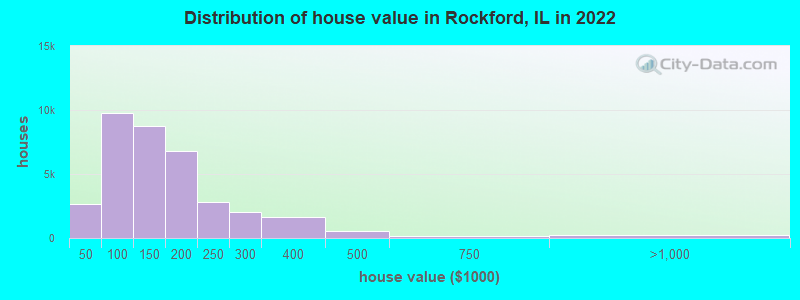
Estimated median house or condo value in 2022: $133,000 (it was $79,400 in 2000 )
Rockford:
$133,000Illinois:
$251,600
Lower value quartile - upper value quartile: $86,300 - $188,000Mean price in 2022: Detached houses: $140,050 Here:
$140,050State:
$310,164
Townhouses or other attached units: $427,021 Here:
$427,021State:
$286,230
In 2-unit structures: $117,833 Here:
$117,833State:
$299,638
In 3-to-4-unit structures: $84,323 Here:
$84,323State:
$330,907
In 5-or-more-unit structures: $116,816 Here:
$116,816State:
$318,887
Mobile homes: $68,414 Here:
$68,414State:
$78,855
Total population: 149,123 (All urban)
Houses: 65,252 (59,129 occupied: 34,411 owner occupied, 24,718 renter occupied )
% of renters here:
42%State:
33%
Housing density: 1,165 houses/condos per square mile
Median price asked for vacant for-sale houses and condos in 2022: $88,240.
Median contract rent in 2022: $728 (lower quartile is $541, upper quartile is $888)
Median rent asked for vacant for-rent units in 2022: $748
Median gross rent in Rockford, IL in 2022: $920
Housing units in Rockford with a mortgage: 21,717 (1,095 second mortgage, 0 home equity loan, 835 both second mortgage and home equity loan )Houses without a mortgage: 852
Median household income for houses/condos with a mortgage: $82,261
Median household income for apartments without a mortgage: $62,906
Median monthly housing costs: $926
Data:
Median house or condo value ($)
Median house or condo value ($ change since 2000)
Median house or condo value ($) - White
Median house or condo value ($) - Black or African American
Median house or condo value ($) - Asian
Median house or condo value ($) - Hispanic or Latino
Median house or condo value ($) - American Indian and Alaska Native
Median house or condo value ($) - Multirace
Median house or condo value ($) - Other Race
Median price asked for mobile homes ($)
Household density (households per square mile)
Mean house or condo value by units in structure - 1, detached ($)
Mean house or condo value by units in structure - 1, attached ($)
Mean house or condo value by units in structure - 2 ($)
Mean house or condo value by units in structure by units in structure - 3 or 4 ($)
Mean house or condo value by units in structure - 5 or more ($)
Mean house or condo value by units in structure - Boat, RV, van, etc. ($)
Mean house or condo value by units in structure - Mobile home ($)
Median contract rent ($)
Median contract rent - Lower quartile ($)
Median contract rent - Upper quartile ($)
Median gross rent ($)
Urban houses (%)
Rural houses (%)
Houses occupied (%)
Houses occupied (% change since 2000)
Houses owner occupied (%)
Houses owner occupied (% change since 2000)
Houses renter occupied (%)
Houses renter occupied (% change since 2000)
Vacant housing units - For rent (%)
Vacant housing units - For rent (% change since 2000)
Vacant housing units - For sale only (%)
Vacant housing units - For sale only (% change since 2000)
Vacant housing units - Rented or sold, not occupied (%)
Vacant housing units - Rented or sold, not occupied (% change since 2000)
Vacant housing units - For seasonal, recreational, or occasional use (%)
Vacant housing units - For seasonal, recreational, or occasional use (% change since 2000)
Vacant housing units - For migrant workers (%)
Vacant housing units - For migrant workers (% change since 2000)
Vacant housing units - Other vacant (%)
Vacant housing units - Other vacant (% change since 2000)
Median monthly housing costs ($)
Median household income for houses/condos with a mortgage ($)
Median household income for houses/condos without a mortgage ($)
Median household income ($)
Median household income ($) - White
Median household income ($) - Black or African American
Median household income ($) - Asian
Median household income ($) - Hispanic or Latino
Median household income ($) - American Indian and Alaska Native
Median household income ($) - Multirace
Median household income ($) - Other Race
Mortgage status - with mortgage (%)
Mortgage status - with second mortgage (%)
Mortgage status - with home equity loan (%)
Mortgage status - with both second mortgage and home equity loan (%)
Mortgage status - without a mortgage (%)
Median year house/condo built
Median year apartment built
Household type by relationship - Male householder living alone (%)
Household type by relationship - Male householder not living alone (%)
Household type by relationship - Female householder living alone (%)
Household type by relationship - Female householder not living alone (%)
Household type by relationship - Opposite-Sex spouse (%)
Household type by relationship - Same-Sex spouse (%)
Household type by relationship - Opposite-Sex unmarried partner (%)
Household type by relationship - Same-Sex unmarried partner (%)
Household type by relationship - In group quarters (%)
Size of family households - 2-person household (%)
Size of family households - 3-person household (%)
Size of family households - 4-person household (%)
Size of family households - 5-person household (%)
Size of family households - 6-person household (%)
Size of family households - 7-or-more-person household (%)
Size of nonfamily households - 1-person household (%)
Size of nonfamily households - 2-person household (%)
Size of nonfamily households - 3-person household (%)
Size of nonfamily households - 4-person household (%)
Size of nonfamily households - 5-person household (%)
Size of nonfamily households - 6-person household (%)
Size of nonfamily households - 7-or-moreperson household (%)
Year house built - Built 2010 or later (%)
Year house built - Built 2000 to 2009 (%)
Year house built - Built 1990 to 1999 (%)
Year house built - Built 1980 to 1989 (%)
Year house built - Built 1970 to 1979 (%)
Year house built - Built 1960 to 1969 (%)
Year house built - Built 1950 to 1959 (%)
Year house built - Built 1940 to 1949 (%)
Year house built - Built 1939 or earlier (%)
Median number of rooms in houses and condos
Median number of rooms in apartments
Median number of bedrooms in owner occupied houses
Mean number of bedrooms in owner occupied houses
Median number of bedrooms in renter occupied houses
Mean number of bedrooms in renter occupied houses
Median number of vehichles in owner occupied houses
Mean number of vehichles in owner occupied houses
Median number of vehichles in renter occupied houses
Mean number of vehichles in renter occupied houses
Rooms in owner-occupied houses - 1 room (%)
Rooms in owner-occupied houses - 2 rooms (%)
Rooms in owner-occupied houses - 3 rooms (%)
Rooms in owner-occupied houses - 4 rooms (%)
Rooms in owner-occupied houses - 5 rooms (%)
Rooms in owner-occupied houses - 6 rooms (%)
Rooms in owner-occupied houses - 7 rooms (%)
Rooms in owner-occupied houses - 8 rooms (%)
Rooms in owner-occupied houses - 9+ rooms (%)
Rooms in renter-occupied houses - 1 room (%)
Rooms in renter-occupied houses - 2 rooms (%)
Rooms in renter-occupied houses - 3 rooms (%)
Rooms in renter-occupied houses - 4 rooms (%)
Rooms in renter-occupied houses - 5 rooms (%)
Rooms in renter-occupied houses - 6 rooms (%)
Rooms in renter-occupied houses - 7 rooms (%)
Rooms in renter-occupied houses - 8 rooms (%)
Rooms in renter-occupied houses - 9+ rooms (%)
Bedrooms in owner-occupied houses - no bedrooms (%)
Bedrooms in owner-occupied houses - 1 bedroom (%)
Bedrooms in owner-occupied houses - 2 bedrooms (%)
Bedrooms in owner-occupied houses - 3 bedrooms (%)
Bedrooms in owner-occupied houses - 4 bedrooms (%)
Bedrooms in owner-occupied houses - 5+ bedrooms (%)
Bedrooms in renter-occupied houses - no bedrooms (%)
Bedrooms in renter-occupied houses - 1 bedroom (%)
Bedrooms in renter-occupied houses - 2 bedrooms (%)
Bedrooms in renter-occupied houses - 3 bedrooms (%)
Bedrooms in renter-occupied houses - 4 bedrooms (%)
Bedrooms in renter-occupied houses - 5+ bedrooms (%)
Vehicles available in owner-occupied houses - no vehicle available (%)
Vehicles available in owner-occupied houses - 1 vehicle available(%)
Vehicles available in owner-occupied houses - 2 Vehicles available (%)
Vehicles available in owner-occupied houses - 3 Vehicles available (%)
Vehicles available in owner-occupied houses - 4 Vehicles available (%)
Vehicles available in owner-occupied houses - 5+ Vehicles available (%)
Vehicles available in renter-occupied houses - no vehicle available (%)
Vehicles available in renter-occupied houses - 1 vehicle available (%)
Vehicles available in renter-occupied houses - 2 Vehicles available (%)
Vehicles available in renter-occupied houses - 3 Vehicles available (%)
Vehicles available in renter-occupied houses - 4 Vehicles available (%)
Vehicles available in renter-occupied houses - 5+ Vehicles available (%)
Housing units in structures - 1, detached (%)
Housing units in structures - 1, attached (%)
Housing units in structures - 2 (%)
Housing units in structures - 3 or 4 (%)
Housing units in structures - 5 to 9 (%)
Housing units in structures - 10 to 19 (%)
Housing units in structures - 20 to 49 (%)
Housing units in structures - 50 or more (%)
Housing units in structures - Mobile home (%)
Housing units in structures - Boat, RV, van, etc. (%)
Housing units in structures - Owners - 1, detached (%)
Housing units in structures - Owners - 1, attached (%)
Housing units in structures - Owners - 2 (%)
Housing units in structures - Owners - 3 or 4 (%)
Housing units in structures - Owners - 5 to 9 (%)
Housing units in structures - Owners - 10 to 19 (%)
Housing units in structures - Owners - 20 to 49 (%)
Housing units in structures - Owners - 50 or more (%)
Housing units in structures - Owners - Mobile home (%)
Housing units in structures - Owners - Boat, RV, van, etc. (%)
Housing units in structures - Renters - 1, detached (%)
Housing units in structures - Renters - 1, attached (%)
Housing units in structures - Renters - 2 (%)
Housing units in structures - Renters - 3 or 4 (%)
Housing units in structures - Renters - 5 to 9 (%)
Housing units in structures - Renters - 10 to 19 (%)
Housing units in structures - Renters - 20 to 49 (%)
Housing units in structures - Renters - 50 or more (%)
Housing units in structures - Renters - Mobile home (%)
Housing units in structures - Renters - Boat, RV, van, etc. (%)
House/condo owner moved in on average (years ago)
Renter moved in on average (years ago)
Year householder moved into unit - Moved in 1999 to March 2000 (%)
Year householder moved into unit - Moved in 1999 to March 2000 (%) - White
Year householder moved into unit - Moved in 1999 to March 2000 (%) - Black or African American
Year householder moved into unit - Moved in 1999 to March 2000 (%) - Asian
Year householder moved into unit - Moved in 1999 to March 2000 (%) - Hispanic or Latino
Year householder moved into unit - Moved in 1999 to March 2000 (%) - American Indian and Alaska Native
Year householder moved into unit - Moved in 1999 to March 2000 (%) - Multirace
Year householder moved into unit - Moved in 1999 to March 2000 (%) - Other Race
Year householder moved into unit - Moved in 1995 to 1998 (%)
Year householder moved into unit - Moved in 1995 to 1998 (%) - White
Year householder moved into unit - Moved in 1995 to 1998 (%) - Black or African American
Year householder moved into unit - Moved in 1995 to 1998 (%) - Asian
Year householder moved into unit - Moved in 1995 to 1998 (%) - Hispanic or Latino
Year householder moved into unit - Moved in 1995 to 1998 (%) - American Indian and Alaska Native
Year householder moved into unit - Moved in 1995 to 1998 (%) - Multirace
Year householder moved into unit - Moved in 1995 to 1998 (%) - Other Race
Year householder moved into unit - Moved in 1990 to 1994 (%)
Year householder moved into unit - Moved in 1990 to 1994 (%) - White
Year householder moved into unit - Moved in 1990 to 1994 (%) - Black or African American
Year householder moved into unit - Moved in 1990 to 1994 (%) - Asian
Year householder moved into unit - Moved in 1990 to 1994 (%) - Hispanic or Latino
Year householder moved into unit - Moved in 1990 to 1994 (%) - American Indian and Alaska Native
Year householder moved into unit - Moved in 1990 to 1994 (%) - Multirace
Year householder moved into unit - Moved in 1990 to 1994 (%) - Other Race
Year householder moved into unit - Moved in 1980 to 1989 (%)
Year householder moved into unit - Moved in 1980 to 1989 (%) - White
Year householder moved into unit - Moved in 1980 to 1989 (%) - Black or African American
Year householder moved into unit - Moved in 1980 to 1989 (%) - Asian
Year householder moved into unit - Moved in 1980 to 1989 (%) - Hispanic or Latino
Year householder moved into unit - Moved in 1980 to 1989 (%) - American Indian and Alaska Native
Year householder moved into unit - Moved in 1980 to 1989 (%) - Multirace
Year householder moved into unit - Moved in 1980 to 1989 (%) - Other Race
Year householder moved into unit - Moved in 1970 to 1979 (%)
Year householder moved into unit - Moved in 1970 to 1979 (%) - White
Year householder moved into unit - Moved in 1970 to 1979 (%) - Black or African American
Year householder moved into unit - Moved in 1970 to 1979 (%) - Asian
Year householder moved into unit - Moved in 1970 to 1979 (%) - Hispanic or Latino
Year householder moved into unit - Moved in 1970 to 1979 (%) - American Indian and Alaska Native
Year householder moved into unit - Moved in 1970 to 1979 (%) - Multirace
Year householder moved into unit - Moved in 1970 to 1979 (%) - Other Race
Year householder moved into unit - Moved in 1969 or earlier (%)
Year householder moved into unit - Moved in 1969 or earlier (%) - White
Year householder moved into unit - Moved in 1969 or earlier (%) - Black or African American
Year householder moved into unit - Moved in 1969 or earlier (%) - Asian
Year householder moved into unit - Moved in 1969 or earlier (%) - Hispanic or Latino
Year householder moved into unit - Moved in 1969 or earlier (%) - American Indian and Alaska Native
Year householder moved into unit - Moved in 1969 or earlier (%) - Multirace
Year householder moved into unit - Moved in 1969 or earlier (%) - Other Race
Housing units lacking complete plumbing facilities (%)
Housing units lacking complete kitchen facilities (%)
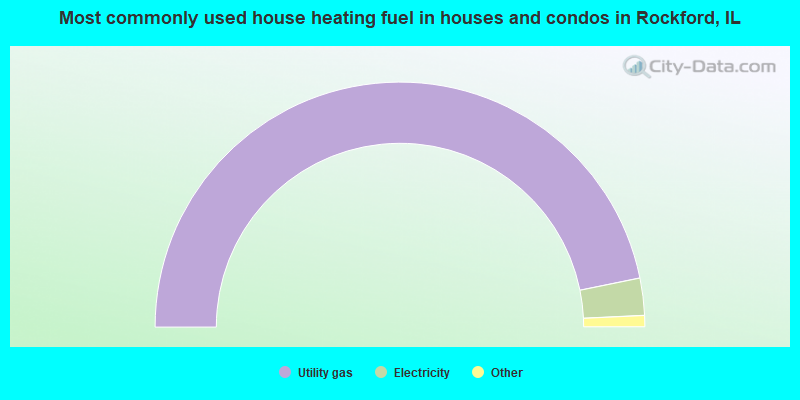
House heating fuel used in houses and condos - Utility gas (%)
House heating fuel used in houses and condos - Bottled, tank, or LP gas (%)
House heating fuel used in houses and condos - Electricity (%)
House heating fuel used in houses and condos - Fuel oil, kerosene, etc. (%)
House heating fuel used in houses and condos - Coal or coke (%)
House heating fuel used in houses and condos - Wood (%)
House heating fuel used in houses and condos - Solar energy (%)
House heating fuel used in houses and condos - Other fuel (%)
House heating fuel used in houses and condos - No fuel used (%)
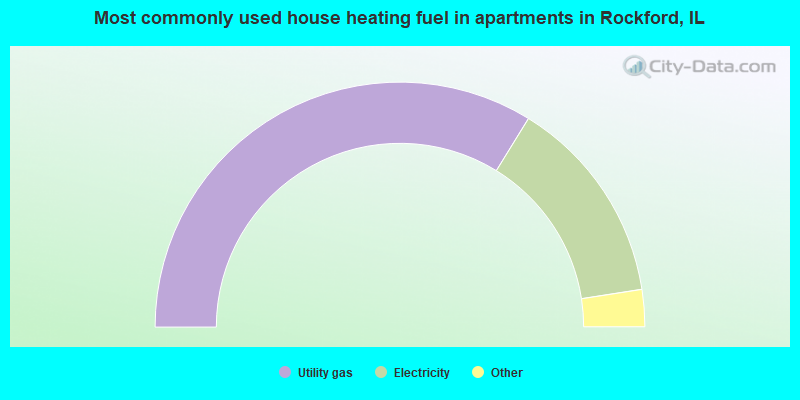
House heating fuel used in apartments - Utility gas (%)
House heating fuel used in apartments - Bottled, tank, or LP gas (%)
House heating fuel used in apartments - Electricity (%)
House heating fuel used in apartments - Fuel oil, kerosene, etc. (%)
House heating fuel used in apartments - Coal or coke (%)
House heating fuel used in apartments - Wood (%)
House heating fuel used in apartments - Solar energy (%)
House heating fuel used in apartments - Other fuel (%)
House heating fuel used in apartments - No fuel used (%)
Latest news about housing in Rockford, IL collected exclusively by city-data.com from local newspapers, TV, and radio stations
Median year house/condo built: 1963Median year apartment built: 1963Household type by relationship:
Households: 145,835
Male householders: 26,343 (9,258 living alone ), Female householders: 32,786 (11,708 living alone )21,413 spouses (20,839 opposite-sex spouses ), 4,862 unmarried partners , (4,478 opposite-sex unmarried partners ), 42,226 children (40,215 natural , 463 adopted , 1,548 stepchildren ), 3,245 grandchildren , 2,511 brothers or sisters , 2,007 parents , 0 foster children , 2,592 other relatives , 4,277 non-relatives In group quarters: 3,573
Size of family households: 14,383 2-persons , 7,592 3-persons , 5,302 4-persons , 4,104 5-persons , 1,782 6-persons , 630 7-or-more-persons .
Size of nonfamily households: 20,966 1-person , 3,756 2-persons , 194 3-persons , 348 4-persons , 72 6-persons .
15,167 married couples with children. single-parent households (2,905 men , 12,923 women ).
78.9% of residents of Rockford speak English at home. of residents speak Spanish at home (67% speak English very well , 19% speak English well , 11% speak English not well , 3% don't speak English at all ).of residents speak other Indo-European language at home (68% speak English very well , 20% speak English well , 10% speak English not well , 2% don't speak English at all ).of residents speak Asian or Pacific Island language at home (70% speak English very well , 17% speak English well , 11% speak English not well , 2% don't speak English at all ).of residents speak other language at home (73% speak English very well , 14% speak English well , 10% speak English not well , 3% don't speak English at all ).
Foreign born population: 15,129 (10.4%)of them are naturalized citizens )
Median number of rooms in houses and condos:
Median number of rooms in apartments
Owner-occupied Renter-occupied
Bedrooms in owner-occupied houses and condos in Rockford, Illinois
129 no bedroom 961 1 bedroom 7,418 2 bedrooms 17,073 3 bedrooms 7,507 4 bedrooms 1,323 5+ bedrooms
Bedrooms in renter-occupied apartments in Rockford, Illinois
1,226 no bedroom 6,710 1 bedroom 9,085 2 bedrooms 4,938 3 bedrooms 2,408 4 bedrooms 351 5+ bedrooms
Owner-occupied Renter-occupied
Rooms in owner-occupied houses in Rockford, Illinois
129 1 room 56 2 rooms 652 3 rooms 2,620 4 rooms 6,945 5 rooms 8,469 6 rooms 4,497 7 rooms 4,148 8 rooms 6,895 9+ rooms
Rooms in renter-occupied apartments in Rockford, Illinois
1,163 1 room 1,328 2 rooms 4,417 3 rooms 5,320 4 rooms 5,765 5 rooms 3,156 6 rooms 2,111 7 rooms 549 8 rooms 909 9+ rooms
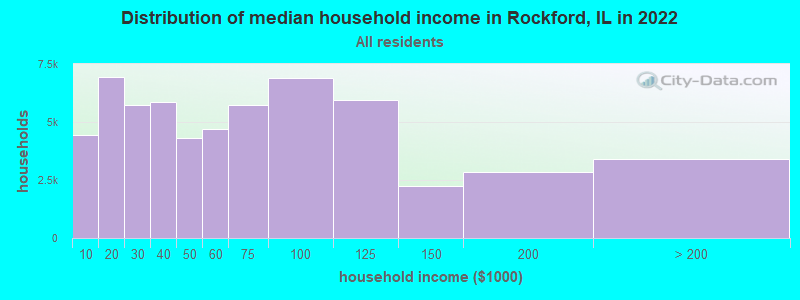
Rockford, IL household income distribution 4,459 Less than $10,0006,937 $10,000 to $19,9995,748 $20,000 to $29,9995,879 $30,000 to $39,9994,313 $40,000 to $49,9994,706 $50,000 to $59,9995,744 $60,000 to $74,9996,902 $75,000 to $99,9995,951 $100,000 to $124,9992,238 $125,000 to $149,9992,842 $150,000 to $199,9993,410 $200,000 or more
Home value of owner - occupied houses in 2022 in Rockford, IL 300 Less than $10,000176 $10,000 to $14,99936 $15,000 to $19,99971 $20,000 to $24,999326 $25,000 to $29,999332 $30,000 to $34,999547 $35,000 to $39,999830 $40,000 to $49,999524 $50,000 to $59,9991,713 $60,000 to $69,9992,093 $70,000 to $79,9992,613 $80,000 to $89,9991,971 $90,000 to $99,9994,238 $100,000 to $124,9994,504 $125,000 to $149,9994,156 $150,000 to $174,9992,649 $175,000 to $199,9992,786 $200,000 to $249,9992,052 $250,000 to $299,9991,609 $300,000 to $399,999542 $400,000 to $499,999139 $500,000 to $749,999149 $750,000 to $999,99955 $2,000,000 or moreRent paid by renters in 2022 in Rockford, IL 231 Less than $100387 $100 to $149700 $150 to $199395 $200 to $249156 $250 to $299802 $300 to $349280 $350 to $399556 $400 to $449784 $450 to $4991,872 $500 to $5491,582 $550 to $5991,101 $600 to $6491,889 $650 to $6991,700 $700 to $7492,338 $750 to $7993,127 $800 to $8991,663 $900 to $9992,685 $1,000 to $1,249550 $1,250 to $1,499206 $1,500 to $1,99992 $2,000 to $2,499133 $2,500 to $2,99931 $3,000 to $3,49990 $3,500 or more1,368 No cash rent
Percentage of workers working in this county: 85.8%Number of people working at home: 6,455 (10.4% of all workers )
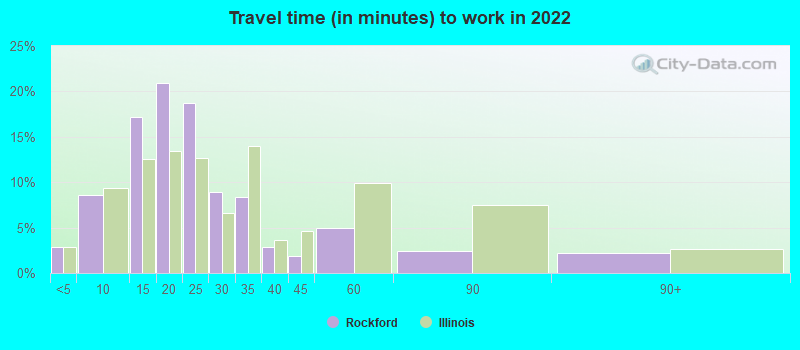
Travel time to work (commute)
Less than 5 minutes: 1,3675 to 9 minutes: 5,77010 to 14 minutes: 12,73515 to 19 minutes: 13,08120 to 24 minutes: 9,39325 to 29 minutes: 2,86630 to 34 minutes: 3,78735 to 39 minutes: 54040 to 44 minutes: 1,46745 to 59 minutes: 1,83460 to 89 minutes: 1,16890 or more minutes: 1,388
Means of transportation to work:
Drove a car alone: 65,511 (80.4%)Carpooled: 6,840 (8.4%)Bus : 382 (0.5%)Taxi: 1,486 (1.8%)Walked: 762 (0.9%)Worked at home: 6,455 (7.9%)
Unemployment by race in 2022
Unemployment rate for White non-Hispanic residents 5.7% Males3.1% FemalesUnemployment rate for Black residents 11.4% Males14.9% FemalesUnemployment rate for American Indian and Alaska Native residents 2.8% FemalesUnemployment rate for Asian residents 6.6% Males8.9% FemalesUnemployment rate for other race residents 5.0% Males8.5% FemalesUnemployment rate for two or more race residents 9.3% Males14.9% FemalesUnemployment rate for Hispanic or Latino residents 6.3% Males9.4% Females
Year of entry for the foreign-born population in Rockford, Illinois
5,273 2010 or later 4,105 2000 to 2009 3,864 1990 to 1999 2,527 1980 to 1989 1,815 1970 to 1979 1,980 Before 1970
First ancestries reported:
German: 5,761 (7.5%)
Irish: 3,379 (4.4%)
English: 3,260 (4.2%)
Italian: 3,227 (4.2%)
American: 2,791 (3.6%)
Swedish: 2,766 (3.6%)
Polish: 1,431 (1.9%)
Norwegian: 1,002 (1.3%)
European: 808 (1.0%)
Iraqi: 657 (0.9%)
Scottish: 608 (0.8%)
African: 593 (0.8%)
Nigerian: 267 (0.3%)
Egyptian: 252 (0.3%)
Scandinavian: 248 (0.3%)
Danish: 230 (0.3%)
Russian: 223 (0.3%)
Dutch: 203 (0.3%)
Greek: 196 (0.3%)
Kenyan: 187 (0.2%)
Scotch-Irish: 148 (0.2%)
Jordanian: 146 (0.2%)
Ukrainian: 141 (0.2%)
British: 140 (0.2%)
Eastern European: 138 (0.2%)
French: 129 (0.2%)
Czech: 120 (0.2%)
Croatian: 95 (0.1%)
Ethiopian: 92 (0.1%)
Yugoslavian: 86 (0.1%)
Welsh: 83 (0.1%)
Haitian: 72 (0.09%)
Lithuanian: 71 (0.09%)
Arab: 71 (0.09%)
Palestinian: 63 (0.08%)
Serbian: 55 (0.07%)
French Canadian: 52 (0.07%)
Cypriot: 42 (0.05%)
Northern European: 41 (0.05%)
South African: 36 (0.05%)
Jamaican: 36 (0.05%)
Maltese: 33 (0.04%)
Swiss: 33 (0.04%)
Barbadian: 32 (0.04%)
Moroccan: 31 (0.04%)
Hungarian: 30 (0.04%)
Pennsylvania German: 30 (0.04%)
Albanian: 29 (0.04%)
Portuguese: 29 (0.04%)
Ghanaian: 29 (0.04%)
Syrian: 24 (0.03%)
Czechoslovakian: 24 (0.03%)
Australian: 21 (0.03%)
Brazilian: 19 (0.02%)
Slovak: 18 (0.02%)
Lebanese: 17 (0.02%)
Iranian: 15 (0.02%)
Finnish: 14 (0.02%)
Slavic: 13 (0.02%)
Belgian: 10 (0.01%)
Slovene: 10 (0.01%)
Austrian: 9 (0.01%)
Bulgarian: 7 (0.01%)
Armenian: 6 (0.01%)
Alsatian: 6 (0.01%)
Turkish: 5 (0.01%)
Canadian: 5 (0.01%)
British West Indian: 5 (0.01%)
Most common places of birth for foreign-born residents (%): Mexico Rockford:
43.7% (7,766)Illinois:
34.7% (626,958)
India Rockford:
5.2% (918)Illinois:
9.2% (166,409)
Iraq Rockford:
4.0% (707)Illinois:
0.7% (13,214)
Tanzania Rockford:
3.5% (619)Illinois:
0.1% (1,833)
Philippines Rockford:
3.0% (535)Illinois:
5.2% (93,003)
Laos Rockford:
2.3% (417)Illinois:
0.2% (3,512)
China, excluding Hong Kong and Taiwan Rockford:
1.9% (331)Illinois:
4.1% (74,364)
Poland Rockford:
1.8% (317)Illinois:
6.9% (124,474)
Canada Rockford:
1.8% (315)Illinois:
1.1% (19,306)
Cuba Rockford:
1.7% (296)Illinois:
0.4% (7,171)
Place of birth for U.S.-born residents:
This state: 102,283Other state: 25,238Northeast: 1,904Midwest: 12,251South: 6,979West: 4,104 86.0% of Rockford residents lived in the same house 1 years ago.
Out of people who lived in different houses, 39.1% lived in this county.
Out of people who lived in different counties, 75.8% lived in Illinois.
Rockford:
86.0%State average:
88.3%
Education attainment for males 25 years and older:
No schooling: 881Nursery to 4th grade: 585th and 6th grade: 507th and 8th grade: 6659th grade: 1,25610th grade: 1,49311th grade: 1,70512th grade, no diploma: 1,188High school graduate (or equivalency): 14,712Less than 1 year of college: 3,342Some college more than 1 year, no degree: 6,093Associate degree: 3,288Bachelor's degree: 6,427Master's degree: 3,214Professional school degree: 1,573Doctorate degree: 560
Education attainment for females 25 years and older:
No schooling: 894Nursery to 4th grade: 3675th and 6th grade: 3847th and 8th grade: 4879th grade: 93810th grade: 1,09411th grade: 1,31412th grade, no diploma: 993High school graduate (or equivalency): 14,937Less than 1 year of college: 3,803Some college more than 1 year, no degree: 8,183Associate degree: 5,559Bachelor's degree: 7,426Master's degree: 3,342Professional school degree: 957Doctorate degree: 179
Housing units in structures:
One, detached: 42,076One, attached: 1,998Two: 5,5533 or 4: 4,0605 to 9: 3,33310 to 19: 3,11520 to 49: 1,42150 or more: 3,157Mobile homes: 491Boats, RVs, vans, etc.: 48Median worth of mobile homes: $9,999
Housing units lacking complete plumbing facilities in 2022: 2.0%Housing units lacking complete kitchen facilities in 2022: 3.0%House/condo owner moved in on average 12 years ago
Renter moved in on average 3 years ago
Private vs. public school enrollment:
Students in private schools in grades 1 to 8 (elementary and middle school): 1,955 Students in private schools in grades 9 to 12 (high school): 1,415 Students in private undergraduate colleges: 955