Rockland, MA (Massachusetts) Houses and Residents
| Rockland: | $493,918 |
| Massachusetts: | $534,700 |
Total population: 17,489 (All urban)
Houses: 6,649 (6,539 occupied: 4,773 owner occupied, 1,766 renter occupied)
| % of renters here: | 27% |
| State: | 38% |
Housing density: 663 houses/condos per square mile
Median price asked for vacant for-sale houses and condos in 2022 in this county: $446,078.
Median contract rent in 2022: $1,472 (lower quartile is $1,107, upper quartile is $1,925)
Median rent asked for vacant for-rent units in 2022: $1,572
Median gross rent in Rockland, MA in 2022: $1,636
Housing units in Rockland with a mortgage: 2,952 (306 second mortgage, 357 home equity loan, 0 both second mortgage and home equity loan)
Houses without a mortgage: 878
Compare current foreclosures in Rockland, MA:
| Photo | Address | Area | Beds / Baths | Price | Details |
|---|---|---|---|---|---|

|
#1
Sunnybank Ave
Rockland, MA 02370
|
1,023 sq. feet
|
1 baths 2 beds |
show details | |

|
#2
Woodsbury Rd
Rockland, MA 02370
|
1,176 sq. feet
|
1 baths 3 beds |
show details | |

|
#3
E Water St
Rockland, MA 02370
|
2,368 sq. feet
|
2 baths 4 beds |
show details | |

|
#4
Boxberry Ln
Rockland, MA 02370
|
1,020 sq. feet
|
1 baths 2 beds |
show details | |

|
#5
Birch Bottom Cir
Rockland, MA 02370
|
1,804 sq. feet
|
2 baths 3 beds |
show details | |

|
#6
Boxberry Ln
Rockland, MA 02370
|
1,020 sq. feet
|
1 baths 2 beds |
show details | |

|
#7
Beech St
Rockland, MA 02370
|
864 sq. feet
|
1 baths 4 beds |
show details | |

|
#8
Liberty St
Rockland, MA 02370
|
1,491 sq. feet
|
1 baths 3 beds |
show details | |

|
#9
Eleanor Ln
Rockland, MA 02370
|
1,382 sq. feet
|
1 baths 3 beds |
show details | |

|
#10
Summit St
Rockland, MA 02370
|
2,036 sq. feet
|
2 baths 3 beds |
show details |
| Photo | Address | Area | Beds / Baths | Price | Details |
|---|---|---|---|---|---|

|
#11
Willow Pond Dr
Rockland, MA 02370
|
1,660 sq. feet
|
2 baths 2 beds |
show details | |

|
#12
Eleanor Ln
Rockland, MA 02370
|
1,400 sq. feet
|
1 baths 3 beds |
show details | |

|
#13
Barstow Ln
Rockland, MA 02370
|
2,016 sq. feet
|
2 baths 4 beds |
show details | |

|
#14
Winding Way
Rockland, MA 02370
|
1,130 sq. feet
|
1 baths - beds |
show details | |

|
#15
Pond St
Rockland, MA 02370
|
960 sq. feet
|
1 baths - beds |
show details | |

|
#16
North Ave
Rockland, MA 02370
|
957 sq. feet
|
1 baths - beds |
show details | |

|
#17
North Ave
Rockland, MA 02370
|
957 sq. feet
|
1 baths - beds |
show details | |

|
#18
Myrtle St # 1
Rockland, MA 02370
|
2,080 sq. feet
|
2 baths - beds |
show details | |

|
#19
Concord St
Rockland, MA 02370
|
1,148 sq. feet
|
1 baths - beds |
show details | |

|
#20
Durbeck Rd
Rockland, MA 02370
|
864 sq. feet
|
1 baths - beds |
show details |
| Photo | Address | Area | Beds / Baths | Price | Details |
|---|---|---|---|---|---|

|
#21
Reed St
Rockland, MA 02370
|
1,855 sq. feet
|
1 baths - beds |
show details | |

|
#22
Pond St
Rockland, MA 02370
|
1,260 sq. feet
|
1 baths - beds |
show details | |

|
#23
Market St
Rockland, MA 02370
|
1,306 sq. feet
|
2 baths - beds |
show details | |

|
#24
Gardner St
Rockland, MA 02370
|
1,719 sq. feet
|
1 baths - beds |
show details | |

|
#25
Centre Ave
Rockland, MA 02370
|
4,224 sq. feet
|
4 baths - beds |
show details | |

|
#26
Old Market St
Rockland, MA 02370
|
1,628 sq. feet
|
1 baths - beds |
show details | |

|
#27
Liberty St
Rockland, MA 02370
|
2,446 sq. feet
|
3 baths - beds |
show details | |

|
#28
Arlington St # A
Rockland, MA 02370
|
3,141 sq. feet
|
4 baths - beds |
show details | |

|
#29
Weymouth St
Rockland, MA 02370
|
- sq. feet
|
- baths - beds |
show details | |

|
#30
North Ave
Rockland, MA 02370
|
- sq. feet
|
- baths - beds |
show details |
| Photo | Address | Area | Beds / Baths | Price | Details |
|---|---|---|---|---|---|

|
#31
Linwood Ter
Rockland, MA 02370
|
- sq. feet
|
- baths - beds |
show details | |

|
#32
Saw Mill Ln
Rockland, MA 02370
|
- sq. feet
|
- baths - beds |
show details | |

|
#33
Hemlock St
Rockland, MA 02370
|
- sq. feet
|
- baths - beds |
show details | |

|
Check over 1 million property listings on Foreclosure.com!
|
browse all offers | |||
Latest news about housing in Rockland, MA collected exclusively by city-data.com from local newspapers, TV, and radio stations

 | How Much Massachusetts Households Make Per Year: Census Data (37 replies) |
| $250K Houses With the Closest Proximity to Boston That Are Also Safe? (65 replies) |
| 2023 Real Estate Observations (5278 replies) |
| 2021 Real Estate Observations (1729 replies) |
| 2020 Real Estate Observations (623 replies) |
| "Migrants" living in hotels in MA---What is the endgame or is there one at all? (1050 replies) |

Household type by relationship:
Households: 483,098- In family households: 417,329 (86,307 male householders, 41,618 female householders)
97,089 spouses, 154,870 children (146,729 natural, 3,391 adopted, 4,750 stepchildren), 8,780 grandchildren, 4,455 brothers or sisters, 5,200 parents, foster children, 5,123 other relatives, 10,196 non-relatives
- In nonfamily households: 65,769 (22,929 male householders (17,306 living alone)), 30,272 female householders (25,724 living alone)), 12,568 nonrelatives
- In group quarters: 11,821 (7,645 institutionalized population)
92,167 married couples with children.
24,193 single-parent households (4,628 men, 19,565 women).
94.9% of residents of Rockland speak English at home.
0.7% of residents speak Spanish at home (83% speak English very well, 17% speak English not well).
3.7% of residents speak other Indo-European language at home (65% speak English very well, 21% speak English well, 13% speak English not well, 1% don't speak English at all).
0.6% of residents speak other language at home (88% speak English very well, 12% speak English well).
Foreign born population: 855 (4.3%)
(50.6% of them are naturalized citizens)
| Here: | 6.8 |
| State: | 6.5 |
| Here: | 4.0 |
| State: | 4.0 |

- Bedrooms in owner-occupied houses and condos in Rockland, Massachusetts
- 9no bedroom
- 1461 bedroom
- 1,1312 bedrooms
- 2,5073 bedrooms
- 7834 bedrooms
- 1975+ bedrooms

- Bedrooms in renter-occupied apartments in Rockland, Massachusetts
- 56no bedroom
- 6051 bedroom
- 6992 bedrooms
- 3253 bedrooms
- 684 bedrooms
- 135+ bedrooms

- Cars and other vehicles available in Rockland in owner-occupied houses/condos
- 167no vehicle
- 1,4381 vehicle
- 2,3662 vehicles
- 5303 vehicles
- 1464 vehicles
- 1265+ vehicles

- Cars and other vehicles available in Rockland in renter-occupied apartments
- 227no vehicle
- 9401 vehicle
- 5002 vehicles
- 583 vehicles
- 244 vehicles
- 175+ vehicles

- Rooms in owner-occupied houses in Rockland, Massachusetts
- 91 room
- 02 rooms
- 793 rooms
- 2464 rooms
- 1,0355 rooms
- 1,3426 rooms
- 1,0327 rooms
- 5988 rooms
- 4329+ rooms

- Rooms in renter-occupied apartments in Rockland, Massachusetts
- 481 room
- 1812 rooms
- 4033 rooms
- 5574 rooms
- 3345 rooms
- 1616 rooms
- 257 rooms
- 278 rooms
- 309+ rooms


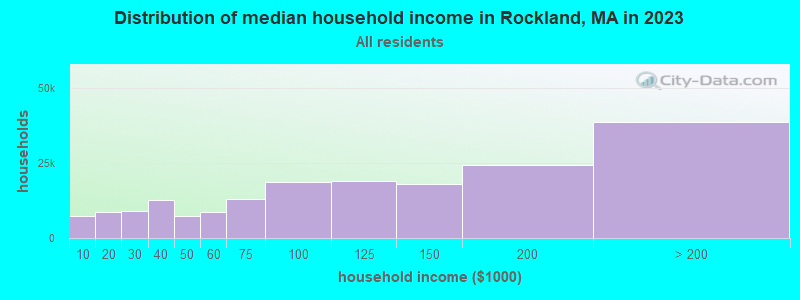
Rockland, MA household income distribution

- 7,520Less than $10,000
- 8,453$10,000 to $19,999
- 9,122$20,000 to $29,999
- 11,210$30,000 to $39,999
- 8,895$40,000 to $49,999
- 10,077$50,000 to $59,999
- 13,295$60,000 to $74,999
- 22,127$75,000 to $99,999
- 18,482$100,000 to $124,999
- 17,147$125,000 to $149,999
- 24,374$150,000 to $199,999
- 36,057$200,000 or more
Percentage of workers working in this county: 61.1%
Number of people working at home: 1,835 (17.0% of all workers)
Travel time to work (commute)
- Less than 5 minutes: 254
- 5 to 9 minutes: 971
- 10 to 14 minutes: 1,263
- 15 to 19 minutes: 1,373
- 20 to 24 minutes: 955
- 25 to 29 minutes: 473
- 30 to 34 minutes: 1,001
- 35 to 39 minutes: 391
- 40 to 44 minutes: 381
- 45 to 59 minutes: 776
- 60 to 89 minutes: 885
- 90 or more minutes: 354
Means of transportation to work:
- Drove a car alone: 7,775 (83.8%)
- Carpooled: 859 (9.3%)
- Bus or trolley bus: 23 (0.2%)
- Subway or elevated: 101 (1.1%)
- Railroad: 137 (1.5%)
- Ferryboat: 14 (0.2%)
- Motorcycle: 7 (0.1%)
- Bicycle: 4 (0.0%)
- Walked: 127 (1.4%)
- Other means: 30 (0.3%)
- Worked at home: 197 (2.1%)

- Year of entry for the foreign-born population in Rockland, Massachusetts
- 1011995 to March 2000
- 401990 to 1994
- 341985 to 1989
- 411980 to 1984
- 281975 to 1979
- 241970 to 1974
- 71965 to 1969
- 151Before 1965

First ancestries reported:
- Irish: 6,525 (32.1%)
- Italian: 2,824 (13.9%)
- English: 2,663 (13.1%)
- Other: 1,539 (7.6%)
- French: 1,129 (5.6%)
- United States: 1,042 (5.1%)
- German: 838 (4.1%)
- French Canadian: 739 (3.6%)
- Scottish: 631 (3.1%)
- Polish: 431 (2.1%)
- Scotch-Irish: 409 (2.0%)
- Swedish: 344 (1.7%)
- Portuguese: 318 (1.6%)
- Greek: 178 (0.9%)
- Lithuanian: 162 (0.8%)
- Subsaharan African: 119 (0.6%)
- Dutch: 99 (0.5%)
- Norwegian: 64 (0.3%)
- Welsh: 60 (0.3%)
- West Indian: 59 (0.3%)
- Russian: 52 (0.3%)
- Arab: 30 (0.1%)
- Swiss: 13 (0.06%)
- Ukrainian: 13 (0.06%)
- Czech: 11 (0.05%)
- Hungarian: 7 (0.03%)
Most common places of birth for foreign-born residents (%):
| Rockland: | 20.4% (87) |
| Massachusetts: | 4.7% (36,669) |
| Rockland: | 14.8% (63) |
| Massachusetts: | 5.2% (40,247) |
| Rockland: | 13.6% (58) |
| Massachusetts: | 2.3% (17,987) |
| Rockland: | 9.9% (42) |
| Massachusetts: | 2.6% (20,299) |
| Rockland: | 9.4% (40) |
| Massachusetts: | 1.9% (14,883) |
| Rockland: | 7.7% (33) |
| Massachusetts: | 3.3% (25,403) |
| Rockland: | 6.3% (27) |
| Massachusetts: | 4.4% (33,862) |
| Rockland: | 5.6% (24) |
| Massachusetts: | 3.7% (28,319) |
| Rockland: | 5.6% (24) |
| Massachusetts: | 1.6% (12,350) |
| Rockland: | 3.1% (13) |
| Massachusetts: | 1.7% (12,975) |
| Rockland: | 1.9% (8) |
| Massachusetts: | 0.5% (3,868) |
| Rockland: | 1.6% (7) |
| Massachusetts: | 0.4% (3,051) |
Place of birth for U.S.-born residents:
- This state: 15,506
- Other state: 1,623
- Northeast: 808
- Midwest: 228
- South: 447
- West: 140
67% of Rockland residents lived in the same house 5 years ago.
Out of people who lived in different houses, 55% lived in this county.
Out of people who lived in different counties, 86% lived in Massachusetts.
Education attainment for males 25 years and older:
- No schooling: 19
- Nursery to 4th grade: 0
- 5th and 6th grade: 23
- 7th and 8th grade: 35
- 9th grade: 114
- 10th grade: 205
- 11th grade: 99
- 12th grade, no diploma: 207
- High school graduate (or equivalency): 2,121
- Less than 1 year of college: 321
- Some college more than 1 year, no degree: 745
- Associate degree: 447
- Bachelor's degree: 803
- Master's degree: 200
- Professional school degree: 35
- Doctorate degree: 7

Education attainment for females 25 years and older:
- No schooling: 0
- Nursery to 4th grade: 0
- 5th and 6th grade: 0
- 7th and 8th grade: 78
- 9th grade: 52
- 10th grade: 216
- 11th grade: 99
- 12th grade, no diploma: 205
- High school graduate (or equivalency): 2,431
- Less than 1 year of college: 626
- Some college more than 1 year, no degree: 743
- Associate degree: 877
- Bachelor's degree: 793
- Master's degree: 197
- Professional school degree: 84
- Doctorate degree: 31


Housing units in structures:
- One, detached: 3,774
- One, attached: 466
- Two: 529
- 3 or 4: 452
- 5 to 9: 485
- 10 to 19: 145
- 20 to 49: 279
- 50 or more: 42
- Mobile homes: 477
Median worth of mobile homes: $289,460
Housing units lacking complete kitchen facilities: 0.1%

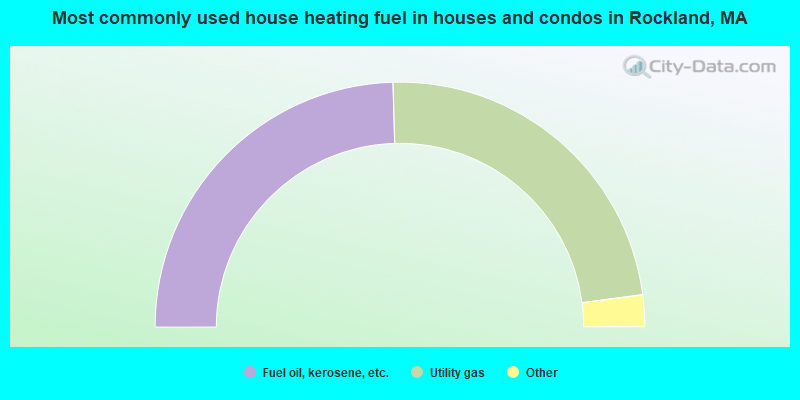
- 49.1%Fuel oil, kerosene, etc.
- 46.7%Utility gas
- 3.1%Electricity
- 1.1%Bottled, tank, or LP gas
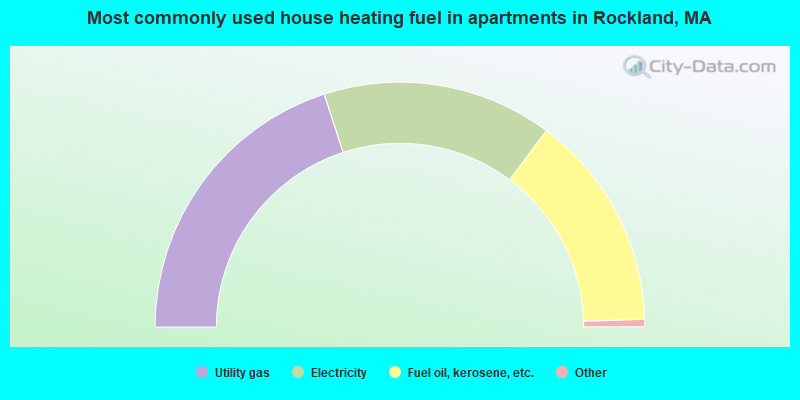
- 40.0%Utility gas
- 30.4%Electricity
- 28.6%Fuel oil, kerosene, etc.
- 0.6%Other fuel
- 0.4%Bottled, tank, or LP gas
Private vs. public school enrollment:
| Here: | 13.1% |
| Massachusetts: | 10.8% |
| Here: | 10.8% |
| Massachusetts: | 12.2% |
| Here: | 44.0% |
| Massachusetts: | 48.2% |


