Rocklin, CA (California) Houses and Residents
| Rocklin: | $707,000 |
| California: | $715,900 |
Mean price in 2022:
Detached houses: $673,424
Here: $673,424 State: $988,808 Townhouses or other attached units: $313,635
Here: $313,635 State: $838,546 In 3-to-4-unit structures: $887,027
Here: $887,027 State: $824,253 In 5-or-more-unit structures: $229,980
Here: $229,980 State: $730,996 Mobile homes: $51,549
Here: $51,549 State: $184,506
Total population: 60,344 (Urban population: 36,244, Rural population: 319 (all nonfarm))
Houses: 26,325 (26,018 occupied: 17,310 owner occupied, 8,708 renter occupied)
| % of renters here: | 33% |
| State: | 44% |
Housing density: 1,628 houses/condos per square mile
Median price asked for vacant for-sale houses and condos in 2022: $461,050.
Median contract rent in 2022: $1,895 (lower quartile is $1,493, upper quartile is over $2,000)
Median rent asked for vacant for-rent units in 2022: $3,692
Median gross rent in Rocklin, CA in 2022: over $2,000
Housing units in Rocklin with a mortgage: 12,697 (2,253 second mortgage, 0 home equity loan, 2,014 both second mortgage and home equity loan)
Houses without a mortgage: 539
Median household income for houses/condos with a mortgage: $165,770
Median household income for apartments without a mortgage: $110,843
Median monthly housing costs: $2,191
Compare current foreclosures in Rocklin, CA:
| Photo | Address | Area | Beds / Baths | Price | Details |
|---|---|---|---|---|---|

|
#1
Midas Ave
Rocklin, CA 95677
|
2,519 sq. feet
|
2 baths 3 beds |
show details | |

|
#2
Talon Rd
Rocklin, CA 95765
|
1,806 sq. feet
|
2 baths 4 beds |
show details | |

|
#3
Miners Cir
Rocklin, CA 95765
|
1,578 sq. feet
|
2 baths 3 beds |
show details | |

|
#4
Whitney Ranch Pkwy Unit 1233
Rocklin, CA 95765
|
1,050 sq. feet
|
2 baths 3 beds |
show details | |

|
#5
Sasparilla Ct
Rocklin, CA 95765
|
1,420 sq. feet
|
2 baths 2 beds |
show details | |

|
#6
Argonaut Ave
Rocklin, CA 95677
|
1,409 sq. feet
|
2 baths 4 beds |
show details | |

|
#7
Parker St
Rocklin, CA 95765
|
1,793 sq. feet
|
2 baths 4 beds |
show details | |

|
#8
Sceptre Dr
Rocklin, CA 95765
|
2,662 sq. feet
|
3 baths 4 beds |
show details | |

|
#9
Hearthstone Cir Apt 1524
Rocklin, CA 95677
|
1,105 sq. feet
|
2 baths 2 beds |
show details | |

|
#10
Montclair Dr
Rocklin, CA 95677
|
2,480 sq. feet
|
3 baths 4 beds |
show details |
| Photo | Address | Area | Beds / Baths | Price | Details |
|---|---|---|---|---|---|

|
#11
Springview Meadows Dr
Rocklin, CA 95677
|
1,319 sq. feet
|
2 baths 3 beds |
show details | |

|
#12
Balfor Ct
Rocklin, CA 95765
|
2,409 sq. feet
|
3 baths 4 beds |
show details | |

|
#13
Silver Star Ct
Rocklin, CA 95765
|
1,635 sq. feet
|
2 baths 2 beds |
show details | |

|
#14
Harvest Rd
Rocklin, CA 95765
|
2,042 sq. feet
|
2 baths 4 beds |
show details | |

|
#15
Woodside Dr
Rocklin, CA 95677
|
1,080 sq. feet
|
1 baths 2 beds |
show details | |

|
#16
Whitney Ranch Pkw 914
Rocklin, CA 95765
|
898 sq. feet
|
2 baths 2 beds |
show details | |

|
#17
Butte View Ct
Rocklin, CA 95765
|
1,626 sq. feet
|
2 baths 3 beds |
show details | |

|
#18
Sonora Pass Way
Rocklin, CA 95765
|
1,650 sq. feet
|
2 baths 3 beds |
show details | |

|
#19
Inyo Ct
Rocklin, CA 95677
|
1,288 sq. feet
|
2 baths 3 beds |
show details | |

|
#20
Lonetree Blvd
Rocklin, CA 95765
|
1,847 sq. feet
|
2 baths 3 beds |
show details |
| Photo | Address | Area | Beds / Baths | Price | Details |
|---|---|---|---|---|---|

|
#21
Turnstone Way
Rocklin, CA 95765
|
2,326 sq. feet
|
3 baths 4 beds |
show details | |

|
#22
Daffodil Cir
Rocklin, CA 95677
|
1,800 sq. feet
|
2 baths 4 beds |
show details | |

|
#23
Longview Dr
Rocklin, CA 95677
|
3,030 sq. feet
|
3 baths 4 beds |
show details | |

|
#24
Parker St
Rocklin, CA 95765
|
1,417 sq. feet
|
2 baths 3 beds |
show details | |

|
#25
Summit Dr
Rocklin, CA 95765
|
2,113 sq. feet
|
2 baths 4 beds |
show details | |

|
#26
Fox Hill Dr
Rocklin, CA 95765
|
2,602 sq. feet
|
3 baths 4 beds |
show details | |

|
#27
Archer Cir
Rocklin, CA 95765
|
2,187 sq. feet
|
3 baths 4 beds |
show details | |

|
#28
Sasparilla Ct
Rocklin, CA 95765
|
1,650 sq. feet
|
2 baths 3 beds |
show details | |

|
#29
Spotted Pony Ln
Rocklin, CA 95765
|
3,298 sq. feet
|
3 baths 4 beds |
show details | |

|
#30
Cook St
Rocklin, CA 95765
|
2,113 sq. feet
|
2 baths 4 beds |
show details |
| Photo | Address | Area | Beds / Baths | Price | Details |
|---|---|---|---|---|---|

|
#31
Placer West Dr
Rocklin, CA 95677
|
- sq. feet
|
- baths - beds |
show details | |

|
#32
Larkspur Dr
Rocklin, CA 95765
|
- sq. feet
|
- baths - beds |
show details | |

|
#33
Sporran Ct
Rocklin, CA 95765
|
- sq. feet
|
- baths - beds |
show details | |

|
#34
Springview Dr Apt 15
Rocklin, CA 95677
|
- sq. feet
|
- baths - beds |
show details | |

|
#35
Parkside Dr Apt 45
Rocklin, CA 95677
|
- sq. feet
|
- baths - beds |
show details | |

|
#36
Pier Pl
Rocklin, CA 95765
|
- sq. feet
|
- baths - beds |
show details | |

|
#37
Wilderness Way
Rocklin, CA 95765
|
- sq. feet
|
- baths - beds |
show details | |

|
#38
Holden Dr
Rocklin, CA 95677
|
- sq. feet
|
- baths - beds |
show details | |

|
#39
Meridian Way # 227
Rocklin, CA 95765
|
- sq. feet
|
- baths - beds |
show details | |

|
#40
Silver Spur Ct
Rocklin, CA 95765
|
- sq. feet
|
- baths - beds |
show details |
| Photo | Address | Area | Beds / Baths | Price | Details |
|---|---|---|---|---|---|

|
#41
University Ave Apt 613
Rocklin, CA 95765
|
- sq. feet
|
- baths - beds |
show details | |

|
#42
Hearthstone Cir
Rocklin, CA 95677
|
- sq. feet
|
- baths - beds |
show details | |

|
#43
Vine Cir
Rocklin, CA 95765
|
- sq. feet
|
- baths - beds |
show details | |

|
#44
Castlewood St
Rocklin, CA 95677
|
- sq. feet
|
- baths - beds |
show details | |

|
#45
Meridian Way
Rocklin, CA 95765
|
- sq. feet
|
- baths - beds |
show details | |

|
#46
Sunset Blvd # 1004
Rocklin, CA 95765
|
- sq. feet
|
- baths - beds |
show details | |

|
#47
Shannon Bay Dr Apt 228
Rocklin, CA 95677
|
- sq. feet
|
- baths - beds |
show details | |

|
#48
Blue Oaks Blvd Apt 2107
Rocklin, CA 95765
|
- sq. feet
|
- baths - beds |
show details | |

|
#49
Ridge View Cir
Rocklin, CA 95677
|
- sq. feet
|
- baths - beds |
show details | |

|
Check over 1 million property listings on Foreclosure.com!
|
browse all offers | |||

Latest news about housing in Rocklin, CA collected exclusively by city-data.com from local newspapers, TV, and radio stations


Median year apartment built: 1996
Household type by relationship:
Households: 73,850- Male householders: 14,039 (2,024 living alone), Female householders: 11,979 (2,763 living alone)
15,708 spouses (15,550 opposite-sex spouses), 1,732 unmarried partners, (1,616 opposite-sex unmarried partners), 23,156 children (21,863 natural, 770 adopted, 523 stepchildren), 1,223 grandchildren, 523 brothers or sisters, 932 parents, 0 foster children, 1,754 other relatives, 1,643 non-relatives
- In group quarters: 1,161
Size of family households: 6,625 2-persons, 4,639 3-persons, 5,526 4-persons, 1,279 5-persons, 981 6-persons, 274 7-or-more-persons.
Size of nonfamily households: 4,787 1-person, 1,772 2-persons, 135 3-persons.
14,333 married couples with children.
2,399 single-parent households (614 men, 1,785 women).
84.0% of residents of Rocklin speak English at home.
4.3% of residents speak Spanish at home (68% speak English very well, 25% speak English well, 5% speak English not well, 2% don't speak English at all).
5.8% of residents speak other Indo-European language at home (70% speak English very well, 23% speak English well, 5% speak English not well, 2% don't speak English at all).
5.3% of residents speak Asian or Pacific Island language at home (62% speak English very well, 22% speak English well, 12% speak English not well, 4% don't speak English at all).
1.3% of residents speak other language at home (81% speak English very well, 14% speak English well, 5% speak English not well).
Foreign born population: 11,760 (15.9%)
(43.1% of them are naturalized citizens)
| Here: | 7.0 |
| State: | 6.0 |
| Here: | 4.3 |
| State: | 3.9 |

- Bedrooms in owner-occupied houses and condos in Rocklin, California
- 190no bedroom
- 981 bedroom
- 1,2162 bedrooms
- 6,4253 bedrooms
- 7,3204 bedrooms
- 2,0615+ bedrooms

- Bedrooms in renter-occupied apartments in Rocklin, California
- 177no bedroom
- 1,6301 bedroom
- 3,1082 bedrooms
- 2,2003 bedrooms
- 1,4834 bedrooms
- 1105+ bedrooms

- Cars and other vehicles available in Rocklin in owner-occupied houses/condos
- 502no vehicle
- 3,1471 vehicle
- 7,9272 vehicles
- 4,3453 vehicles
- 1,1414 vehicles
- 2485+ vehicles

- Cars and other vehicles available in Rocklin in renter-occupied apartments
- 529no vehicle
- 3,1501 vehicle
- 3,5802 vehicles
- 1,1483 vehicles
- 3014 vehicles
- 05+ vehicles

- Rooms in owner-occupied houses in Rocklin, California
- 1901 room
- 552 rooms
- 6783 rooms
- 7584 rooms
- 1,8785 rooms
- 3,0476 rooms
- 4,2977 rooms
- 3,3968 rooms
- 3,0119+ rooms

- Rooms in renter-occupied apartments in Rocklin, California
- 1771 room
- 7932 rooms
- 1,5803 rooms
- 2,2514 rooms
- 1,3715 rooms
- 1,5016 rooms
- 6157 rooms
- 868 rooms
- 3349+ rooms


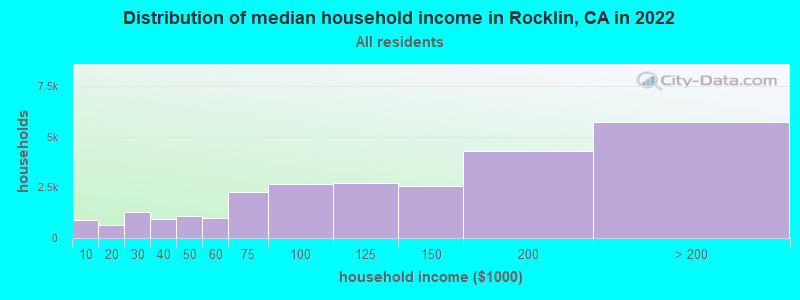
Rocklin, CA household income distribution

- 897Less than $10,000
- 638$10,000 to $19,999
- 1,301$20,000 to $29,999
- 918$30,000 to $39,999
- 1,080$40,000 to $49,999
- 984$50,000 to $59,999
- 2,292$60,000 to $74,999
- 2,652$75,000 to $99,999
- 2,691$100,000 to $124,999
- 2,555$125,000 to $149,999
- 4,286$150,000 to $199,999
- 5,724$200,000 or more
Home value of owner - occupied houses in 2022 in Rocklin, CA
-
- 156Less than $10,000
- 9$10,000 to $14,999
- 10$15,000 to $19,999
- 28$20,000 to $24,999
- 5$25,000 to $29,999
- 33$30,000 to $34,999
- 7$35,000 to $39,999
- 33$40,000 to $49,999
- 97$50,000 to $59,999
- 69$60,000 to $69,999
- 23$70,000 to $79,999
- 37$80,000 to $89,999
- 24$90,000 to $99,999
- 132$100,000 to $124,999
- 30$125,000 to $149,999
- 62$150,000 to $174,999
- 38$175,000 to $199,999
- 114$200,000 to $249,999
- 47$250,000 to $299,999
- 501$300,000 to $399,999
- 1,318$400,000 to $499,999
- 8,387$500,000 to $749,999
- 4,463$750,000 to $999,999
- 1,499$1,000,000 to $1,499,999
- 165$1,500,000 to $1,999,999
- 151$2,000,000 or more

Rent paid by renters in 2022 in Rocklin, CA
-
- 64Less than $100
- 119$200 to $249
- 124$250 to $299
- 46$300 to $349
- 40$350 to $399
- 80$400 to $449
- 65$500 to $549
- 9$600 to $649
- 112$750 to $799
- 36$800 to $899
- 386$900 to $999
- 545$1,000 to $1,249
- 605$1,250 to $1,499
- 2,273$1,500 to $1,999
- 2,239$2,000 to $2,499
- 703$2,500 to $2,999
- 647$3,000 to $3,499
- 335$3,500 or more
- 124No cash rent


Percentage of workers working in this county: 76.8%
Number of people working at home: 8,421 (23.7% of all workers)
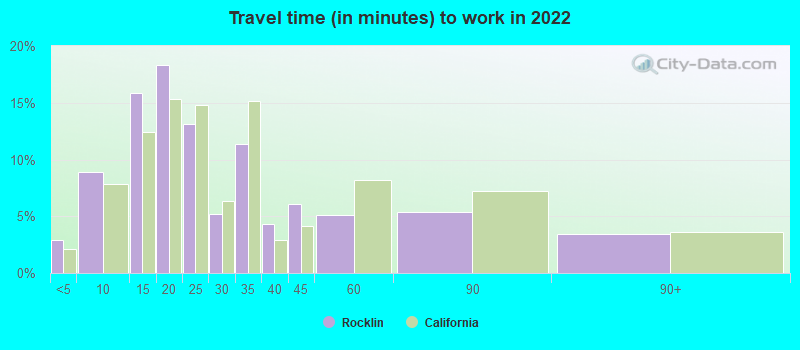
Travel time to work (commute)
- Less than 5 minutes: 826
- 5 to 9 minutes: 2,619
- 10 to 14 minutes: 5,051
- 15 to 19 minutes: 4,937
- 20 to 24 minutes: 3,714
- 25 to 29 minutes: 1,395
- 30 to 34 minutes: 3,628
- 35 to 39 minutes: 1,358
- 40 to 44 minutes: 564
- 45 to 59 minutes: 1,134
- 60 to 89 minutes: 367
- 90 or more minutes: 1,440
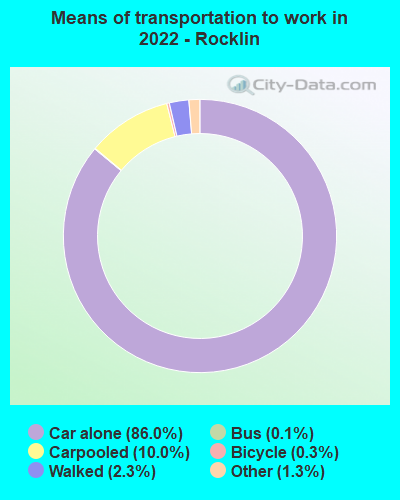
Means of transportation to work:
- Drove a car alone: 19,861 (61.8%)
- Carpooled: 2,863 (8.9%)
- Bus: 24 (0.1%)
- Taxi: 402 (1.3%)
- Bicycle: 52 (0.2%)
- Walked: 957 (3.0%)
- Worked at home: 8,421 (26.2%)

- Unemployment by race in 2022
- Unemployment rate for White non-Hispanic residents
- 5.5%Males
- 4.3%Females
- Unemployment rate for Black residents
- 2.0%Males
- 3.3%Females
- Unemployment rate for Asian residents
- 3.4%Males
- 4.1%Females
- Unemployment rate for other race residents
- 13.2%Males
- 0.8%Females
- Unemployment rate for two or more race residents
- 3.2%Males
- 4.9%Females
- Unemployment rate for Hispanic or Latino residents
- 2.5%Males
- 4.0%Females

- Year of entry for the foreign-born population in Rocklin, California
- 4,1012010 or later
- 2,0902000 to 2009
- 1,4151990 to 1999
- 3571980 to 1989
- 3661970 to 1979
- 513Before 1970

First ancestries reported:
- English: 3,067 (9.8%)
- German: 2,029 (6.5%)
- Italian: 1,835 (5.9%)
- Irish: 1,478 (4.7%)
- American: 1,360 (4.3%)
- European: 1,301 (4.2%)
- Russian: 478 (1.5%)
- Romanian: 477 (1.5%)
- Norwegian: 430 (1.4%)
- Ukrainian: 336 (1.1%)
- Iranian: 314 (1.0%)
- Scottish: 311 (1.0%)
- Scotch-Irish: 307 (1.0%)
- Arab: 286 (0.9%)
- Portuguese: 233 (0.7%)
- Dutch: 204 (0.7%)
- Swedish: 200 (0.6%)
- Polish: 179 (0.6%)
- Slavic: 160 (0.5%)
- Northern European: 122 (0.4%)
- Palestinian: 119 (0.4%)
- Danish: 115 (0.4%)
- French: 110 (0.4%)
- Belizean: 108 (0.3%)
- Czech: 106 (0.3%)
- Jamaican: 96 (0.3%)
- Afghan: 89 (0.3%)
- Austrian: 86 (0.3%)
- British: 79 (0.3%)
- Armenian: 76 (0.2%)
- Egyptian: 67 (0.2%)
- Serbian: 62 (0.2%)
- Scandinavian: 61 (0.2%)
- Swiss: 54 (0.2%)
- Hungarian: 50 (0.2%)
- Yugoslavian: 44 (0.1%)
- Croatian: 42 (0.1%)
- Finnish: 41 (0.1%)
- Turkish: 40 (0.1%)
- Welsh: 39 (0.1%)
- Canadian: 38 (0.1%)
- Israeli: 33 (0.1%)
- Brazilian: 25 (0.08%)
- African: 24 (0.08%)
- Eastern European: 21 (0.07%)
- Latvian: 20 (0.06%)
- French Canadian: 20 (0.06%)
- Greek: 18 (0.06%)
- Haitian: 16 (0.05%)
- Ethiopian: 11 (0.04%)
- Syrian: 9 (0.03%)
- Slovak: 8 (0.03%)
- Australian: 6 (0.02%)
- Slovene: 6 (0.02%)
- Belgian: 6 (0.02%)
- Pennsylvania German: 5 (0.02%)
Most common places of birth for foreign-born residents (%):
| Rocklin: | 12.6% (1,176) |
| California: | 5.2% (539,184) |
| Rocklin: | 11.8% (1,105) |
| California: | 7.8% (818,297) |
| Rocklin: | 10.7% (999) |
| California: | 6.6% (684,672) |
| Rocklin: | 8.5% (791) |
| California: | 37.2% (3,881,193) |
| Rocklin: | 4.2% (397) |
| California: | 0.6% (60,761) |
| Rocklin: | 3.4% (314) |
| California: | 3.0% (315,248) |
| Rocklin: | 3.2% (300) |
| California: | 2.0% (206,004) |
| Rocklin: | 2.9% (270) |
| California: | 1.2% (127,477) |
| Rocklin: | 2.5% (236) |
| California: | 0.1% (10,171) |
| Rocklin: | 2.4% (226) |
| California: | 0.2% (23,058) |
| Rocklin: | 2.4% (222) |
| California: | 0.7% (74,025) |
| Rocklin: | 2.2% (208) |
| California: | 1.0% (103,575) |
| Rocklin: | 2.2% (204) |
| California: | 1.0% (105,215) |
| Rocklin: | 2.1% (200) |
| California: | 0.1% (6,648) |
| Rocklin: | 1.8% (173) |
| California: | 0.7% (71,932) |
| Rocklin: | 1.5% (144) |
| California: | 0.6% (57,953) |
| Rocklin: | 1.5% (143) |
| California: | 4.9% (512,335) |
Place of birth for U.S.-born residents:
- This state: 45,809
- Other state: 15,519
- Northeast: 2,830
- Midwest: 5,021
- South: 3,108
- West: 4,560
84.3% of Rocklin residents lived in the same house 1 years ago.
Out of people who lived in different houses, 32.9% lived in this county.
Out of people who lived in different counties, 88.3% lived in California.
| Rocklin: | 84.3% |
| State average: | 88.9% |
Education attainment for males 25 years and older:
- No schooling: 345
- Nursery to 4th grade: 86
- 5th and 6th grade: 0
- 7th and 8th grade: 0
- 9th grade: 0
- 10th grade: 117
- 11th grade: 280
- 12th grade, no diploma: 303
- High school graduate (or equivalency): 3,564
- Less than 1 year of college: 1,772
- Some college more than 1 year, no degree: 2,972
- Associate degree: 2,564
- Bachelor's degree: 8,344
- Master's degree: 2,156
- Professional school degree: 1,006
- Doctorate degree: 768

Education attainment for females 25 years and older:
- No schooling: 73
- Nursery to 4th grade: 126
- 5th and 6th grade: 33
- 7th and 8th grade: 0
- 9th grade: 65
- 10th grade: 12
- 11th grade: 48
- 12th grade, no diploma: 579
- High school graduate (or equivalency): 4,530
- Less than 1 year of college: 2,070
- Some college more than 1 year, no degree: 3,289
- Associate degree: 4,020
- Bachelor's degree: 6,920
- Master's degree: 2,861
- Professional school degree: 903
- Doctorate degree: 301


Housing units in structures:
- One, detached: 18,385
- One, attached: 1,924
- Two: 248
- 3 or 4: 1,089
- 5 to 9: 1,239
- 10 to 19: 908
- 20 to 49: 516
- 50 or more: 1,892
- Mobile homes: 124
Median worth of mobile homes: $102,259
Housing units lacking complete kitchen facilities in 2022: 1.8%
House/condo owner moved in on average 8 years ago
Renter moved in on average 2 years ago

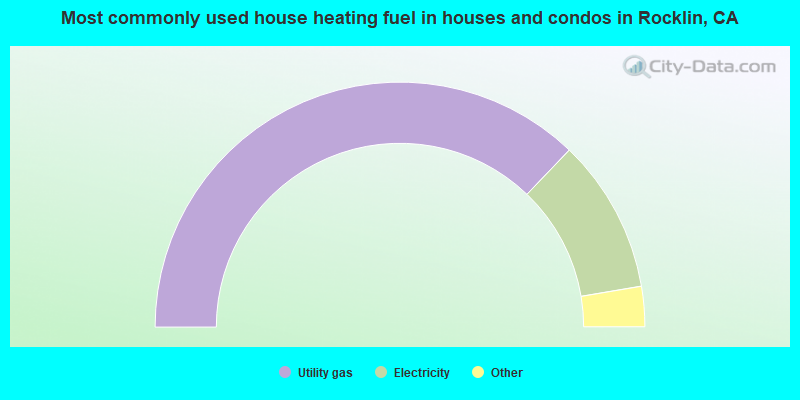
- 74.3%Utility gas
- 20.4%Electricity
- 2.6%Solar energy
- 1.5%Bottled, tank, or LP gas
- 0.7%Wood
- 0.3%No fuel used
- 0.1%Other fuel
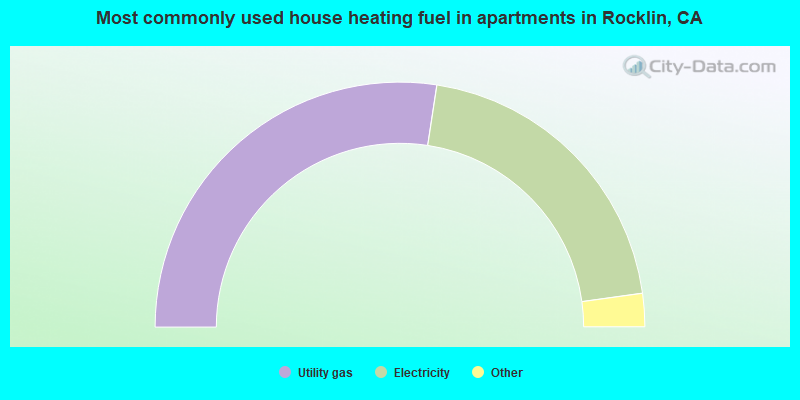
- 54.9%Utility gas
- 40.8%Electricity
- 2.9%Bottled, tank, or LP gas
- 0.6%Other fuel
- 0.4%No fuel used
- 0.4%Solar energy
Private vs. public school enrollment:
| Here: | 12.7% |
| California: | 10.5% |
| Here: | 1.4% |
| California: | 8.5% |
| Here: | 10.8% |
| California: | 15.9% |


