Rohnert Park, CA (California) Houses and Residents
| Rohnert Park: | $638,843 |
| California: | $715,900 |
Mean price in 2022:
Detached houses: $776,585
Here: $776,585 State: $988,808 Townhouses or other attached units: $490,424
Here: $490,424 State: $838,546 In 2-unit structures: $452,558
Here: $452,558 State: $1,138,100 In 3-to-4-unit structures: $379,603
Here: $379,603 State: $824,253 In 5-or-more-unit structures: $415,596
Here: $415,596 State: $730,996 Mobile homes: $158,089
Here: $158,089 State: $184,506
Total population: 42,262 (All urban)
Houses: 17,864 (17,231 occupied: 8,773 owner occupied, 8,657 renter occupied)
| % of renters here: | 50% |
| State: | 44% |
Housing density: 2,777 houses/condos per square mile
Median price asked for vacant for-sale houses and condos in 2022: $494,753.
Median contract rent in 2022: $1,896 (lower quartile is $1,469, upper quartile is over $2,000)
Median rent asked for vacant for-rent units in 2022: $2,543
Median gross rent in Rohnert Park, CA in 2022: over $2,000
Housing units in Rohnert Park with a mortgage: 5,761 (485 second mortgage, 12 home equity loan, 383 both second mortgage and home equity loan)
Houses without a mortgage: 46
Median household income for houses/condos with a mortgage: $131,390
Median household income for apartments without a mortgage: $76,641
Median monthly housing costs: $1,989
Compare current foreclosures in Rohnert Park, CA:
| Photo | Address | Area | Beds / Baths | Price | Details |
|---|---|---|---|---|---|

|
#1
Lancaster Dr
Rohnert Park, CA 94928
|
1,408 sq. feet
|
2 baths 3 beds |
show details | |

|
#2
Hermitage Way
Rohnert Park, CA 94928
|
2,195 sq. feet
|
2 baths 4 beds |
show details | |

|
#3
Lisbon Ct
Rohnert Park, CA 94928
|
1,160 sq. feet
|
2 baths 3 beds |
show details | |

|
#4
Hermitage Way
Rohnert Park, CA 94928
|
2,059 sq. feet
|
2 baths 3 beds |
show details | |

|
#5
Blair Ave
Rohnert Park, CA 94928
|
1,436 sq. feet
|
2 baths 3 beds |
show details | |

|
#6
Anson Ct
Rohnert Park, CA 94928
|
1,200 sq. feet
|
2 baths 3 beds |
show details | |

|
#7
Hollingsworth Cir
Rohnert Park, CA 94928
|
1,800 sq. feet
|
2 baths 3 beds |
show details | |

|
#8
Racquet Club Cir
Rohnert Park, CA 94928
|
1,162 sq. feet
|
2 baths 2 beds |
show details | |

|
#9
Country Club Dr
Rohnert Park, CA 94928
|
2,442 sq. feet
|
3 baths 4 beds |
show details | |

|
#10
Harbor Ln
Rohnert Park, CA 94928
|
1,385 sq. feet
|
3 baths 3 beds |
show details |
| Photo | Address | Area | Beds / Baths | Price | Details |
|---|---|---|---|---|---|

|
#11
Bernice Ave
Rohnert Park, CA 94928
|
1,400 sq. feet
|
2 baths 4 beds |
show details | |

|
#12
Country Club Dr
Rohnert Park, CA 94928
|
- sq. feet
|
4 baths 8 beds |
show details | |

|
#13
Commerce Blvd Ste 151
Rohnert Park, CA 94928
|
- sq. feet
|
- baths - beds |
show details | |

|
#14
Valley House Dr
Rohnert Park, CA 94928
|
- sq. feet
|
- baths - beds |
show details | |

|
#15
Kameron Pl
Rohnert Park, CA 94928
|
- sq. feet
|
- baths - beds |
show details | |

|
#16
Camino Colegio Apt 22
Rohnert Park, CA 94928
|
- sq. feet
|
- baths - beds |
show details | |

|
#17
Southwest Blvd
Rohnert Park, CA 94928
|
- sq. feet
|
- baths - beds |
show details | |

|
#18
Dowdell Ave, Unit 365
Rohnert Park, CA 94928
|
- sq. feet
|
- baths - beds |
show details | |

|
#19
Commerce Blvd Ste 22
Rohnert Park, CA 94928
|
- sq. feet
|
- baths - beds |
show details | |

|
#20
Southwest Blvd Apt D
Rohnert Park, CA 94928
|
- sq. feet
|
- baths - beds |
show details |
| Photo | Address | Area | Beds / Baths | Price | Details |
|---|---|---|---|---|---|

|
#21
Kaitlyn Pl
Rohnert Park, CA 94928
|
- sq. feet
|
- baths - beds |
show details | |

|
#22
Camino Colegio # 97
Rohnert Park, CA 94928
|
- sq. feet
|
- baths - beds |
show details | |

|
#23
Laguna Dr
Rohnert Park, CA 94928
|
- sq. feet
|
- baths - beds |
show details | |

|
#24
Dexter Cir
Rohnert Park, CA 94928
|
- sq. feet
|
- baths - beds |
show details | |

|
#25
Enterprise Dr
Rohnert Park, CA 94928
|
- sq. feet
|
- baths - beds |
show details | |

|
#26
Della Ct
Rohnert Park, CA 94928
|
- sq. feet
|
- baths - beds |
show details | |

|
#27
Kaitlyn Pl
Rohnert Park, CA 94928
|
- sq. feet
|
- baths - beds |
show details | |

|
#28
Fiery Ct
Rohnert Park, CA 94928
|
- sq. feet
|
- baths - beds |
show details | |

|
#29
San Benito Way
Rohnert Park, CA 94928
|
- sq. feet
|
- baths - beds |
show details | |

|
#30
Laurel Ct
Rohnert Park, CA 94928
|
- sq. feet
|
- baths - beds |
show details |
| Photo | Address | Area | Beds / Baths | Price | Details |
|---|---|---|---|---|---|

|
#31
Kyle Pl
Rohnert Park, CA 94928
|
- sq. feet
|
- baths - beds |
show details | |

|
Check over 1 million property listings on Foreclosure.com!
|
browse all offers | |||


Median year apartment built: 1988
Household type by relationship:
Households: 43,934- Male householders: 7,176 (1,641 living alone), Female householders: 9,600 (2,411 living alone)
7,136 spouses (6,898 opposite-sex spouses), 1,957 unmarried partners, (1,950 opposite-sex unmarried partners), 12,125 children (11,310 natural, 238 adopted, 577 stepchildren), 587 grandchildren, 469 brothers or sisters, 531 parents, 9 foster children, 959 other relatives, 3,175 non-relatives
- In group quarters: 202
Size of family households: 4,359 2-persons, 2,554 3-persons, 1,673 4-persons, 992 5-persons, 408 6-persons, 234 7-or-more-persons.
Size of nonfamily households: 4,460 1-person, 1,970 2-persons, 379 3-persons, 236 4-persons, 90 5-persons, 17 6-persons, 13 7-or-more-persons.
4,956 married couples with children.
2,876 single-parent households (779 men, 2,097 women).
74.1% of residents of Rohnert Park speak English at home.
19.1% of residents speak Spanish at home (70% speak English very well, 13% speak English well, 12% speak English not well, 4% don't speak English at all).
2.5% of residents speak other Indo-European language at home (79% speak English very well, 15% speak English well, 6% speak English not well).
3.1% of residents speak Asian or Pacific Island language at home (64% speak English very well, 30% speak English well, 4% speak English not well, 3% don't speak English at all).
0.6% of residents speak other language at home (67% speak English very well, 33% speak English well).
Foreign born population: 6,429 (14.6%)
(45.9% of them are naturalized citizens)
| Here: | 5.6 |
| State: | 6.0 |
| Here: | 3.7 |
| State: | 3.9 |

- Bedrooms in owner-occupied houses and condos in Rohnert Park, California
- 80no bedroom
- 1881 bedroom
- 1,7302 bedrooms
- 3,9953 bedrooms
- 2,3784 bedrooms
- 4035+ bedrooms

- Bedrooms in renter-occupied apartments in Rohnert Park, California
- 513no bedroom
- 2,4951 bedroom
- 3,3042 bedrooms
- 1,6173 bedrooms
- 5704 bedrooms
- 1595+ bedrooms

- Cars and other vehicles available in Rohnert Park in owner-occupied houses/condos
- 152no vehicle
- 1,9931 vehicle
- 3,4922 vehicles
- 2,1683 vehicles
- 5234 vehicles
- 4465+ vehicles

- Cars and other vehicles available in Rohnert Park in renter-occupied apartments
- 629no vehicle
- 2,7411 vehicle
- 3,4642 vehicles
- 9683 vehicles
- 7044 vehicles
- 1515+ vehicles

- Rooms in owner-occupied houses in Rohnert Park, California
- 01 room
- 392 rooms
- 4553 rooms
- 1,0434 rooms
- 2,2765 rooms
- 1,7126 rooms
- 1,6167 rooms
- 6998 rooms
- 9339+ rooms

- Rooms in renter-occupied apartments in Rohnert Park, California
- 4661 room
- 1,2002 rooms
- 1,9573 rooms
- 2,2214 rooms
- 1,3475 rooms
- 5996 rooms
- 5027 rooms
- 2508 rooms
- 1169+ rooms


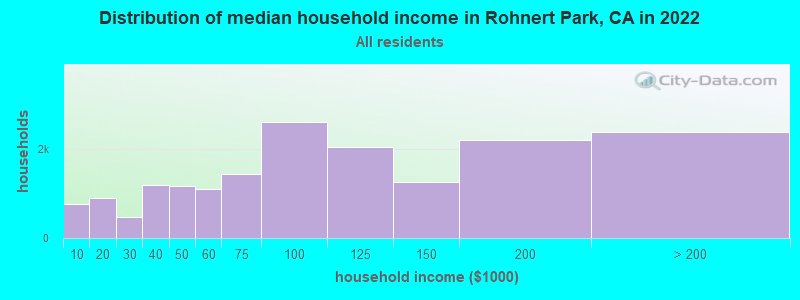
Rohnert Park, CA household income distribution

- 757Less than $10,000
- 898$10,000 to $19,999
- 466$20,000 to $29,999
- 1,184$30,000 to $39,999
- 1,159$40,000 to $49,999
- 1,091$50,000 to $59,999
- 1,445$60,000 to $74,999
- 2,600$75,000 to $99,999
- 2,032$100,000 to $124,999
- 1,245$125,000 to $149,999
- 2,187$150,000 to $199,999
- 2,373$200,000 or more
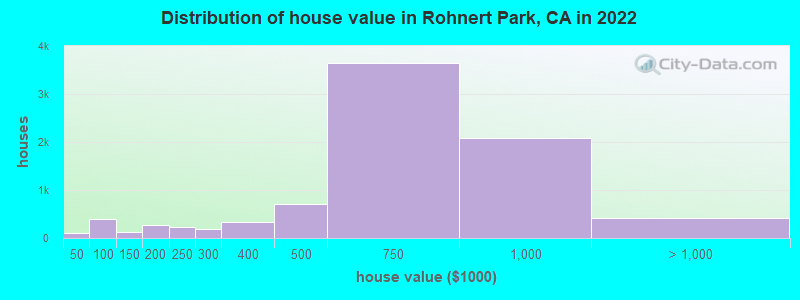
Home value of owner - occupied houses in 2022 in Rohnert Park, CA
-
- 29Less than $10,000
- 18$10,000 to $14,999
- 20$15,000 to $19,999
- 8$30,000 to $34,999
- 14$35,000 to $39,999
- 22$40,000 to $49,999
- 44$50,000 to $59,999
- 105$60,000 to $69,999
- 77$70,000 to $79,999
- 107$80,000 to $89,999
- 34$90,000 to $99,999
- 71$100,000 to $124,999
- 46$125,000 to $149,999
- 168$150,000 to $174,999
- 104$175,000 to $199,999
- 218$200,000 to $249,999
- 186$250,000 to $299,999
- 322$300,000 to $399,999
- 711$400,000 to $499,999
- 3,640$500,000 to $749,999
- 2,084$750,000 to $999,999
- 242$1,000,000 to $1,499,999
- 167$1,500,000 to $1,999,999
- 16$2,000,000 or more
Rent paid by renters in 2022 in Rohnert Park, CA
-
- 45Less than $100
- 73$150 to $199
- 130$250 to $299
- 117$300 to $349
- 23$350 to $399
- 15$400 to $449
- 6$450 to $499
- 49$500 to $549
- 46$550 to $599
- 104$600 to $649
- 90$700 to $749
- 66$750 to $799
- 60$800 to $899
- 121$900 to $999
- 360$1,000 to $1,249
- 822$1,250 to $1,499
- 2,564$1,500 to $1,999
- 1,957$2,000 to $2,499
- 998$2,500 to $2,999
- 576$3,000 to $3,499
- 184$3,500 or more
- 112No cash rent


Percentage of workers working in this county: 83.6%
Number of people working at home: 2,538 (10.6% of all workers)
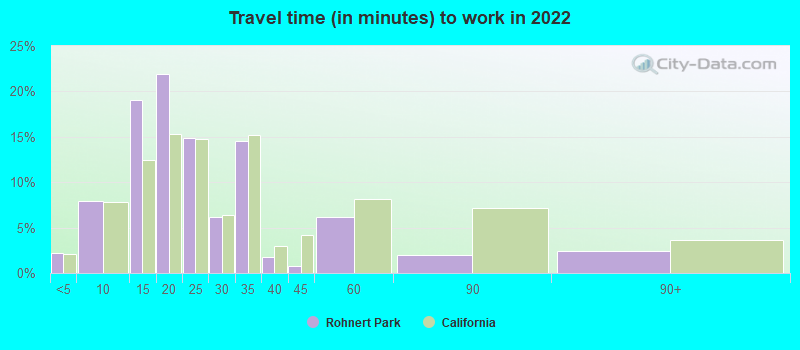
Travel time to work (commute)
- Less than 5 minutes: 505
- 5 to 9 minutes: 1,354
- 10 to 14 minutes: 2,611
- 15 to 19 minutes: 3,528
- 20 to 24 minutes: 3,176
- 25 to 29 minutes: 1,814
- 30 to 34 minutes: 2,508
- 35 to 39 minutes: 720
- 40 to 44 minutes: 704
- 45 to 59 minutes: 1,685
- 60 to 89 minutes: 1,950
- 90 or more minutes: 601
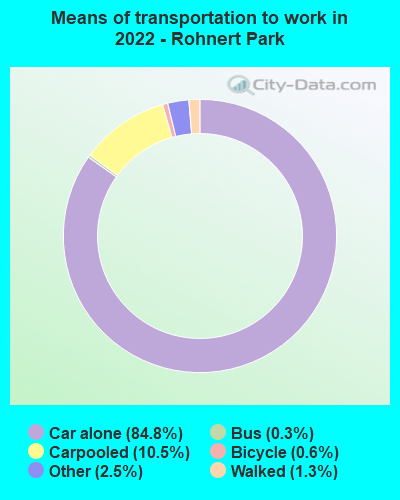
Means of transportation to work:
- Drove a car alone: 11,986 (72.9%)
- Carpooled: 1,229 (7.5%)
- Bus: 31 (0.2%)
- Taxi: 300 (1.8%)
- Bicycle: 103 (0.6%)
- Walked: 216 (1.3%)
- Worked at home: 2,538 (15.4%)

- Unemployment by race in 2022
- Unemployment rate for White non-Hispanic residents
- 6.0%Males
- 3.1%Females
- Unemployment rate for Black residents
- 10.1%Males
- 6.0%Females
- Unemployment rate for American Indian and Alaska Native residents
- 3.4%Males
- Unemployment rate for Asian residents
- 6.8%Males
- 0.7%Females
- Unemployment rate for other race residents
- 1.3%Males
- 5.2%Females
- Unemployment rate for two or more race residents
- 1.4%Males
- 3.0%Females
- Unemployment rate for Hispanic or Latino residents
- 1.5%Males
- 2.5%Females

- Year of entry for the foreign-born population in Rohnert Park, California
- 1,3902010 or later
- 2,0302000 to 2009
- 1,2901990 to 1999
- 1,3081980 to 1989
- 8471970 to 1979
- 850Before 1970

First ancestries reported:
- Italian: 1,291 (6.5%)
- Irish: 1,257 (6.3%)
- English: 1,096 (5.5%)
- European: 1,039 (5.2%)
- German: 888 (4.4%)
- American: 576 (2.9%)
- Portuguese: 297 (1.5%)
- Scottish: 208 (1.0%)
- Haitian: 205 (1.0%)
- Scandinavian: 169 (0.8%)
- Polish: 169 (0.8%)
- Norwegian: 168 (0.8%)
- French: 145 (0.7%)
- Danish: 122 (0.6%)
- Northern European: 116 (0.6%)
- Ukrainian: 104 (0.5%)
- British: 100 (0.5%)
- Lebanese: 95 (0.5%)
- Greek: 95 (0.5%)
- Russian: 93 (0.5%)
- Romanian: 91 (0.5%)
- Swedish: 90 (0.5%)
- Scotch-Irish: 86 (0.4%)
- Eastern European: 81 (0.4%)
- Egyptian: 63 (0.3%)
- Ugandan: 53 (0.3%)
- Jordanian: 46 (0.2%)
- Arab: 45 (0.2%)
- Swiss: 45 (0.2%)
- Brazilian: 42 (0.2%)
- French Canadian: 36 (0.2%)
- Hungarian: 29 (0.1%)
- Lithuanian: 28 (0.1%)
- Croatian: 25 (0.1%)
- Welsh: 20 (0.1%)
- Yugoslavian: 20 (0.1%)
- Ethiopian: 19 (0.10%)
- Celtic: 16 (0.08%)
- Austrian: 16 (0.08%)
- Canadian: 14 (0.07%)
- Australian: 14 (0.07%)
- Maltese: 12 (0.06%)
- Moroccan: 12 (0.06%)
- Palestinian: 10 (0.05%)
- Czechoslovakian: 7 (0.04%)
- Israeli: 7 (0.04%)
- Iranian: 6 (0.03%)
- Dutch: 5 (0.03%)
Most common places of birth for foreign-born residents (%):
| Rohnert Park: | 46.7% (3,011) |
| California: | 37.2% (3,881,193) |
| Rohnert Park: | 5.4% (349) |
| California: | 7.8% (818,297) |
| Rohnert Park: | 3.4% (222) |
| California: | 6.6% (684,672) |
| Rohnert Park: | 3.1% (203) |
| California: | 4.9% (512,335) |
| Rohnert Park: | 3.1% (199) |
| California: | 0.6% (60,582) |
| Rohnert Park: | 3.0% (192) |
| California: | 3.0% (315,248) |
| Rohnert Park: | 2.8% (179) |
| California: | 0.3% (33,937) |
| Rohnert Park: | 2.7% (175) |
| California: | 0.7% (74,025) |
| Rohnert Park: | 2.4% (155) |
| California: | 5.2% (539,184) |
| Rohnert Park: | 2.4% (153) |
| California: | 4.2% (440,287) |
| Rohnert Park: | 2.2% (142) |
| California: | 0.5% (55,249) |
| Rohnert Park: | 2.0% (129) |
| California: | 1.2% (127,477) |
| Rohnert Park: | 1.8% (116) |
| California: | 0.1% (6,119) |
| Rohnert Park: | 1.7% (109) |
| California: | 2.8% (290,436) |
| Rohnert Park: | 1.6% (104) |
| California: | 0.2% (16,541) |
Place of birth for U.S.-born residents:
- This state: 28,506
- Other state: 8,512
- Northeast: 2,580
- Midwest: 1,540
- South: 2,685
- West: 1,815
82.9% of Rohnert Park residents lived in the same house 1 years ago.
Out of people who lived in different houses, 36.9% lived in this county.
Out of people who lived in different counties, 87.4% lived in California.
| Rohnert Park: | 82.9% |
| State average: | 88.9% |
Education attainment for males 25 years and older:
- No schooling: 166
- Nursery to 4th grade: 140
- 5th and 6th grade: 390
- 7th and 8th grade: 72
- 9th grade: 3
- 10th grade: 77
- 11th grade: 106
- 12th grade, no diploma: 540
- High school graduate (or equivalency): 3,867
- Less than 1 year of college: 905
- Some college more than 1 year, no degree: 2,995
- Associate degree: 1,399
- Bachelor's degree: 2,571
- Master's degree: 902
- Professional school degree: 328
- Doctorate degree: 345

Education attainment for females 25 years and older:
- No schooling: 254
- Nursery to 4th grade: 43
- 5th and 6th grade: 63
- 7th and 8th grade: 77
- 9th grade: 98
- 10th grade: 0
- 11th grade: 55
- 12th grade, no diploma: 468
- High school graduate (or equivalency): 2,963
- Less than 1 year of college: 874
- Some college more than 1 year, no degree: 2,939
- Associate degree: 1,675
- Bachelor's degree: 3,169
- Master's degree: 1,534
- Professional school degree: 355
- Doctorate degree: 176


Housing units in structures:
- One, detached: 8,193
- One, attached: 1,839
- Two: 257
- 3 or 4: 1,171
- 5 to 9: 944
- 10 to 19: 847
- 20 to 49: 1,312
- 50 or more: 2,425
- Mobile homes: 853
- Boats, RVs, vans, etc.: 18
Median worth of mobile homes: $179,272
Housing units lacking complete kitchen facilities in 2022: 0.4%
House/condo owner moved in on average 12 years ago
Renter moved in on average 2 years ago

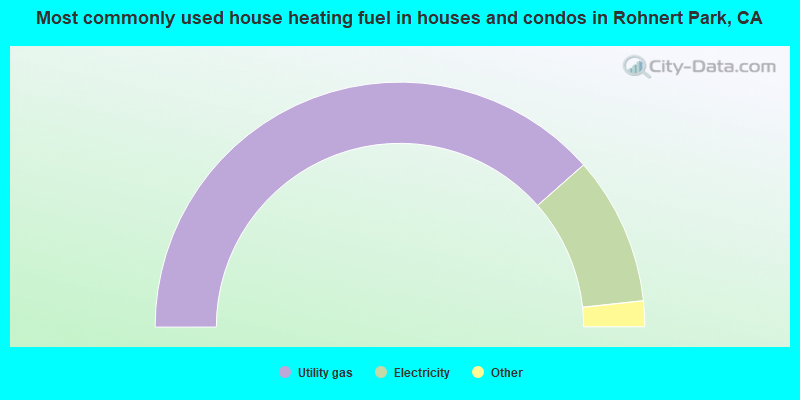
- 77.0%Utility gas
- 19.6%Electricity
- 1.3%Wood
- 1.1%Solar energy
- 0.6%Bottled, tank, or LP gas
- 0.4%Other fuel
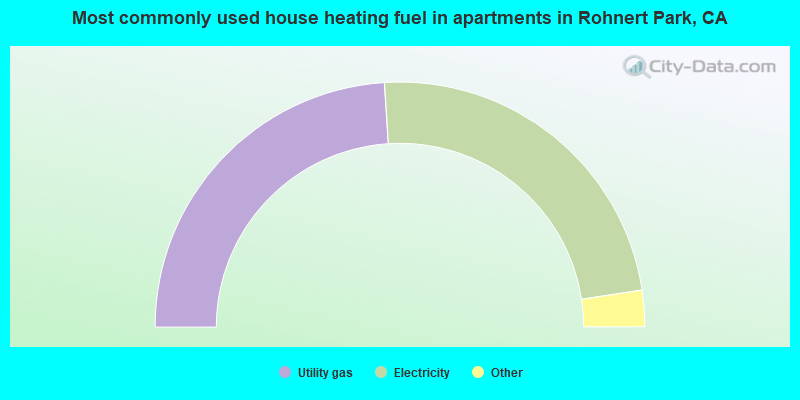
- 48.0%Utility gas
- 47.2%Electricity
- 3.1%No fuel used
- 0.9%Wood
- 0.7%Bottled, tank, or LP gas
Private vs. public school enrollment:
| Here: | 1.4% |
| California: | 10.5% |
| Here: | 2.4% |
| California: | 8.5% |
| Here: | 9.1% |
| California: | 15.9% |


