Rolling Hills, CA (California) Houses and Residents
| Rolling Hills: | over $2,200,493 |
| California: | $715,900 |
Mean price in 2022:
Detached houses: $4,121,457
Here: $4,121,457 State: $988,808 Townhouses or other attached units: $6,829,744
Here: $6,829,744 State: $838,546
Total population: 1,902 (Urban population: 1,871, Rural population: 0)
Houses: 690 (576 occupied: 533 owner occupied, 45 renter occupied)
| % of renters here: | 8% |
| State: | 44% |
Housing density: 224 houses/condos per square mile
Median price asked for vacant for-sale houses and condos in 2022: $3,041,643.
Median contract rent in 2022: over $2,000
Median gross rent in Rolling Hills, CA in 2022: over $2,000
Housing units in Rolling Hills with a mortgage: 321 (69 second mortgage, 5 home equity loan, 60 both second mortgage and home equity loan)
Houses without a mortgage: 16
Median household income for houses/condos with a mortgage: $248,703
Median household income for apartments without a mortgage: $256,383
Median monthly housing costs: $3,935
Compare current foreclosures near Rolling Hills, CA:
| Photo | Address | Area | Beds / Baths | Price | Details |
|---|---|---|---|---|---|

|
#1
W 73rd St
Los Angeles, CA 90047
|
1,700 sq. feet
|
2 baths 2 beds |
show details | |

|
#2
Marina City Dr Unit 116
Marina Del Rey, CA 90292
|
1,722 sq. feet
|
2 baths 3 beds |
show details | |

|
#3
E 60th St
Los Angeles, CA 90001
|
1,883 sq. feet
|
3 baths 5 beds |
show details | |

|
#4
Elburg St Unit A
Paramount, CA 90723
|
1,131 sq. feet
|
2 baths 3 beds |
show details | |

|
#5
W Arbor St # 57
Long Beach, CA 90805
|
1,585 sq. feet
|
2 baths 3 beds |
show details | |

|
#6
Marina City Drive # Ph 29
Marina Del Rey, CA 90292
|
3,200 sq. feet
|
2 baths 2 beds |
show details | |

|
#7
W 110th St
Inglewood, CA 90303
|
3,481 sq. feet
|
4 baths 6 beds |
show details | |

|
#8
Norwalk Blvd Apt
Hawaiian Gardens, CA 90716
|
800 sq. feet
|
2 baths 1 beds |
show details | |

|
#9
Redondo Avenue, Units 5-8
Long Beach, CA 90804
|
3,360 sq. feet
|
4 baths 8 beds |
show details | |

|
#10
Bonnie Brae St
Hermosa Beach, CA 90254
|
2,471 sq. feet
|
3 baths 3 beds |
show details |
| Photo | Address | Area | Beds / Baths | Price | Details |
|---|---|---|---|---|---|

|
#11
E Barclay St
Long Beach, CA 90805
|
963 sq. feet
|
1 baths 3 beds |
show details | |

|
#12
W Paseo Del Mar
San Pedro, CA 90731
|
1,121 sq. feet
|
1 baths 2 beds |
show details | |

|
#13
Ibbetson Ave
Lakewood, CA 90713
|
1,044 sq. feet
|
1 baths 3 beds |
show details | |

|
#14
5th Ave
Los Angeles, CA 90043
|
1,315 sq. feet
|
2 baths 3 beds |
show details | |

|
#15
Regway Ave
Long Beach, CA 90810
|
924 sq. feet
|
1 baths 2 beds |
show details | |

|
#16
W 58th Pl
Los Angeles, CA 90043
|
2,417 sq. feet
|
3 baths 4 beds |
show details | |

|
#17
S 5th Ave
Inglewood, CA 90303
|
2,010 sq. feet
|
3 baths 4 beds |
show details | |

|
#18
Alviso Ave
Los Angeles, CA 90043
|
1,330 sq. feet
|
1 baths 3 beds |
show details | |

|
#19
Marbella Ave
Carson, CA 90745
|
1,348 sq. feet
|
2 baths 3 beds |
show details | |

|
#20
Veragua Dr
Playa Del Rey, CA 90293
|
6,881 sq. feet
|
5 baths 5 beds |
show details |
| Photo | Address | Area | Beds / Baths | Price | Details |
|---|---|---|---|---|---|

|
#21
W 70th St
Los Angeles, CA 90044
|
1,102 sq. feet
|
1 baths 2 beds |
show details | |

|
#22
E Hatchway St
Compton, CA 90222
|
634 sq. feet
|
1 baths 2 beds |
show details | |

|
#23
W 76th St
Inglewood, CA 90305
|
1,668 sq. feet
|
2 baths 3 beds |
show details | |

|
#24
W 112th St
Los Angeles, CA 90047
|
1,208 sq. feet
|
1 baths 3 beds |
show details | |

|
#25
Denrock Ave
Los Angeles, CA 90045
|
3,720 sq. feet
|
5 baths 4 beds |
show details | |

|
#26
E Stockwell St
Compton, CA 90222
|
848 sq. feet
|
2 baths 4 beds |
show details | |

|
#27
Johnson Ave
Long Beach, CA 90805
|
1,252 sq. feet
|
2 baths 3 beds |
show details | |

|
#28
E 215th Pl
Carson, CA 90745
|
1,225 sq. feet
|
2 baths 4 beds |
show details | |

|
#29
Virginia St
Lynwood, CA 90262
|
1,548 sq. feet
|
2 baths 3 beds |
show details | |

|
#30
Santa Fe Ave
Lynwood, CA 90262
|
1,124 sq. feet
|
2 baths 3 beds |
show details |
| Photo | Address | Area | Beds / Baths | Price | Details |
|---|---|---|---|---|---|

|
#31
E Keynote St
Long Beach, CA 90808
|
1,064 sq. feet
|
1 baths 2 beds |
show details | |

|
#32
Harlan Ave
Carson, CA 90746
|
1,422 sq. feet
|
2 baths 3 beds |
show details | |

|
#33
Pomering Rd
Downey, CA 90241
|
1,549 sq. feet
|
2 baths 3 beds |
show details | |

|
#34
Via Davalos
Palos Verdes Peninsula, CA 90274
|
4,208 sq. feet
|
5 baths 4 beds |
show details | |

|
#35
E 113th St
Los Angeles, CA 90059
|
1,085 sq. feet
|
1 baths 3 beds |
show details | |

|
#36
W 95th St
Los Angeles, CA 90044
|
1,558 sq. feet
|
2 baths 3 beds |
show details | |

|
#37
Josephine St
Lynwood, CA 90262
|
1,414 sq. feet
|
1 baths 3 beds |
show details | |

|
#38
May Ct
South Gate, CA 90280
|
943 sq. feet
|
1 baths 3 beds |
show details | |

|
#39
W 71st St
Los Angeles, CA 90043
|
835 sq. feet
|
1 baths 2 beds |
show details | |

|
#40
S Bentley Ave
Compton, CA 90220
|
1,738 sq. feet
|
2 baths 4 beds |
show details |
| Photo | Address | Area | Beds / Baths | Price | Details |
|---|---|---|---|---|---|

|
#41
E 120th St
Los Angeles, CA 90059
|
1,240 sq. feet
|
2 baths 3 beds |
show details | |

|
#42
4th Ave
Los Angeles, CA 90043
|
1,536 sq. feet
|
2 baths 4 beds |
show details | |

|
#43
Eastwood Ave
Torrance, CA 90504
|
1,217 sq. feet
|
2 baths 2 beds |
show details | |

|
#44
Walnut Ave
Long Beach, CA 90807
|
1,912 sq. feet
|
3 baths 2 beds |
show details | |

|
#45
E 107th St
Los Angeles, CA 90002
|
748 sq. feet
|
1 baths 2 beds |
show details | |

|
#46
S Gramercy Pl
Los Angeles, CA 90047
|
1,800 sq. feet
|
2 baths 3 beds |
show details | |

|
#47
Leapwood Ave
Carson, CA 90746
|
1,478 sq. feet
|
2 baths 4 beds |
show details | |

|
#48
Liberty Blvd
South Gate, CA 90280
|
1,488 sq. feet
|
2 baths 3 beds |
show details | |

|
#49
W 94th St
Los Angeles, CA 90044
|
1,322 sq. feet
|
2 baths 3 beds |
show details | |

|
Check over 1 million property listings on Foreclosure.com!
|
browse all offers | |||


 | Looking to move to OC - Need Real Estate Advice (20 replies) |
| California Census Places by Highest Average Family Income($300,000+) (40 replies) |
| Bay Area ethnic communities (87 replies) |
| if anyone knows of good apartments for rent (3 replies) |
| California is a Failed State. Why Are You Still Here? (298 replies) |
| Is it just me, or is most of Torrance hideous-looking? (97 replies) |

Median year apartment built: 1975
Household type by relationship:
Households: 1,419- Male householders: 320 (34 living alone), Female householders: 236 (45 living alone)
400 spouses (376 opposite-sex spouses), 4 unmarried partners, (4 opposite-sex unmarried partners), 365 children (345 natural, 17 adopted, 2 stepchildren), 0 grandchildren, 4 brothers or sisters, 11 parents, 59 foster children, 1 other relatives, 12 non-relatives
Size of family households: 300 2-persons, 57 3-persons, 71 4-persons, 45 5-persons, 6 6-persons.
Size of nonfamily households: 86 1-person, 14 2-persons.
193 married couples with children.
16 single-parent households (3 men, 13 women).
75.6% of residents of Rolling Hills speak English at home.
3.4% of residents speak Spanish at home (96% speak English very well, 4% speak English well).
7.8% of residents speak other Indo-European language at home (90% speak English very well, 7% speak English well, 3% speak English not well).
14.8% of residents speak Asian or Pacific Island language at home (67% speak English very well, 21% speak English well, 13% speak English not well).
0.1% of residents speak other language at home (100% speak English very well).
Foreign born population: 308 (21.7%)
(88.6% of them are naturalized citizens)
| Here: | 8.2 |
| State: | 6.0 |
| Here: | 7.3 |
| State: | 3.9 |

- Bedrooms in owner-occupied houses and condos in Rolling Hills, California
- 0no bedroom
- 01 bedroom
- 312 bedrooms
- 1203 bedrooms
- 2334 bedrooms
- 1495+ bedrooms

- Bedrooms in renter-occupied apartments in Rolling Hills, California
- 0no bedroom
- 01 bedroom
- 02 bedrooms
- 123 bedrooms
- 234 bedrooms
- 105+ bedrooms

- Cars and other vehicles available in Rolling Hills in owner-occupied houses/condos
- 18no vehicle
- 391 vehicle
- 1862 vehicles
- 1503 vehicles
- 904 vehicles
- 505+ vehicles

- Cars and other vehicles available in Rolling Hills in renter-occupied apartments
- 0no vehicle
- 161 vehicle
- 222 vehicles
- 73 vehicles
- 04 vehicles
- 05+ vehicles

- Rooms in owner-occupied houses in Rolling Hills, California
- 01 room
- 02 rooms
- 03 rooms
- 244 rooms
- 185 rooms
- 856 rooms
- 847 rooms
- 688 rooms
- 2539+ rooms

- Rooms in renter-occupied apartments in Rolling Hills, California
- 01 room
- 02 rooms
- 03 rooms
- 04 rooms
- 15 rooms
- 36 rooms
- 237 rooms
- 08 rooms
- 189+ rooms


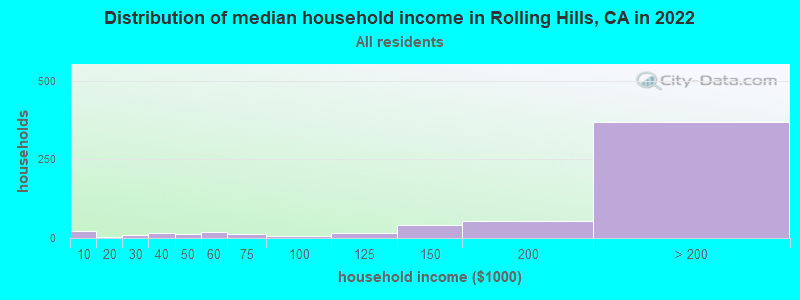
Rolling Hills, CA household income distribution

- 21Less than $10,000
- 3$10,000 to $19,999
- 10$20,000 to $29,999
- 17$30,000 to $39,999
- 14$40,000 to $49,999
- 19$50,000 to $59,999
- 13$60,000 to $74,999
- 6$75,000 to $99,999
- 16$100,000 to $124,999
- 41$125,000 to $149,999
- 55$150,000 to $199,999
- 369$200,000 or more
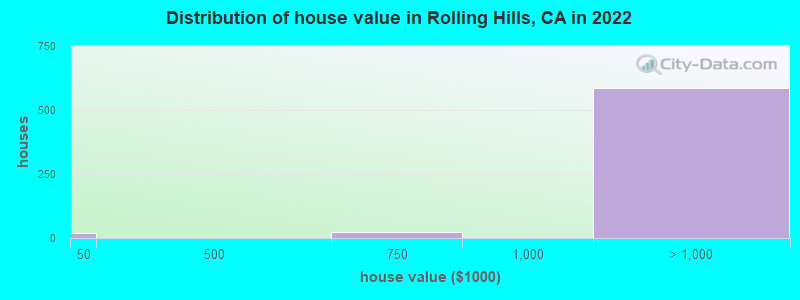
Home value of owner - occupied houses in 2022 in Rolling Hills, CA
-
- 19Less than $10,000
- 22$500,000 to $749,999
- 14$1,000,000 to $1,499,999
- 3$1,500,000 to $1,999,999
- 565$2,000,000 or more

Percentage of workers working in this county: 98.1%
Number of people working at home: 138 (26.7% of all workers)
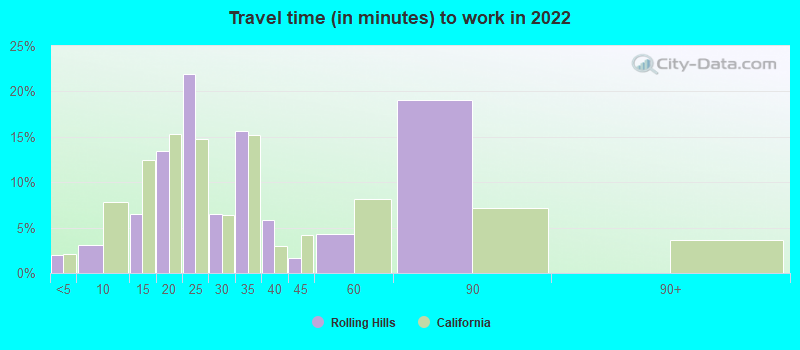
Travel time to work (commute)
- Less than 5 minutes: 5
- 5 to 9 minutes: 0
- 10 to 14 minutes: 37
- 15 to 19 minutes: 54
- 20 to 24 minutes: 72
- 25 to 29 minutes: 44
- 30 to 34 minutes: 66
- 35 to 39 minutes: 11
- 40 to 44 minutes: 28
- 45 to 59 minutes: 44
- 60 to 89 minutes: 23
- 90 or more minutes: 5
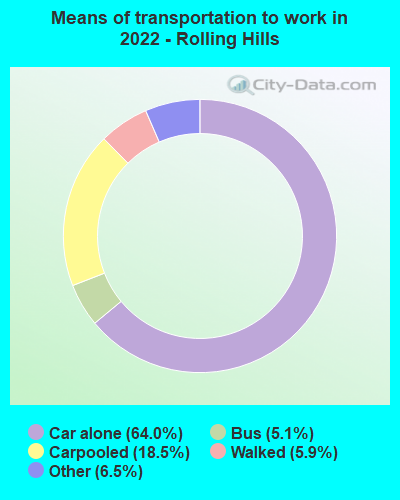
Means of transportation to work:
- Drove a car alone: 225 (47.0%)
- Carpooled: 72 (15.0%)
- Bus: 16 (3.3%)
- Taxi: 24 (5.0%)
- Walked: 22 (4.6%)
- Worked at home: 138 (28.8%)

- Unemployment by race in 2022
- Unemployment rate for White non-Hispanic residents
- 2.1%Males
- 8.7%Females
- Unemployment rate for Black residents
- 57.4%Males
- Unemployment rate for Asian residents
- 3.1%Females

- Year of entry for the foreign-born population in Rolling Hills, California
- 142010 or later
- 272000 to 2009
- 351990 to 1999
- 1081980 to 1989
- 731970 to 1979
- 129Before 1970

First ancestries reported:
- Iranian: 63 (7.9%)
- English: 55 (6.9%)
- German: 47 (5.9%)
- European: 33 (4.1%)
- British: 30 (3.7%)
- Irish: 28 (3.5%)
- Italian: 28 (3.5%)
- American: 18 (2.2%)
- Greek: 15 (1.9%)
- Norwegian: 11 (1.4%)
- Lithuanian: 10 (1.2%)
- Ukrainian: 10 (1.2%)
- Kenyan: 7 (0.9%)
- Croatian: 4 (0.5%)
- Northern European: 4 (0.5%)
- Danish: 3 (0.4%)
- Scottish: 3 (0.4%)
- Serbian: 3 (0.4%)
- Swedish: 3 (0.4%)
- Armenian: 2 (0.2%)
- Dutch: 2 (0.2%)
- French: 2 (0.2%)
- Russian: 2 (0.2%)
- Scandinavian: 2 (0.2%)
- Lebanese: 1 (0.1%)
- Eastern European: 1 (0.1%)
- Polish: 1 (0.1%)
- Romanian: 1 (0.1%)
Most common places of birth for foreign-born residents (%):
| Rolling Hills: | 17.2% (53) |
| California: | 3.0% (315,248) |
| Rolling Hills: | 16.9% (52) |
| California: | 1.7% (176,274) |
| Rolling Hills: | 13.6% (42) |
| California: | 2.0% (206,004) |
| Rolling Hills: | 7.5% (23) |
| California: | 6.6% (684,672) |
| Rolling Hills: | 5.2% (16) |
| California: | 5.2% (539,184) |
| Rolling Hills: | 4.9% (15) |
| California: | 7.8% (818,297) |
| Rolling Hills: | 2.9% (9) |
| California: | 0.3% (35,557) |
| Rolling Hills: | 2.6% (8) |
| California: | 0.3% (31,439) |
| Rolling Hills: | 2.3% (7) |
| California: | 1.0% (103,575) |
| Rolling Hills: | 2.3% (7) |
| California: | 0.3% (30,441) |
| Rolling Hills: | 1.6% (5) |
| California: | 0.6% (60,582) |
| Rolling Hills: | 1.6% (5) |
| California: | 0.0% (3,665) |
| Rolling Hills: | 1.6% (5) |
| California: | 0.2% (23,338) |
| Rolling Hills: | 1.6% (5) |
| California: | 0.5% (55,249) |
Place of birth for U.S.-born residents:
- This state: 614
- Other state: 468
- Northeast: 164
- Midwest: 138
- South: 90
- West: 73
98.0% of Rolling Hills residents lived in the same house 1 years ago.
Out of people who lived in different houses, 43.9% lived in this county.
Out of people who lived in different counties, 0.0% lived in California.
| Rolling Hills: | 98.0% |
| State average: | 88.9% |
Education attainment for males 25 years and older:
- No schooling: 0
- Nursery to 4th grade: 0
- 5th and 6th grade: 0
- 7th and 8th grade: 0
- 9th grade: 0
- 10th grade: 0
- 11th grade: 0
- 12th grade, no diploma: 0
- High school graduate (or equivalency): 11
- Less than 1 year of college: 5
- Some college more than 1 year, no degree: 82
- Associate degree: 10
- Bachelor's degree: 220
- Master's degree: 80
- Professional school degree: 90
- Doctorate degree: 68

Education attainment for females 25 years and older:
- No schooling: 3
- Nursery to 4th grade: 0
- 5th and 6th grade: 0
- 7th and 8th grade: 0
- 9th grade: 2
- 10th grade: 0
- 11th grade: 0
- 12th grade, no diploma: 0
- High school graduate (or equivalency): 44
- Less than 1 year of college: 15
- Some college more than 1 year, no degree: 53
- Associate degree: 43
- Bachelor's degree: 177
- Master's degree: 112
- Professional school degree: 57
- Doctorate degree: 12


Housing units in structures:
- One, detached: 679
- One, attached: 10
Housing units lacking complete kitchen facilities in 2022: 0.4%
House/condo owner moved in on average 16 years ago
Renter moved in on average 7 years ago

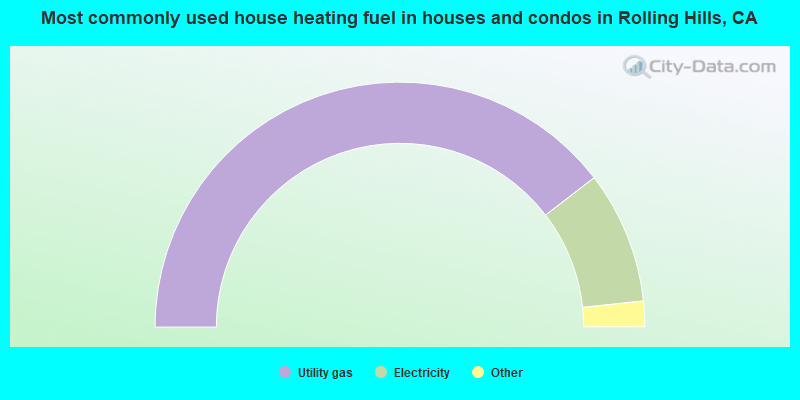
- 79.4%Utility gas
- 17.5%Electricity
- 2.7%Solar energy
- 0.4%Bottled, tank, or LP gas
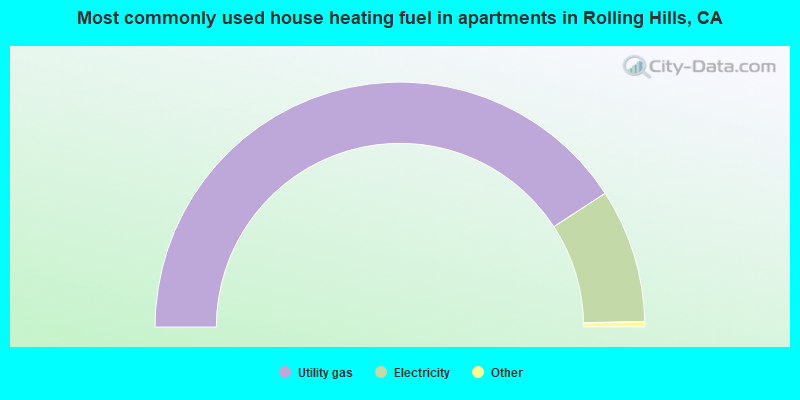
- 82.2%Utility gas
- 17.8%Electricity
Private vs. public school enrollment:
| Here: | 5.2% |
| California: | 10.5% |
| Here: | 25.4% |
| California: | 8.5% |
| Here: | 24.3% |
| California: | 15.9% |


