Rollinsford, NH (New Hampshire) Houses and Residents
| Rollinsford: | $409,380 |
| New Hampshire: | $384,700 |
Total population: 2,527 (Urban population: 2,428, Rural population: 220 (all nonfarm))
Houses: 1,060 (1,033 occupied: 722 owner occupied, 311 renter occupied)
| % of renters here: | 30% |
| State: | 28% |
Housing density: 145 houses/condos per square mile
Median price asked for vacant for-sale houses and condos in 2022 in this county: $227,322.
Median contract rent in 2022: $1,308 (lower quartile is $942, upper quartile is $1,634)
Median rent asked for vacant for-rent units in 2022: $915
Median gross rent in Rollinsford, NH in 2022: $1,412
Housing units in Rollinsford with a mortgage: 364 (20 second mortgage, 57 home equity loan, 0 both second mortgage and home equity loan)
Houses without a mortgage: 187


Latest news about housing in Rollinsford, NH collected exclusively by city-data.com from local newspapers, TV, and radio stations

 | BEST method for searching for apartments in NH (23 replies) |
| Dover-Vicinity Multifamily Rental Properties – Where Should I Buy? (5 replies) |
| Searching For a House Rental in the Seacoast Area (0 replies) |
| Where can we live off grid? (26 replies) |
| Thinking of moving to New England area. (42 replies) |
| Looking for a venue for my daughters first birthday in or around Dover, NH (16 replies) |

Household type by relationship:
Households: 114,722- In family households: 90,890 (20,423 male householders, 9,439 female householders)
22,797 spouses, 30,805 children (28,609 natural, 627 adopted, 1,569 stepchildren), 1,471 grandchildren, 649 brothers or sisters, 782 parents, foster children, 688 other relatives, 3,256 non-relatives
- In nonfamily households: 23,832 (8,241 male householders (5,585 living alone)), 8,997 female householders (6,782 living alone)), 6,594 nonrelatives
- In group quarters: 8,421 (993 institutionalized population)
18,381 married couples with children.
6,426 single-parent households (1,675 men, 4,751 women).
94.3% of residents of Rollinsford speak English at home.
0.3% of residents speak Spanish at home (100% speak English very well).
5.2% of residents speak other Indo-European language at home (65% speak English very well, 26% speak English well, 9% speak English not well).
0.2% of residents speak other language at home (100% speak English very well).
Foreign born population: 79 (2.5%)
(101.3% of them are naturalized citizens)
| Here: | 6.1 |
| State: | 6.4 |
| Here: | 3.7 |
| State: | 4.0 |

- Bedrooms in owner-occupied houses and condos in Rollinsford, New Hampshire
- 0no bedroom
- 241 bedroom
- 982 bedrooms
- 4323 bedrooms
- 1414 bedrooms
- 275+ bedrooms

- Bedrooms in renter-occupied apartments in Rollinsford, New Hampshire
- 4no bedroom
- 1061 bedroom
- 1322 bedrooms
- 493 bedrooms
- 94 bedrooms
- 115+ bedrooms

- Cars and other vehicles available in Rollinsford in owner-occupied houses/condos
- 21no vehicle
- 1621 vehicle
- 3102 vehicles
- 1833 vehicles
- 314 vehicles
- 155+ vehicles

- Cars and other vehicles available in Rollinsford in renter-occupied apartments
- 24no vehicle
- 1291 vehicle
- 1232 vehicles
- 253 vehicles
- 04 vehicles
- 105+ vehicles

- Rooms in owner-occupied houses in Rollinsford, New Hampshire
- 01 room
- 02 rooms
- 123 rooms
- 244 rooms
- 1615 rooms
- 2006 rooms
- 1597 rooms
- 718 rooms
- 959+ rooms

- Rooms in renter-occupied apartments in Rollinsford, New Hampshire
- 01 room
- 222 rooms
- 823 rooms
- 1214 rooms
- 345 rooms
- 256 rooms
- 137 rooms
- 118 rooms
- 39+ rooms


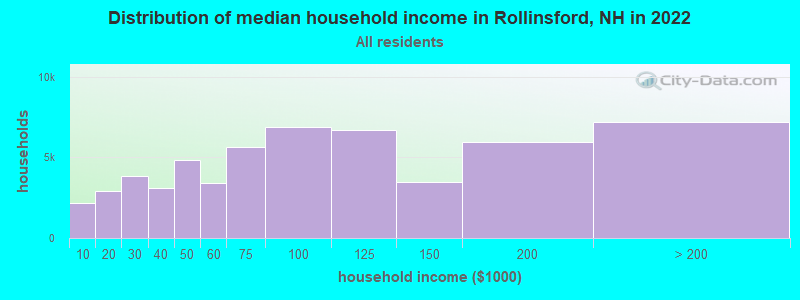
Rollinsford, NH household income distribution

- 2,143Less than $10,000
- 2,895$10,000 to $19,999
- 3,854$20,000 to $29,999
- 3,087$30,000 to $39,999
- 4,823$40,000 to $49,999
- 3,406$50,000 to $59,999
- 5,656$60,000 to $74,999
- 6,877$75,000 to $99,999
- 6,687$100,000 to $124,999
- 3,453$125,000 to $149,999
- 5,971$150,000 to $199,999
- 7,202$200,000 or more
Percentage of workers working in this county: 60.0%
Number of people working at home: 291 (17.1% of all workers)
Travel time to work (commute)
- Less than 5 minutes: 34
- 5 to 9 minutes: 164
- 10 to 14 minutes: 246
- 15 to 19 minutes: 220
- 20 to 24 minutes: 218
- 25 to 29 minutes: 129
- 30 to 34 minutes: 193
- 35 to 39 minutes: 34
- 40 to 44 minutes: 31
- 45 to 59 minutes: 67
- 60 to 89 minutes: 53
- 90 or more minutes: 42
Means of transportation to work:
- Drove a car alone: 1,271 (85.8%)
- Carpooled: 135 (9.1%)
- Bus or trolley bus: 4 (0.3%)
- Walked: 21 (1.4%)
- Worked at home: 50 (3.4%)


- Year of entry for the foreign-born population in Rollinsford, New Hampshire
- 01995 to March 2000
- 01990 to 1994
- 41985 to 1989
- 61980 to 1984
- 01975 to 1979
- 31970 to 1974
- 01965 to 1969
- 33Before 1965

First ancestries reported:
- Irish: 507 (15.6%)
- French: 438 (13.4%)
- French Canadian: 418 (12.8%)
- English: 417 (12.8%)
- Other: 273 (8.4%)
- United States: 198 (6.1%)
- Italian: 173 (5.3%)
- German: 157 (4.8%)
- Polish: 145 (4.4%)
- Scottish: 114 (3.5%)
- Scotch-Irish: 113 (3.5%)
- Greek: 44 (1.3%)
- Welsh: 42 (1.3%)
- Swedish: 40 (1.2%)
- Dutch: 34 (1.0%)
- Portuguese: 34 (1.0%)
- Norwegian: 30 (0.9%)
- Russian: 24 (0.7%)
- Arab: 22 (0.7%)
- Danish: 10 (0.3%)
- Czech: 8 (0.2%)
- West Indian: 8 (0.2%)
- Swiss: 4 (0.1%)
- Ukrainian: 4 (0.1%)
- Lithuanian: 3 (0.09%)
Most common places of birth for foreign-born residents (%):
| Rollinsford: | 41.3% (19) |
| New Hampshire: | 22.9% (12,397) |
| Rollinsford: | 19.6% (9) |
| New Hampshire: | 8.1% (4,396) |
| Rollinsford: | 10.9% (5) |
| New Hampshire: | 0.9% (508) |
| Rollinsford: | 8.7% (4) |
| New Hampshire: | 0.7% (401) |
| Rollinsford: | 8.7% (4) |
| New Hampshire: | 0.8% (414) |
| Rollinsford: | 6.5% (3) |
| New Hampshire: | 4.9% (2,670) |
| Rollinsford: | 4.3% (2) |
| New Hampshire: | 1.5% (837) |
Place of birth for U.S.-born residents:
- This state: 1,614
- Other state: 971
- Northeast: 761
- Midwest: 44
- South: 104
- West: 62
65% of Rollinsford residents lived in the same house 5 years ago.
Out of people who lived in different houses, 59% lived in this county.
Out of people who lived in different counties, 26% lived in New Hampshire.
Education attainment for males 25 years and older:
- No schooling: 5
- Nursery to 4th grade: 0
- 5th and 6th grade: 4
- 7th and 8th grade: 38
- 9th grade: 11
- 10th grade: 20
- 11th grade: 10
- 12th grade, no diploma: 12
- High school graduate (or equivalency): 320
- Less than 1 year of college: 60
- Some college more than 1 year, no degree: 74
- Associate degree: 83
- Bachelor's degree: 172
- Master's degree: 50
- Professional school degree: 5
- Doctorate degree: 6

Education attainment for females 25 years and older:
- No schooling: 0
- Nursery to 4th grade: 0
- 5th and 6th grade: 4
- 7th and 8th grade: 25
- 9th grade: 25
- 10th grade: 26
- 11th grade: 11
- 12th grade, no diploma: 10
- High school graduate (or equivalency): 329
- Less than 1 year of college: 71
- Some college more than 1 year, no degree: 108
- Associate degree: 72
- Bachelor's degree: 185
- Master's degree: 59
- Professional school degree: 4
- Doctorate degree: 0


Housing units in structures:
- One, detached: 700
- One, attached: 7
- Two: 109
- 3 or 4: 80
- 5 to 9: 112
- 10 to 19: 19
- 20 to 49: 11
- Mobile homes: 22
Median worth of mobile homes: $256,988

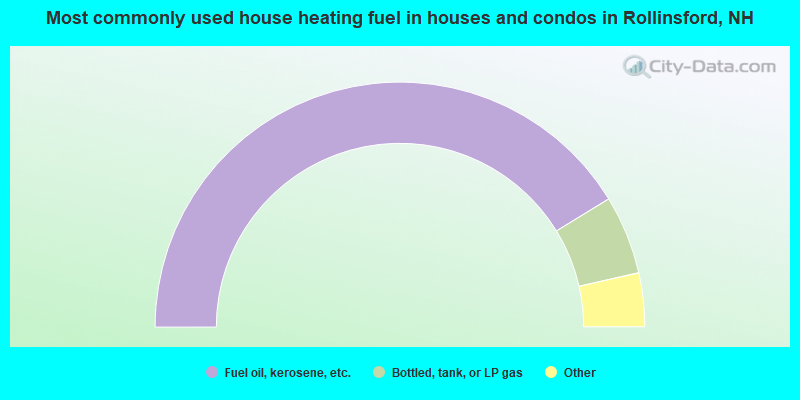
- 82.5%Fuel oil, kerosene, etc.
- 10.4%Bottled, tank, or LP gas
- 3.6%Wood
- 1.7%Coal or coke
- 1.4%Electricity
- 0.4%Utility gas
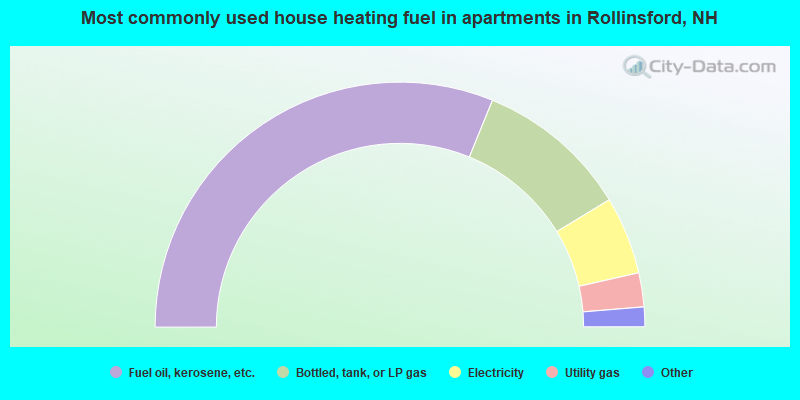
- 62.4%Fuel oil, kerosene, etc.
- 20.3%Bottled, tank, or LP gas
- 10.3%Electricity
- 4.5%Utility gas
- 1.6%Other fuel
- 1.0%No fuel used
Private vs. public school enrollment:
| Here: | 14.1% |
| New Hampshire: | 8.9% |
| Here: | 14.8% |
| New Hampshire: | 10.7% |
| Here: | 30.6% |
| New Hampshire: | 36.4% |


