Romulus, MI (Michigan) Houses and Residents
| Romulus: | $151,512 |
| Michigan: | $224,400 |
Total population: 23,496 (Urban population: 22,343, Rural population: 636 (all nonfarm))
Houses: 9,714 (8,911 occupied: 6,006 owner occupied, 2,956 renter occupied)
| % of renters here: | 33% |
| State: | 27% |
Housing density: 271 houses/condos per square mile
Median price asked for vacant for-sale houses and condos in 2022: $165,371.
Median contract rent in 2022: $827 (lower quartile is $568, upper quartile is $1,100)
Median rent asked for vacant for-rent units in 2022: $1,232
Median gross rent in Romulus, MI in 2022: $993
Housing units in Romulus with a mortgage: 3,928 (290 second mortgage, 0 home equity loan, 214 both second mortgage and home equity loan)
Houses without a mortgage: 190
Median household income for houses/condos with a mortgage: $78,818
Median household income for apartments without a mortgage: $63,470
Median monthly housing costs: $953
Compare current foreclosures in Romulus, MI:
| Photo | Address | Area | Beds / Baths | Price | Details |
|---|---|---|---|---|---|

|
#1
Colbert St
Romulus, MI 48174
|
960 sq. feet
|
1 baths 3 beds |
show details | |

|
#2
Taft St
Romulus, MI 48174
|
1,152 sq. feet
|
1 baths 3 beds |
show details | |

|
#3
Vinewood St
Romulus, MI 48174
|
1,848 sq. feet
|
2 baths 3 beds |
show details | |

|
#4
Olive St
Romulus, MI 48174
|
1,740 sq. feet
|
1 baths 4 beds |
show details | |

|
#5
Brandt St
Romulus, MI 48174
|
1,002 sq. feet
|
1 baths 3 beds |
show details | |

|
#6
Nottingham Dr
Romulus, MI 48174
|
2,364 sq. feet
|
2 baths 4 beds |
show details | |

|
#7
Bay Hill Dr
Romulus, MI 48174
|
2,838 sq. feet
|
3 baths 4 beds |
show details | |

|
#8
Trail Ridge Dr
Romulus, MI 48174
|
1,363 sq. feet
|
1 baths 4 beds |
show details | |

|
#9
Orchard St
Romulus, MI 48174
|
1,392 sq. feet
|
1 baths 3 beds |
show details | |

|
#10
Michigan Heights Dr
Romulus, MI 48174
|
2,495 sq. feet
|
2 baths 4 beds |
show details |
| Photo | Address | Area | Beds / Baths | Price | Details |
|---|---|---|---|---|---|

|
#11
Clocktower Dr
Romulus, MI 48174
|
1,422 sq. feet
|
2 baths 3 beds |
show details | |

|
#12
Meadow St
Romulus, MI 48174
|
1,237 sq. feet
|
1 baths 3 beds |
show details | |

|
#13
Colbert St
Romulus, MI 48174
|
960 sq. feet
|
1 baths 3 beds |
show details | |

|
#14
Ridgebrook Path
Romulus, MI 48174
|
1,104 sq. feet
|
1 baths 3 beds |
show details | |

|
#15
Chamberlain St
Romulus, MI 48174
|
1,728 sq. feet
|
2 baths 3 beds |
show details | |

|
#16
Commons Dr
Romulus, MI 48174
|
1,753 sq. feet
|
2 baths 3 beds |
show details | |

|
#17
Washington St
Romulus, MI 48174
|
1,008 sq. feet
|
1 baths 3 beds |
show details | |

|
#18
Syracuse Ave
Romulus, MI 48174
|
1,041 sq. feet
|
1 baths 3 beds |
show details | |

|
#19
Buckeye Ct
Romulus, MI 48174
|
3,142 sq. feet
|
2 baths 4 beds |
show details | |

|
#20
Gloria St
Romulus, MI 48174
|
1,008 sq. feet
|
1 baths 3 beds |
show details |
| Photo | Address | Area | Beds / Baths | Price | Details |
|---|---|---|---|---|---|

|
#21
Doves Pointe Dr
Romulus, MI 48174
|
1,866 sq. feet
|
3 baths 3 beds |
show details | |

|
#22
Heiden Dr
Romulus, MI 48174
|
1,617 sq. feet
|
2 baths 2 beds |
show details | |

|
#23
Leroy St
Romulus, MI 48174
|
1,008 sq. feet
|
1 baths 4 beds |
show details | |

|
#24
Leroy St
Romulus, MI 48174
|
1,056 sq. feet
|
2 baths 3 beds |
show details | |

|
#25
Gateway Dr
Romulus, MI 48174
|
1,795 sq. feet
|
3 baths - beds |
show details | |

|
#26
Taft St
Romulus, MI 48174
|
960 sq. feet
|
1 baths 3 beds |
show details | |

|
#27
Dexter St
Romulus, MI 48174
|
1,911 sq. feet
|
2 baths 4 beds |
show details | |

|
#28
Michigan Heights Dr
Romulus, MI 48174
|
2,326 sq. feet
|
2 baths 4 beds |
show details | |

|
#29
Willow Ln
Romulus, MI 48174
|
1,288 sq. feet
|
2 baths 3 beds |
show details | |

|
#30
Aberdeen Dr
Romulus, MI 48174
|
- sq. feet
|
2 baths 3 beds |
show details |
| Photo | Address | Area | Beds / Baths | Price | Details |
|---|---|---|---|---|---|

|
#31
Aston St
Romulus, MI 48174
|
1,512 sq. feet
|
1 baths - beds |
show details | |

|
#32
Aspen Dr
Romulus, MI 48174
|
- sq. feet
|
2 baths 4 beds |
show details | |

|
#33
Sunny Crest Dr
Romulus, MI 48174
|
- sq. feet
|
- baths - beds |
show details | |

|
#34
Cherokee Dr
Romulus, MI 48174
|
- sq. feet
|
- baths - beds |
show details | |

|
#35
Whitehorn St
Romulus, MI 48174
|
- sq. feet
|
- baths - beds |
show details | |

|
#36
Mountain Way
Romulus, MI 48174
|
- sq. feet
|
- baths - beds |
show details | |

|
#37
W Maple St
Romulus, MI 48174
|
- sq. feet
|
- baths - beds |
show details | |

|
#38
Bruce St
Romulus, MI 48174
|
- sq. feet
|
- baths - beds |
show details | |

|
#39
Redwood Ln # 4
Romulus, MI 48174
|
- sq. feet
|
- baths - beds |
show details | |

|
#40
Garner St
Romulus, MI 48174
|
- sq. feet
|
- baths - beds |
show details |
| Photo | Address | Area | Beds / Baths | Price | Details |
|---|---|---|---|---|---|

|
#41
Pond Way
Romulus, MI 48174
|
- sq. feet
|
- baths - beds |
show details | |

|
#42
Letour St
Romulus, MI 48174
|
- sq. feet
|
- baths - beds |
show details | |

|
#43
N Maple St
Romulus, MI 48174
|
- sq. feet
|
- baths - beds |
show details | |

|
#44
El Paso Blvd
Romulus, MI 48174
|
- sq. feet
|
- baths - beds |
show details | |

|
#45
Garner St
Romulus, MI 48174
|
- sq. feet
|
- baths - beds |
show details | |

|
#46
Sonora Dr
Romulus, MI 48174
|
- sq. feet
|
- baths - beds |
show details | |

|
#47
Canyon Dr
Romulus, MI 48174
|
- sq. feet
|
- baths - beds |
show details | |

|
#48
Teaklane St
Romulus, MI 48174
|
- sq. feet
|
- baths - beds |
show details | |

|
#49
Pinewoods Cir Apt 206
Romulus, MI 48174
|
- sq. feet
|
- baths - beds |
show details | |

|
Check over 1 million property listings on Foreclosure.com!
|
browse all offers | |||

Latest news about housing in Romulus, MI collected exclusively by city-data.com from local newspapers, TV, and radio stations

 | Apartments close to Novi (10 replies) |
| Flint, MI (11 replies) |
| taxes in Romulus affecting sell of homes (7 replies) |
| More backlash at regional transit (48 replies) |
| The First Thing That Comes To Mind… (4 replies) |
| Looking for a condo/coop near DTW. Any recommendations? (8 replies) |

Median year apartment built: 1970
Household type by relationship:
Households: 24,709- Male householders: 3,863 (1,303 living alone), Female householders: 4,937 (1,201 living alone)
3,622 spouses (3,615 opposite-sex spouses), 530 unmarried partners, (530 opposite-sex unmarried partners), 8,612 children (7,904 natural, 70 adopted, 638 stepchildren), 1,444 grandchildren, 333 brothers or sisters, 309 parents, 0 foster children, 296 other relatives, 613 non-relatives
- In group quarters: 143
Size of family households: 2,427 2-persons, 1,462 3-persons, 1,215 4-persons, 529 5-persons, 147 6-persons, 193 7-or-more-persons.
Size of nonfamily households: 2,595 1-person, 206 2-persons, 110 3-persons, 9 4-persons, 7 6-persons.
3,200 married couples with children.
2,214 single-parent households (354 men, 1,860 women).
94.8% of residents of Romulus speak English at home.
2.0% of residents speak Spanish at home (72% speak English very well, 5% speak English well, 22% speak English not well).
0.9% of residents speak other Indo-European language at home (77% speak English very well, 20% speak English well, 3% speak English not well).
1.1% of residents speak Asian or Pacific Island language at home (28% speak English very well, 40% speak English well, 32% speak English not well).
0.5% of residents speak other language at home (79% speak English very well, 21% speak English well).
Foreign born population: 823 (3.3%)
(41.7% of them are naturalized citizens)
| Here: | 6.1 |
| State: | 6.5 |
| Here: | 4.6 |
| State: | 4.3 |

- Bedrooms in owner-occupied houses and condos in Romulus, Michigan
- 0no bedroom
- 831 bedroom
- 7102 bedrooms
- 3,7883 bedrooms
- 1,2524 bedrooms
- 1735+ bedrooms

- Bedrooms in renter-occupied apartments in Romulus, Michigan
- 64no bedroom
- 5591 bedroom
- 9582 bedrooms
- 1,0453 bedrooms
- 3124 bedrooms
- 175+ bedrooms

- Cars and other vehicles available in Romulus in owner-occupied houses/condos
- 234no vehicle
- 1,7141 vehicle
- 2,7002 vehicles
- 8993 vehicles
- 3004 vehicles
- 1595+ vehicles

- Cars and other vehicles available in Romulus in renter-occupied apartments
- 419no vehicle
- 1,7431 vehicle
- 5642 vehicles
- 973 vehicles
- 1334 vehicles
- 05+ vehicles

- Rooms in owner-occupied houses in Romulus, Michigan
- 01 room
- 212 rooms
- 1253 rooms
- 3594 rooms
- 1,4555 rooms
- 1,8846 rooms
- 1,0237 rooms
- 6108 rooms
- 5309+ rooms

- Rooms in renter-occupied apartments in Romulus, Michigan
- 641 room
- 142 rooms
- 6033 rooms
- 6654 rooms
- 5475 rooms
- 6276 rooms
- 1737 rooms
- 468 rooms
- 2189+ rooms


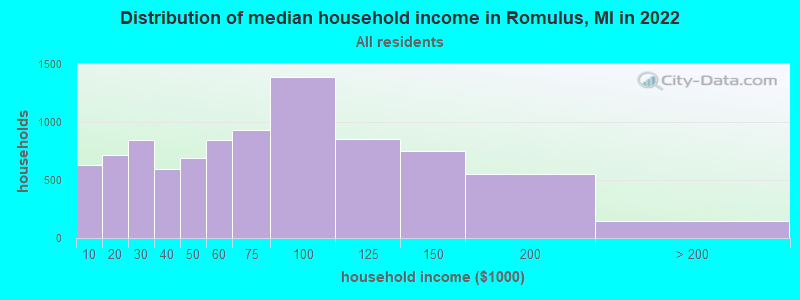
Romulus, MI household income distribution

- 633Less than $10,000
- 719$10,000 to $19,999
- 844$20,000 to $29,999
- 593$30,000 to $39,999
- 693$40,000 to $49,999
- 847$50,000 to $59,999
- 934$60,000 to $74,999
- 1,391$75,000 to $99,999
- 851$100,000 to $124,999
- 751$125,000 to $149,999
- 552$150,000 to $199,999
- 148$200,000 or more
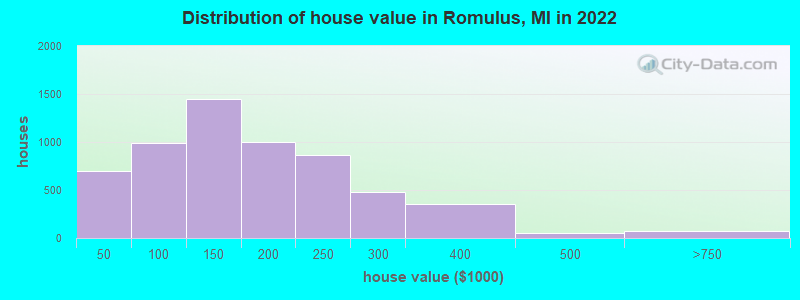
Home value of owner - occupied houses in 2022 in Romulus, MI
-
- 122Less than $10,000
- 3$10,000 to $14,999
- 30$15,000 to $19,999
- 141$20,000 to $24,999
- 48$25,000 to $29,999
- 114$30,000 to $34,999
- 53$35,000 to $39,999
- 182$40,000 to $49,999
- 132$50,000 to $59,999
- 144$60,000 to $69,999
- 136$70,000 to $79,999
- 254$80,000 to $89,999
- 142$90,000 to $99,999
- 552$100,000 to $124,999
- 900$125,000 to $149,999
- 653$150,000 to $174,999
- 345$175,000 to $199,999
- 864$200,000 to $249,999
- 482$250,000 to $299,999
- 354$300,000 to $399,999
- 49$400,000 to $499,999
- 64$500,000 to $749,999
- 6$750,000 to $999,999
Rent paid by renters in 2022 in Romulus, MI
-
- 9Less than $100
- 102$100 to $149
- 184$150 to $199
- 74$200 to $249
- 29$250 to $299
- 35$300 to $349
- 38$350 to $399
- 31$400 to $449
- 28$450 to $499
- 152$500 to $549
- 126$550 to $599
- 163$600 to $649
- 107$650 to $699
- 104$700 to $749
- 69$750 to $799
- 291$800 to $899
- 258$900 to $999
- 495$1,000 to $1,249
- 206$1,250 to $1,499
- 74$1,500 to $1,999
- 16$2,000 to $2,499
- 7$2,500 to $2,999
- 308No cash rent


Percentage of workers working in this county: 79.7%
Number of people working at home: 890 (8.6% of all workers)
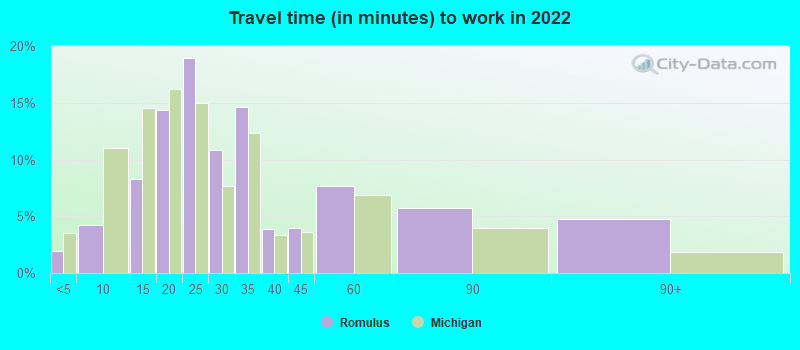
Travel time to work (commute)
- Less than 5 minutes: 534
- 5 to 9 minutes: 755
- 10 to 14 minutes: 916
- 15 to 19 minutes: 1,479
- 20 to 24 minutes: 1,474
- 25 to 29 minutes: 977
- 30 to 34 minutes: 1,371
- 35 to 39 minutes: 664
- 40 to 44 minutes: 348
- 45 to 59 minutes: 311
- 60 to 89 minutes: 365
- 90 or more minutes: 128
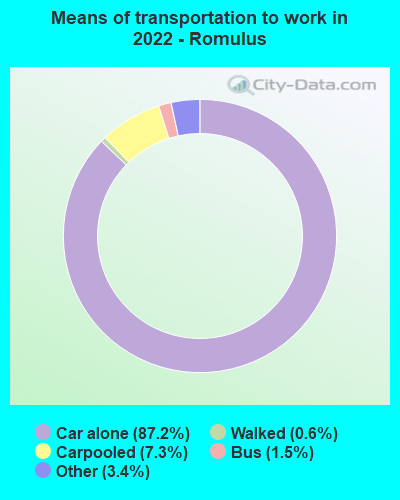
Means of transportation to work:
- Drove a car alone: 30,840 (82.4%)
- Carpooled: 2,541 (6.8%)
- Bus: 437 (1.2%)
- Long-distance train or commuter rail: 4 (0.0%)
- Taxi: 1,285 (3.4%)
- Bicycle: 1 (0.0%)
- Walked: 244 (0.7%)
- Worked at home: 890 (2.4%)

- Unemployment by race in 2022
- Unemployment rate for White non-Hispanic residents
- 4.5%Males
- 6.9%Females
- Unemployment rate for Black residents
- 16.7%Males
- 5.5%Females
- Unemployment rate for Asian residents
- 2.6%Females
- Unemployment rate for two or more race residents
- 4.9%Females

- Year of entry for the foreign-born population in Romulus, Michigan
- 1262010 or later
- 3292000 to 2009
- 1011990 to 1999
- 991980 to 1989
- 641970 to 1979
- 117Before 1970

First ancestries reported:
- American: 1,527 (10.7%)
- English: 606 (4.3%)
- Irish: 510 (3.6%)
- German: 493 (3.5%)
- African: 454 (3.2%)
- Polish: 378 (2.7%)
- European: 359 (2.5%)
- Italian: 306 (2.2%)
- French Canadian: 179 (1.3%)
- Hungarian: 157 (1.1%)
- Romanian: 153 (1.1%)
- Palestinian: 96 (0.7%)
- Nigerian: 77 (0.5%)
- Jamaican: 77 (0.5%)
- French: 60 (0.4%)
- Norwegian: 52 (0.4%)
- Scotch-Irish: 39 (0.3%)
- Eastern European: 12 (0.08%)
- Canadian: 9 (0.06%)
- Finnish: 9 (0.06%)
- Scottish: 7 (0.05%)
- Dutch: 6 (0.04%)
- Maltese: 6 (0.04%)
- Welsh: 5 (0.04%)
- British: 4 (0.03%)
- Yugoslavian: 4 (0.03%)
- Russian: 3 (0.02%)
Most common places of birth for foreign-born residents (%):
| Romulus: | 17.2% (138) |
| Michigan: | 10.9% (75,965) |
| Romulus: | 16.1% (129) |
| Michigan: | 1.8% (12,679) |
| Romulus: | 15.4% (124) |
| Michigan: | 0.1% (536) |
| Romulus: | 13.6% (109) |
| Michigan: | 0.1% (867) |
| Romulus: | 6.5% (52) |
| Michigan: | 0.7% (4,645) |
| Romulus: | 5.4% (43) |
| Michigan: | 0.9% (6,424) |
| Romulus: | 3.7% (30) |
| Michigan: | 0.9% (5,964) |
| Romulus: | 3.4% (27) |
| Michigan: | 0.2% (1,481) |
| Romulus: | 2.7% (22) |
| Michigan: | 8.1% (55,954) |
| Romulus: | 2.4% (19) |
| Michigan: | 11.1% (77,240) |
| Romulus: | 2.2% (18) |
| Michigan: | 1.2% (8,563) |
| Romulus: | 2.1% (17) |
| Michigan: | 5.0% (35,052) |
| Romulus: | 1.6% (13) |
| Michigan: | 0.9% (5,978) |
Place of birth for U.S.-born residents:
- This state: 21,453
- Other state: 2,315
- Northeast: 297
- Midwest: 435
- South: 1,271
- West: 319
92.2% of Romulus residents lived in the same house 1 years ago.
Out of people who lived in different houses, 44.7% lived in this county.
Out of people who lived in different counties, 81.7% lived in Michigan.
| Romulus: | 92.2% |
| State average: | 88.4% |
Education attainment for males 25 years and older:
- No schooling: 131
- Nursery to 4th grade: 0
- 5th and 6th grade: 0
- 7th and 8th grade: 79
- 9th grade: 98
- 10th grade: 210
- 11th grade: 204
- 12th grade, no diploma: 325
- High school graduate (or equivalency): 2,645
- Less than 1 year of college: 697
- Some college more than 1 year, no degree: 1,143
- Associate degree: 339
- Bachelor's degree: 802
- Master's degree: 327
- Professional school degree: 24
- Doctorate degree: 14

Education attainment for females 25 years and older:
- No schooling: 238
- Nursery to 4th grade: 36
- 5th and 6th grade: 56
- 7th and 8th grade: 40
- 9th grade: 31
- 10th grade: 177
- 11th grade: 189
- 12th grade, no diploma: 204
- High school graduate (or equivalency): 2,917
- Less than 1 year of college: 536
- Some college more than 1 year, no degree: 1,884
- Associate degree: 737
- Bachelor's degree: 914
- Master's degree: 470
- Professional school degree: 0
- Doctorate degree: 17


Housing units in structures:
- One, detached: 6,592
- One, attached: 575
- Two: 32
- 3 or 4: 51
- 5 to 9: 669
- 10 to 19: 346
- 20 to 49: 57
- 50 or more: 320
- Mobile homes: 1,067
Median worth of mobile homes: $37,378
Housing units lacking complete kitchen facilities in 2022: 2.0%
House/condo owner moved in on average 12 years ago
Renter moved in on average 5 years ago

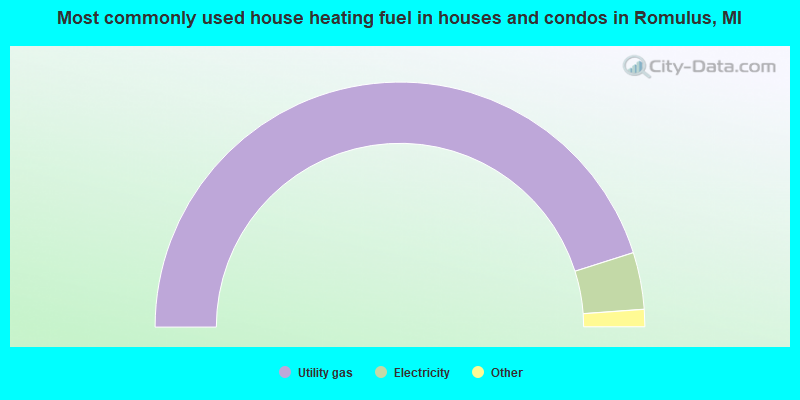
- 90.2%Utility gas
- 7.5%Electricity
- 1.2%Bottled, tank, or LP gas
- 0.9%Fuel oil, kerosene, etc.
- 0.2%Wood
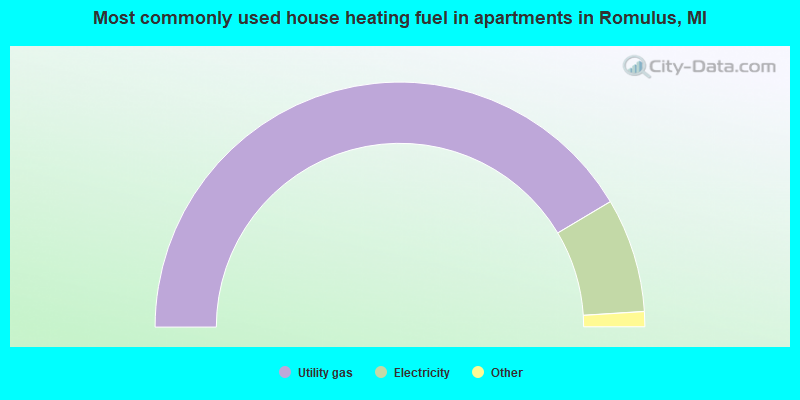
- 82.9%Utility gas
- 15.1%Electricity
- 1.0%Other fuel
- 0.8%No fuel used
Private vs. public school enrollment:
| Here: | 18.4% |
| Michigan: | 12.4% |
| Here: | 1.4% |
| Michigan: | 9.8% |
| Here: | 7.5% |
| Michigan: | 14.9% |


