Rosamond, CA (California) Houses and Residents
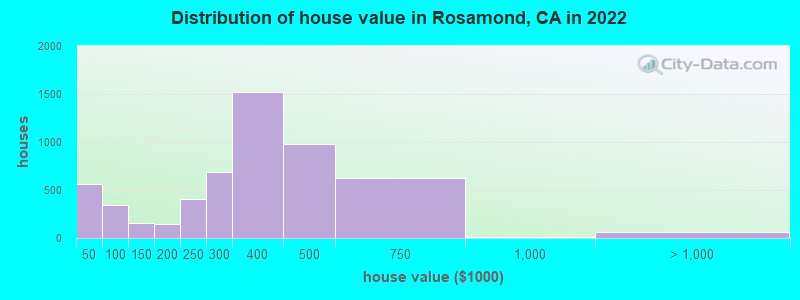
Estimated median house or condo value in 2022: $348,204 (it was $85,800 in 2000 )
Rosamond:
$348,204California:
$715,900
Lower value quartile - upper value quartile: $236,889 - $445,563Mean price in 2022: Detached houses: $379,913 Here:
$379,913State:
$988,808
Townhouses or other attached units: $269,589 Here:
$269,589State:
$838,546
Mobile homes: $168,926 Here:
$168,926State:
$184,506
Total population: 18,150 (Urban population: 12,095 (all inside urban clusters), Rural population: 2,367 (all nonfarm) )
Houses: 7,267 (6,673 occupied: 4,925 owner occupied, 1,791 renter occupied )
% of renters here:
27%State:
44%
Housing density: 139 houses/condos per square mile
Median price asked for vacant for-sale houses and condos in 2022: $284,259.
Median contract rent in 2022: $1,003 (lower quartile is $806, upper quartile is $1,391)
Median rent asked for vacant for-rent units in 2022: $1,293
Median gross rent in Rosamond, CA in 2022: $1,190
Housing units in Rosamond with a mortgage: 3,616 (216 second mortgage, 24 home equity loan, 108 both second mortgage and home equity loan )Houses without a mortgage: 0
Median household income for houses/condos with a mortgage: $96,918
Median household income for apartments without a mortgage: $71,555
Median monthly housing costs: $1,499
Data:
Median house or condo value ($)
Median house or condo value ($ change since 2000)
Median house or condo value ($) - White
Median house or condo value ($) - Black or African American
Median house or condo value ($) - Asian
Median house or condo value ($) - Hispanic or Latino
Median house or condo value ($) - American Indian and Alaska Native
Median house or condo value ($) - Multirace
Median house or condo value ($) - Other Race
Median price asked for mobile homes ($)
Household density (households per square mile)
Mean house or condo value by units in structure - 1, detached ($)
Mean house or condo value by units in structure - 1, attached ($)
Mean house or condo value by units in structure - 2 ($)
Mean house or condo value by units in structure by units in structure - 3 or 4 ($)
Mean house or condo value by units in structure - 5 or more ($)
Mean house or condo value by units in structure - Boat, RV, van, etc. ($)
Mean house or condo value by units in structure - Mobile home ($)
Median contract rent ($)
Median contract rent - Lower quartile ($)
Median contract rent - Upper quartile ($)
Median gross rent ($)
Urban houses (%)
Rural houses (%)
Houses occupied (%)
Houses occupied (% change since 2000)
Houses owner occupied (%)
Houses owner occupied (% change since 2000)
Houses renter occupied (%)
Houses renter occupied (% change since 2000)
Vacant housing units - For rent (%)
Vacant housing units - For rent (% change since 2000)
Vacant housing units - For sale only (%)
Vacant housing units - For sale only (% change since 2000)
Vacant housing units - Rented or sold, not occupied (%)
Vacant housing units - Rented or sold, not occupied (% change since 2000)
Vacant housing units - For seasonal, recreational, or occasional use (%)
Vacant housing units - For seasonal, recreational, or occasional use (% change since 2000)
Vacant housing units - For migrant workers (%)
Vacant housing units - For migrant workers (% change since 2000)
Vacant housing units - Other vacant (%)
Vacant housing units - Other vacant (% change since 2000)
Median monthly housing costs ($)
Median household income for houses/condos with a mortgage ($)
Median household income for houses/condos without a mortgage ($)
Median household income ($)
Median household income ($) - White
Median household income ($) - Black or African American
Median household income ($) - Asian
Median household income ($) - Hispanic or Latino
Median household income ($) - American Indian and Alaska Native
Median household income ($) - Multirace
Median household income ($) - Other Race
Mortgage status - with mortgage (%)
Mortgage status - with second mortgage (%)
Mortgage status - with home equity loan (%)
Mortgage status - with both second mortgage and home equity loan (%)
Mortgage status - without a mortgage (%)
Median year house/condo built
Median year apartment built
Household type by relationship - Male householder living alone (%)
Household type by relationship - Male householder not living alone (%)
Household type by relationship - Female householder living alone (%)
Household type by relationship - Female householder not living alone (%)
Household type by relationship - Opposite-Sex spouse (%)
Household type by relationship - Same-Sex spouse (%)
Household type by relationship - Opposite-Sex unmarried partner (%)
Household type by relationship - Same-Sex unmarried partner (%)
Household type by relationship - In group quarters (%)
Size of family households - 2-person household (%)
Size of family households - 3-person household (%)
Size of family households - 4-person household (%)
Size of family households - 5-person household (%)
Size of family households - 6-person household (%)
Size of family households - 7-or-more-person household (%)
Size of nonfamily households - 1-person household (%)
Size of nonfamily households - 2-person household (%)
Size of nonfamily households - 3-person household (%)
Size of nonfamily households - 4-person household (%)
Size of nonfamily households - 5-person household (%)
Size of nonfamily households - 6-person household (%)
Size of nonfamily households - 7-or-moreperson household (%)
Year house built - Built 2010 or later (%)
Year house built - Built 2000 to 2009 (%)
Year house built - Built 1990 to 1999 (%)
Year house built - Built 1980 to 1989 (%)
Year house built - Built 1970 to 1979 (%)
Year house built - Built 1960 to 1969 (%)
Year house built - Built 1950 to 1959 (%)
Year house built - Built 1940 to 1949 (%)
Year house built - Built 1939 or earlier (%)
Median number of rooms in houses and condos
Median number of rooms in apartments
Median number of bedrooms in owner occupied houses
Mean number of bedrooms in owner occupied houses
Median number of bedrooms in renter occupied houses
Mean number of bedrooms in renter occupied houses
Median number of vehichles in owner occupied houses
Mean number of vehichles in owner occupied houses
Median number of vehichles in renter occupied houses
Mean number of vehichles in renter occupied houses
Rooms in owner-occupied houses - 1 room (%)
Rooms in owner-occupied houses - 2 rooms (%)
Rooms in owner-occupied houses - 3 rooms (%)
Rooms in owner-occupied houses - 4 rooms (%)
Rooms in owner-occupied houses - 5 rooms (%)
Rooms in owner-occupied houses - 6 rooms (%)
Rooms in owner-occupied houses - 7 rooms (%)
Rooms in owner-occupied houses - 8 rooms (%)
Rooms in owner-occupied houses - 9+ rooms (%)
Rooms in renter-occupied houses - 1 room (%)
Rooms in renter-occupied houses - 2 rooms (%)
Rooms in renter-occupied houses - 3 rooms (%)
Rooms in renter-occupied houses - 4 rooms (%)
Rooms in renter-occupied houses - 5 rooms (%)
Rooms in renter-occupied houses - 6 rooms (%)
Rooms in renter-occupied houses - 7 rooms (%)
Rooms in renter-occupied houses - 8 rooms (%)
Rooms in renter-occupied houses - 9+ rooms (%)
Bedrooms in owner-occupied houses - no bedrooms (%)
Bedrooms in owner-occupied houses - 1 bedroom (%)
Bedrooms in owner-occupied houses - 2 bedrooms (%)
Bedrooms in owner-occupied houses - 3 bedrooms (%)
Bedrooms in owner-occupied houses - 4 bedrooms (%)
Bedrooms in owner-occupied houses - 5+ bedrooms (%)
Bedrooms in renter-occupied houses - no bedrooms (%)
Bedrooms in renter-occupied houses - 1 bedroom (%)
Bedrooms in renter-occupied houses - 2 bedrooms (%)
Bedrooms in renter-occupied houses - 3 bedrooms (%)
Bedrooms in renter-occupied houses - 4 bedrooms (%)
Bedrooms in renter-occupied houses - 5+ bedrooms (%)
Vehicles available in owner-occupied houses - no vehicle available (%)
Vehicles available in owner-occupied houses - 1 vehicle available(%)
Vehicles available in owner-occupied houses - 2 Vehicles available (%)
Vehicles available in owner-occupied houses - 3 Vehicles available (%)
Vehicles available in owner-occupied houses - 4 Vehicles available (%)
Vehicles available in owner-occupied houses - 5+ Vehicles available (%)
Vehicles available in renter-occupied houses - no vehicle available (%)
Vehicles available in renter-occupied houses - 1 vehicle available (%)
Vehicles available in renter-occupied houses - 2 Vehicles available (%)
Vehicles available in renter-occupied houses - 3 Vehicles available (%)
Vehicles available in renter-occupied houses - 4 Vehicles available (%)
Vehicles available in renter-occupied houses - 5+ Vehicles available (%)
Housing units in structures - 1, detached (%)
Housing units in structures - 1, attached (%)
Housing units in structures - 2 (%)
Housing units in structures - 3 or 4 (%)
Housing units in structures - 5 to 9 (%)
Housing units in structures - 10 to 19 (%)
Housing units in structures - 20 to 49 (%)
Housing units in structures - 50 or more (%)
Housing units in structures - Mobile home (%)
Housing units in structures - Boat, RV, van, etc. (%)
Housing units in structures - Owners - 1, detached (%)
Housing units in structures - Owners - 1, attached (%)
Housing units in structures - Owners - 2 (%)
Housing units in structures - Owners - 3 or 4 (%)
Housing units in structures - Owners - 5 to 9 (%)
Housing units in structures - Owners - 10 to 19 (%)
Housing units in structures - Owners - 20 to 49 (%)
Housing units in structures - Owners - 50 or more (%)
Housing units in structures - Owners - Mobile home (%)
Housing units in structures - Owners - Boat, RV, van, etc. (%)
Housing units in structures - Renters - 1, detached (%)
Housing units in structures - Renters - 1, attached (%)
Housing units in structures - Renters - 2 (%)
Housing units in structures - Renters - 3 or 4 (%)
Housing units in structures - Renters - 5 to 9 (%)
Housing units in structures - Renters - 10 to 19 (%)
Housing units in structures - Renters - 20 to 49 (%)
Housing units in structures - Renters - 50 or more (%)
Housing units in structures - Renters - Mobile home (%)
Housing units in structures - Renters - Boat, RV, van, etc. (%)
House/condo owner moved in on average (years ago)
Renter moved in on average (years ago)
Year householder moved into unit - Moved in 1999 to March 2000 (%)
Year householder moved into unit - Moved in 1999 to March 2000 (%) - White
Year householder moved into unit - Moved in 1999 to March 2000 (%) - Black or African American
Year householder moved into unit - Moved in 1999 to March 2000 (%) - Asian
Year householder moved into unit - Moved in 1999 to March 2000 (%) - Hispanic or Latino
Year householder moved into unit - Moved in 1999 to March 2000 (%) - American Indian and Alaska Native
Year householder moved into unit - Moved in 1999 to March 2000 (%) - Multirace
Year householder moved into unit - Moved in 1999 to March 2000 (%) - Other Race
Year householder moved into unit - Moved in 1995 to 1998 (%)
Year householder moved into unit - Moved in 1995 to 1998 (%) - White
Year householder moved into unit - Moved in 1995 to 1998 (%) - Black or African American
Year householder moved into unit - Moved in 1995 to 1998 (%) - Asian
Year householder moved into unit - Moved in 1995 to 1998 (%) - Hispanic or Latino
Year householder moved into unit - Moved in 1995 to 1998 (%) - American Indian and Alaska Native
Year householder moved into unit - Moved in 1995 to 1998 (%) - Multirace
Year householder moved into unit - Moved in 1995 to 1998 (%) - Other Race
Year householder moved into unit - Moved in 1990 to 1994 (%)
Year householder moved into unit - Moved in 1990 to 1994 (%) - White
Year householder moved into unit - Moved in 1990 to 1994 (%) - Black or African American
Year householder moved into unit - Moved in 1990 to 1994 (%) - Asian
Year householder moved into unit - Moved in 1990 to 1994 (%) - Hispanic or Latino
Year householder moved into unit - Moved in 1990 to 1994 (%) - American Indian and Alaska Native
Year householder moved into unit - Moved in 1990 to 1994 (%) - Multirace
Year householder moved into unit - Moved in 1990 to 1994 (%) - Other Race
Year householder moved into unit - Moved in 1980 to 1989 (%)
Year householder moved into unit - Moved in 1980 to 1989 (%) - White
Year householder moved into unit - Moved in 1980 to 1989 (%) - Black or African American
Year householder moved into unit - Moved in 1980 to 1989 (%) - Asian
Year householder moved into unit - Moved in 1980 to 1989 (%) - Hispanic or Latino
Year householder moved into unit - Moved in 1980 to 1989 (%) - American Indian and Alaska Native
Year householder moved into unit - Moved in 1980 to 1989 (%) - Multirace
Year householder moved into unit - Moved in 1980 to 1989 (%) - Other Race
Year householder moved into unit - Moved in 1970 to 1979 (%)
Year householder moved into unit - Moved in 1970 to 1979 (%) - White
Year householder moved into unit - Moved in 1970 to 1979 (%) - Black or African American
Year householder moved into unit - Moved in 1970 to 1979 (%) - Asian
Year householder moved into unit - Moved in 1970 to 1979 (%) - Hispanic or Latino
Year householder moved into unit - Moved in 1970 to 1979 (%) - American Indian and Alaska Native
Year householder moved into unit - Moved in 1970 to 1979 (%) - Multirace
Year householder moved into unit - Moved in 1970 to 1979 (%) - Other Race
Year householder moved into unit - Moved in 1969 or earlier (%)
Year householder moved into unit - Moved in 1969 or earlier (%) - White
Year householder moved into unit - Moved in 1969 or earlier (%) - Black or African American
Year householder moved into unit - Moved in 1969 or earlier (%) - Asian
Year householder moved into unit - Moved in 1969 or earlier (%) - Hispanic or Latino
Year householder moved into unit - Moved in 1969 or earlier (%) - American Indian and Alaska Native
Year householder moved into unit - Moved in 1969 or earlier (%) - Multirace
Year householder moved into unit - Moved in 1969 or earlier (%) - Other Race
Housing units lacking complete plumbing facilities (%)
Housing units lacking complete kitchen facilities (%)
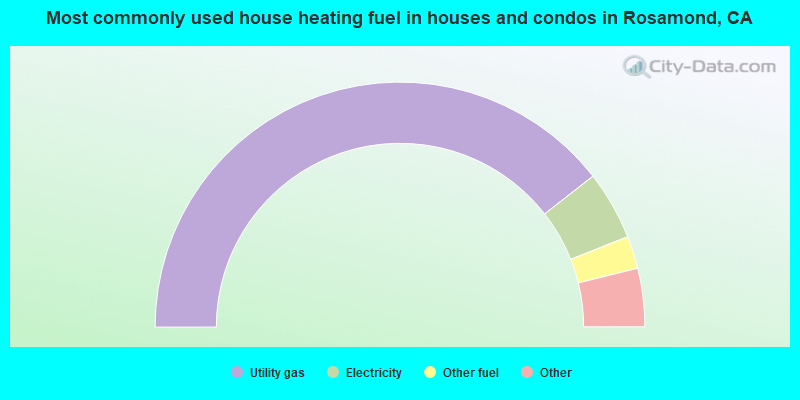
House heating fuel used in houses and condos - Utility gas (%)
House heating fuel used in houses and condos - Bottled, tank, or LP gas (%)
House heating fuel used in houses and condos - Electricity (%)
House heating fuel used in houses and condos - Fuel oil, kerosene, etc. (%)
House heating fuel used in houses and condos - Coal or coke (%)
House heating fuel used in houses and condos - Wood (%)
House heating fuel used in houses and condos - Solar energy (%)
House heating fuel used in houses and condos - Other fuel (%)
House heating fuel used in houses and condos - No fuel used (%)
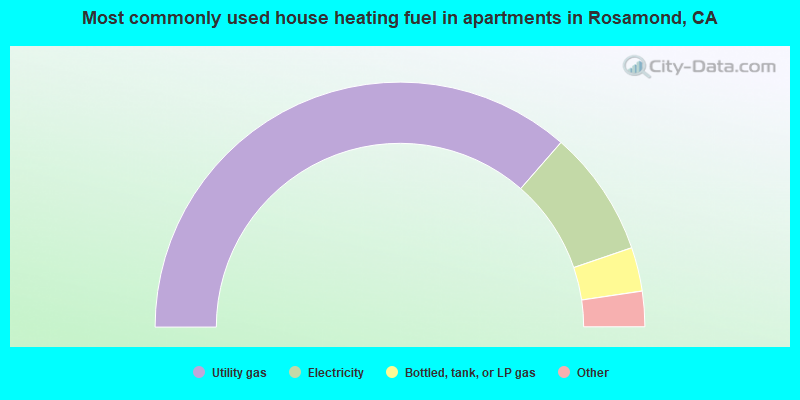
House heating fuel used in apartments - Utility gas (%)
House heating fuel used in apartments - Bottled, tank, or LP gas (%)
House heating fuel used in apartments - Electricity (%)
House heating fuel used in apartments - Fuel oil, kerosene, etc. (%)
House heating fuel used in apartments - Coal or coke (%)
House heating fuel used in apartments - Wood (%)
House heating fuel used in apartments - Solar energy (%)
House heating fuel used in apartments - Other fuel (%)
House heating fuel used in apartments - No fuel used (%)
Latest news about housing in Rosamond, CA collected exclusively by city-data.com from local newspapers, TV, and radio stations
Median year house/condo built: 1996Median year apartment built: 1987Household type by relationship:
Households: 20,864
Male householders: 3,507 (774 living alone ), Female householders: 3,134 (420 living alone )3,448 spouses (3,432 opposite-sex spouses ), 611 unmarried partners , (611 opposite-sex unmarried partners ), 7,622 children (7,167 natural , 80 adopted , 374 stepchildren ), 759 grandchildren , 123 brothers or sisters , 343 parents , 0 foster children , 723 other relatives , 578 non-relatives In group quarters: 11
Size of family households: 1,636 2-persons , 1,336 3-persons , 780 4-persons , 472 5-persons , 367 6-persons , 338 7-or-more-persons .
Size of nonfamily households: 1,196 1-person , 475 2-persons , 125 3-persons , 36 4-persons .
3,899 married couples with children. single-parent households (200 men , 1,329 women ).
65.2% of residents of Rosamond speak English at home. of residents speak Spanish at home (69% speak English very well , 12% speak English well , 12% speak English not well , 7% don't speak English at all ).of residents speak other Indo-European language at home (98% speak English very well , 2% speak English well ).of residents speak Asian or Pacific Island language at home (62% speak English very well , 36% speak English well , 2% speak English not well ).of residents speak other language at home (100% speak English very well ).
Foreign born population: 2,080 (10.0%)of them are naturalized citizens )
Median number of rooms in houses and condos:
Median number of rooms in apartments
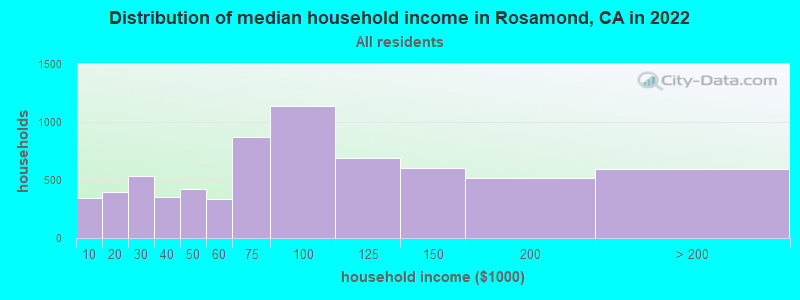
Rosamond, CA household income distribution 345 Less than $10,000395 $10,000 to $19,999533 $20,000 to $29,999350 $30,000 to $39,999426 $40,000 to $49,999336 $50,000 to $59,999869 $60,000 to $74,9991,140 $75,000 to $99,999690 $100,000 to $124,999600 $125,000 to $149,999517 $150,000 to $199,999593 $200,000 or more
Home value of owner - occupied houses in 2022 in Rosamond, CA 60 Less than $10,00028 $10,000 to $14,9998 $15,000 to $19,999211 $20,000 to $24,99935 $25,000 to $29,9998 $35,000 to $39,999206 $40,000 to $49,99945 $60,000 to $69,99931 $70,000 to $79,99928 $80,000 to $89,99930 $90,000 to $99,99990 $100,000 to $124,99964 $125,000 to $149,99940 $150,000 to $174,999105 $175,000 to $199,999408 $200,000 to $249,999688 $250,000 to $299,9991,521 $300,000 to $399,999978 $400,000 to $499,999620 $500,000 to $749,99910 $750,000 to $999,99914 $1,000,000 to $1,499,99947 $2,000,000 or moreRent paid by renters in 2022 in Rosamond, CA 36 $450 to $49976 $500 to $54932 $550 to $59973 $600 to $64934 $650 to $69976 $700 to $74959 $750 to $799155 $800 to $899273 $900 to $999302 $1,000 to $1,249179 $1,250 to $1,499323 $1,500 to $1,99922 $2,000 to $2,499102 No cash rent
Percentage of workers working in this county: 48.7%Number of people working at home: 627 (7.1% of all workers )
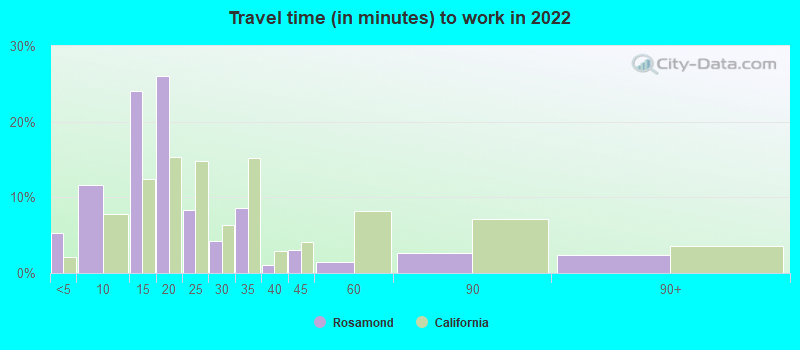
Travel time to work (commute)
Less than 5 minutes: 1645 to 9 minutes: 27710 to 14 minutes: 43615 to 19 minutes: 56820 to 24 minutes: 2,45425 to 29 minutes: 1,08230 to 34 minutes: 1,76335 to 39 minutes: 24240 to 44 minutes: 24345 to 59 minutes: 6360 to 89 minutes: 61690 or more minutes: 494
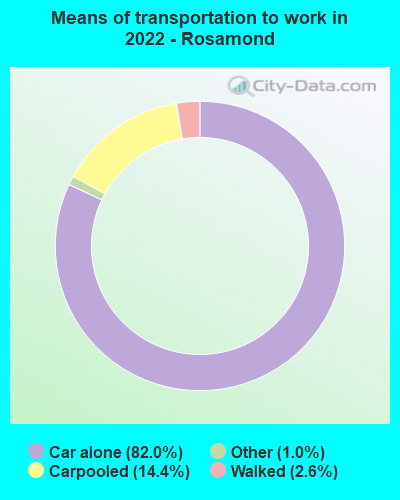
Means of transportation to work:
Drove a car alone: 1,755 (64.6%)Carpooled: 308 (11.3%)Taxi: 27 (1.0%)Walked: 62 (2.3%)Worked at home: 627 (23.1%)
Unemployment by race in 2022
Unemployment rate for White non-Hispanic residents 4.2% Males6.1% FemalesUnemployment rate for Black residents 20.4% Males20.3% FemalesUnemployment rate for Asian residents 5.6% FemalesUnemployment rate for other race residents 4.7% Males5.8% FemalesUnemployment rate for two or more race residents 18.0% Males2.2% FemalesUnemployment rate for Hispanic or Latino residents 7.7% Males3.6% Females
Year of entry for the foreign-born population in Rosamond, California
137 2010 or later 386 2000 to 2009 638 1990 to 1999 599 1980 to 1989 591 1970 to 1979 272 Before 1970
First ancestries reported:
English: 464 (4.2%)
German: 455 (4.2%)
American: 422 (3.9%)
European: 272 (2.5%)
Norwegian: 192 (1.8%)
Irish: 168 (1.5%)
African: 122 (1.1%)
Italian: 101 (0.9%)
Armenian: 87 (0.8%)
British: 78 (0.7%)
French Canadian: 64 (0.6%)
Ethiopian: 40 (0.4%)
Portuguese: 35 (0.3%)
French: 28 (0.3%)
Russian: 27 (0.2%)
Nigerian: 27 (0.2%)
Scottish: 23 (0.2%)
Danish: 22 (0.2%)
Czech: 21 (0.2%)
Dutch: 20 (0.2%)
Hungarian: 19 (0.2%)
Lebanese: 17 (0.2%)
Swedish: 12 (0.1%)
Celtic: 10 (0.09%)
Slavic: 10 (0.09%)
Romanian: 7 (0.06%)
Lithuanian: 6 (0.05%)
Welsh: 6 (0.05%)
Northern European: 4 (0.04%) Most common places of birth for foreign-born residents (%): Mexico Rosamond:
55.5% (1,178)California:
37.2% (3,881,193)
El Salvador Rosamond:
6.7% (143)California:
4.2% (440,287)
Peru Rosamond:
6.3% (134)California:
0.7% (74,025)
Philippines Rosamond:
3.9% (83)California:
7.8% (818,297)
Guatemala Rosamond:
3.5% (74)California:
2.8% (290,436)
Germany Rosamond:
3.1% (65)California:
0.7% (73,304)
Cuba Rosamond:
2.4% (52)California:
0.3% (30,441)
Spain Rosamond:
2.1% (45)California:
0.2% (16,586)
Japan Rosamond:
2.0% (43)California:
1.0% (103,575)
Ethiopia Rosamond:
1.8% (38)California:
0.2% (24,635)
Sierra Leone Rosamond:
1.6% (33)California:
0.0% (2,618)
Place of birth for U.S.-born residents:
This state: 14,915Other state: 3,385Northeast: 564Midwest: 848South: 924West: 1,076 93.1% of Rosamond residents lived in the same house 1 years ago.
Out of people who lived in different houses, 20.7% lived in this county.
Out of people who lived in different counties, 87.8% lived in California.
Rosamond:
93.1%State average:
88.9%
Education attainment for males 25 years and older:
No schooling: 188Nursery to 4th grade: 1095th and 6th grade: 1387th and 8th grade: 1619th grade: 010th grade: 3011th grade: 13312th grade, no diploma: 339High school graduate (or equivalency): 2,352Less than 1 year of college: 467Some college more than 1 year, no degree: 1,031Associate degree: 604Bachelor's degree: 696Master's degree: 452Professional school degree: 45Doctorate degree: 11
Education attainment for females 25 years and older:
No schooling: 312Nursery to 4th grade: 515th and 6th grade: 1317th and 8th grade: 1139th grade: 010th grade: 5611th grade: 13212th grade, no diploma: 229High school graduate (or equivalency): 1,930Less than 1 year of college: 426Some college more than 1 year, no degree: 846Associate degree: 565Bachelor's degree: 827Master's degree: 404Professional school degree: 57Doctorate degree: 14
Housing units in structures:
One, detached: 4,723One, attached: 152Two: 963 or 4: 1655 to 9: 16410 to 19: 15920 to 49: 5650 or more: 76Mobile homes: 1,672Median worth of mobile homes: $50,481
Housing units lacking complete plumbing facilities in 2022: 4.0%Housing units lacking complete kitchen facilities in 2022: 3.5%House/condo owner moved in on average 7 years ago
Renter moved in on average 5 years ago
Private vs. public school enrollment:
Students in private schools in grades 1 to 8 (elementary and middle school): 319 Here:
11.2%California:
10.5%
Students in private schools in grades 9 to 12 (high school): 109 Students in private undergraduate colleges: 82 Here:
9.0%California:
15.9%