Roseland, CA (California) Houses and Residents
| Roseland: | $531,734 |
| California: | $715,900 |
Total population: 6,325 (All urban)
Houses: 1,859 (1,793 occupied: 1,115 owner occupied, 659 renter occupied)
| % of renters here: | 37% |
| State: | 44% |
Housing density: 1,761 houses/condos per square mile
Median price asked for vacant for-sale houses and condos in 2022 in this county: $439,673.
Median contract rent in 2022: $1,761 (lower quartile is $1,278, upper quartile is over $2,000)
Median rent asked for vacant for-rent units in 2022: $1,759
Median gross rent in Roseland, CA in 2022: $1,891
Housing units in Roseland with a mortgage: 746 (20 second mortgage, 42 home equity loan, 0 both second mortgage and home equity loan)
Houses without a mortgage: 373
Median household income for houses/condos with a mortgage: $122,579
Median monthly housing costs: $1,897


Latest news about housing in Roseland, CA collected exclusively by city-data.com from local newspapers, TV, and radio stations

 | Is Santa Rosa a good place to live? (4 replies) |
| Things You Should Know Before Moving to Sonoma County (49 replies) |
| Was West Windsor, Sonoma County dangerous at one point? (2 replies) |
| Looking at Roseland, (2 replies) |
| Considering Oakmont Village in Santa Rosa.............. (9 replies) |
| Does LA feel like the 2nd biggest city in America to you? (256 replies) |

Median year apartment built: 1975
Household type by relationship:
Households: 5,754- In family households: 4,924 (822 male householders, 360 female householders)
817 spouses, 1,994 children (1,914 natural, 12 adopted, 68 stepchildren), 110 grandchildren, 225 brothers or sisters, 116 parents, 9 foster children, 198 other relatives, 278 non-relatives
- In nonfamily households: 782 (266 male householders (182 living alone)), 290 female householders (219 living alone)), 224 nonrelatives
- In group quarters: 47
Size of family households: 329 2-persons, 109 3-persons, 412 4-persons, 192 5-persons, 81 6-persons, 80 7-or-more-persons.
Size of nonfamily households: 418 1-person, 136 2-persons, 35 3-persons.
1,023 married couples with children.
221 single-parent households (112 men, 109 women).
45.9% of residents of Roseland speak English at home.
45.5% of residents speak Spanish at home (47% speak English very well, 34% speak English well, 12% speak English not well, 6% don't speak English at all).
2.4% of residents speak other Indo-European language at home (100% speak English very well).
2.9% of residents speak Asian or Pacific Island language at home (18% speak English very well, 34% speak English well, 42% speak English not well, 7% don't speak English at all).
0.7% of residents speak other language at home (100% speak English well).
Foreign born population: 1,860 (32.0%)
(40.2% of them are naturalized citizens)
| Here: | 5.3 |
| State: | 6.0 |
| Here: | 4.4 |
| State: | 3.9 |

- Bedrooms in owner-occupied houses and condos in Roseland, California
- 13no bedroom
- 721 bedroom
- 1662 bedrooms
- 7053 bedrooms
- 1394 bedrooms
- 215+ bedrooms

- Bedrooms in renter-occupied apartments in Roseland, California
- 11no bedroom
- 241 bedroom
- 3302 bedrooms
- 2683 bedrooms
- 274 bedrooms
- 05+ bedrooms

- Cars and other vehicles available in Roseland in owner-occupied houses/condos
- 68no vehicle
- 2001 vehicle
- 4792 vehicles
- 1683 vehicles
- 1374 vehicles
- 645+ vehicles

- Cars and other vehicles available in Roseland in renter-occupied apartments
- 66no vehicle
- 1681 vehicle
- 2762 vehicles
- 1023 vehicles
- 474 vehicles
- 05+ vehicles

- Rooms in owner-occupied houses in Roseland, California
- 131 room
- 232 rooms
- 183 rooms
- 2434 rooms
- 3495 rooms
- 1826 rooms
- 1227 rooms
- 898 rooms
- 769+ rooms

- Rooms in renter-occupied apartments in Roseland, California
- 01 room
- 352 rooms
- 1283 rooms
- 1494 rooms
- 2485 rooms
- 646 rooms
- 357 rooms
- 08 rooms
- 09+ rooms


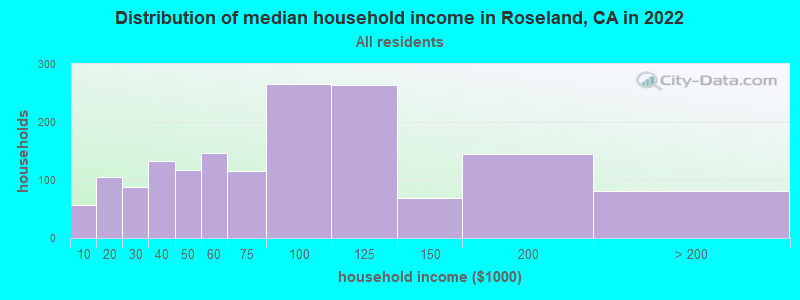
Roseland, CA household income distribution

- 57Less than $10,000
- 105$10,000 to $19,999
- 88$20,000 to $29,999
- 132$30,000 to $39,999
- 118$40,000 to $49,999
- 147$50,000 to $59,999
- 115$60,000 to $74,999
- 266$75,000 to $99,999
- 264$100,000 to $124,999
- 69$125,000 to $149,999
- 144$150,000 to $199,999
- 81$200,000 or more
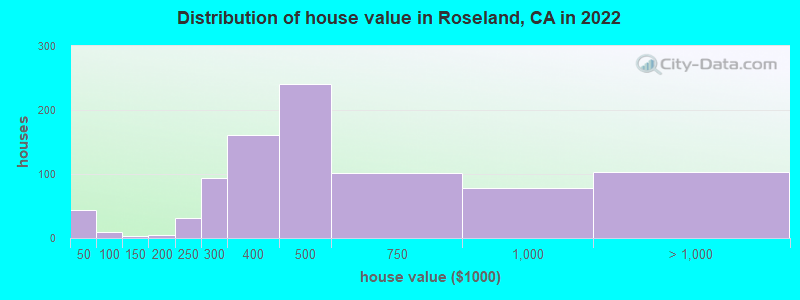
Home value of owner - occupied houses in 2022 in Roseland, CA
-
- 12Less than $10,000
- 14$10,000 to $14,999
- 5$25,000 to $29,999
- 12$35,000 to $39,999
- 10$50,000 to $59,999
- 2$125,000 to $149,999
- 5$175,000 to $199,999
- 32$200,000 to $249,999
- 93$250,000 to $299,999
- 160$300,000 to $399,999
- 240$400,000 to $499,999
- 101$500,000 to $749,999
- 77$750,000 to $999,999
- 64$1,000,000 to $1,499,999
- 38$2,000,000 or more
Rent paid by renters in 2022 in Roseland, CA
-
- 6$200 to $249
- 9$400 to $449
- 7$550 to $599
- 7$700 to $749
- 4$750 to $799
- 22$900 to $999
- 152$1,000 to $1,249
- 46$1,250 to $1,499
- 215$1,500 to $1,999
- 55$2,000 to $2,499
- 38$2,500 to $2,999
- 10No cash rent


Percentage of workers working in this county: 89.8%
Number of people working at home: 195 (6.4% of all workers)
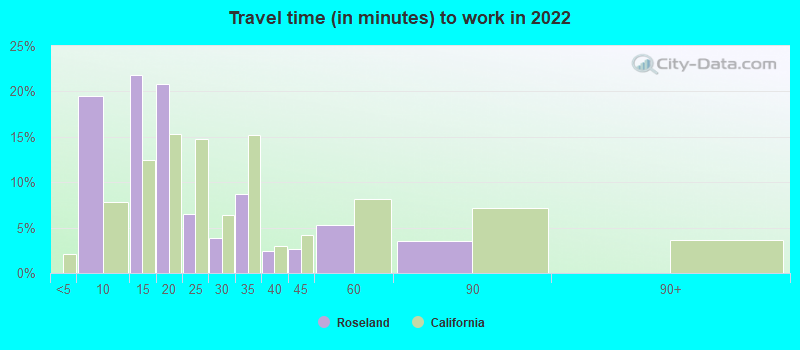
Travel time to work (commute)
- Less than 5 minutes: 63
- 5 to 9 minutes: 372
- 10 to 14 minutes: 624
- 15 to 19 minutes: 345
- 20 to 24 minutes: 463
- 25 to 29 minutes: 109
- 30 to 34 minutes: 311
- 35 to 39 minutes: 15
- 40 to 44 minutes: 15
- 45 to 59 minutes: 93
- 60 to 89 minutes: 138
- 90 or more minutes: 103
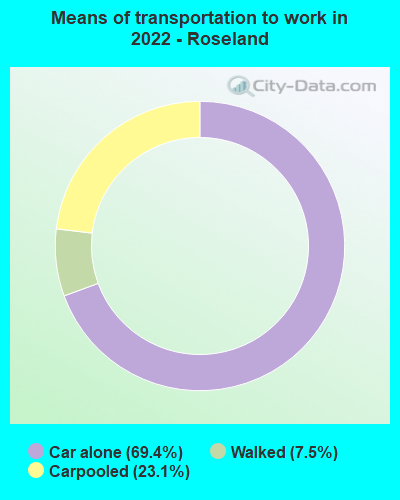
Means of transportation to work:
- Drove a car alone: 606 (60.0%)
- Carpooled: 191 (18.9%)
- Walked: 60 (5.9%)
- Worked at home: 191 (18.9%)

- Unemployment by race in 2022
- Unemployment rate for White non-Hispanic residents
- 6.1%Males
- 8.6%Females
- Unemployment rate for Black residents
- 2.6%Males
- Unemployment rate for American Indian and Alaska Native residents
- 13.1%Males
- Unemployment rate for Asian residents
- 10.4%Males
- Unemployment rate for other race residents
- 5.5%Males
- 3.9%Females
- Unemployment rate for Hispanic or Latino residents
- 2.4%Males
- 2.7%Females

- Year of entry for the foreign-born population in Roseland, California
- 4802010 or later
- 3452000 to 2009
- 6721990 to 1999
- 8281980 to 1989
- 1321970 to 1979
- 56Before 1970
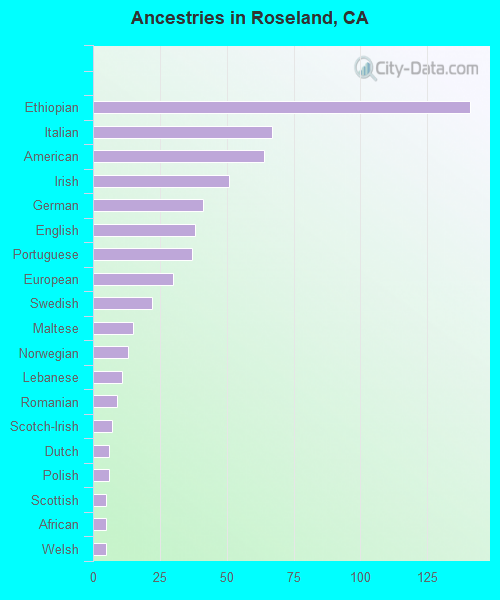
First ancestries reported:
- Ethiopian: 141 (3.9%)
- Italian: 67 (1.9%)
- American: 64 (1.8%)
- Irish: 51 (1.4%)
- German: 41 (1.1%)
- English: 38 (1.1%)
- Portuguese: 37 (1.0%)
- European: 30 (0.8%)
- Swedish: 22 (0.6%)
- Maltese: 15 (0.4%)
- Norwegian: 13 (0.4%)
- Lebanese: 11 (0.3%)
- Romanian: 9 (0.3%)
- Scotch-Irish: 7 (0.2%)
- Dutch: 6 (0.2%)
- Polish: 6 (0.2%)
- Scottish: 5 (0.1%)
- African: 5 (0.1%)
- Welsh: 5 (0.1%)
Most common places of birth for foreign-born residents (%):
| Roseland: | 76.2% (1,433) |
| California: | 100.0% (-1) |
| Roseland: | 4.8% (90) |
| California: | 100.0% (-1) |
| Roseland: | 3.9% (73) |
| California: | 100.0% (-1) |
| Roseland: | 2.0% (37) |
| California: | 100.0% (-1) |
Place of birth for U.S.-born residents:
- This state: 3,339
- Other state: 577
- Northeast: 149
- Midwest: 140
- South: 105
- West: 184
89.2% of Roseland residents lived in the same house 1 years ago.
Out of people who lived in different houses, 37.5% lived in this county.
Out of people who lived in different counties, 63.0% lived in California.
| Roseland: | 89.2% |
| State average: | 88.9% |
Education attainment for males 25 years and older:
- No schooling: 221
- Nursery to 4th grade: 64
- 5th and 6th grade: 135
- 7th and 8th grade: 48
- 9th grade: 81
- 10th grade: 31
- 11th grade: 27
- 12th grade, no diploma: 100
- High school graduate (or equivalency): 636
- Less than 1 year of college: 173
- Some college more than 1 year, no degree: 189
- Associate degree: 136
- Bachelor's degree: 62
- Master's degree: 83
- Professional school degree: 0
- Doctorate degree: 0

Education attainment for females 25 years and older:
- No schooling: 184
- Nursery to 4th grade: 16
- 5th and 6th grade: 27
- 7th and 8th grade: 14
- 9th grade: 64
- 10th grade: 44
- 11th grade: 53
- 12th grade, no diploma: 54
- High school graduate (or equivalency): 378
- Less than 1 year of college: 81
- Some college more than 1 year, no degree: 210
- Associate degree: 204
- Bachelor's degree: 330
- Master's degree: 109
- Professional school degree: 9
- Doctorate degree: 23


Housing units in structures:
- One, detached: 1,298
- One, attached: 224
- Two: 72
- 3 or 4: 91
- 5 to 9: 11
- 10 to 19: 75
- Mobile homes: 85
Median worth of mobile homes: $23,934
Housing units lacking complete kitchen facilities in 2022: 1.5%
House/condo owner moved in on average 12 years ago
Renter moved in on average 7 years ago

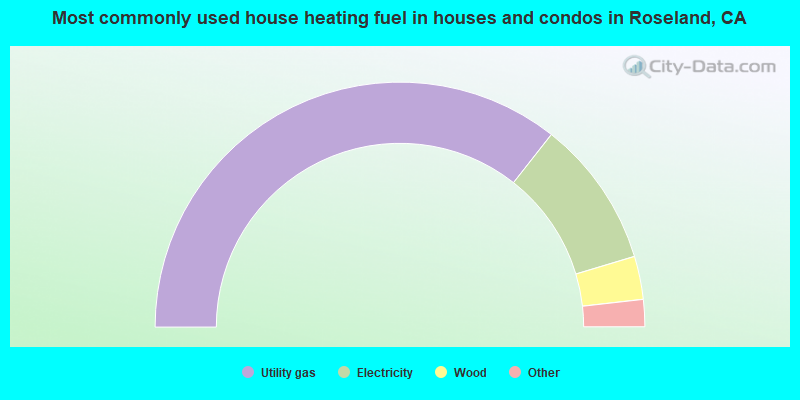
- 71.3%Utility gas
- 19.5%Electricity
- 5.7%Wood
- 2.5%Solar energy
- 1.0%No fuel used
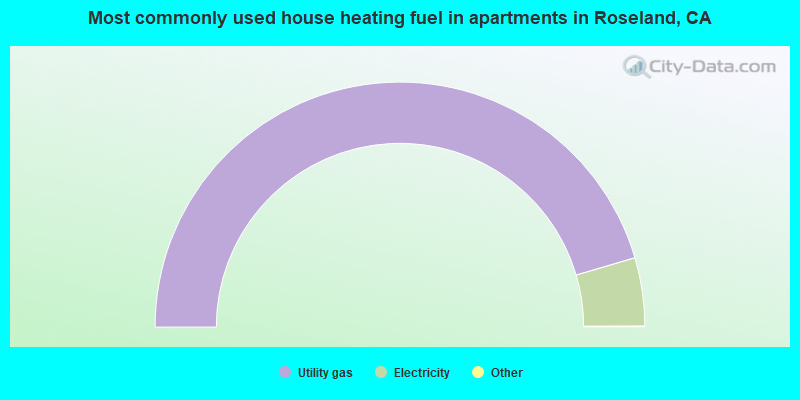
- 91.0%Utility gas
- 9.0%Electricity
Private vs. public school enrollment:
| Here: | 6.4% |
| California: | 10.5% |
| Here: | 4.2% |
| California: | 8.5% |
| Here: | 5.0% |
| California: | 15.9% |


