Roselle, IL (Illinois) Houses and Residents
| Roselle: | $304,268 |
| Illinois: | $251,600 |
Mean price in 2022:
Detached houses: $381,908
Here: $381,908 State: $310,164 Townhouses or other attached units: $251,154
Here: $251,154 State: $286,230 In 3-to-4-unit structures: $214,798
Here: $214,798 State: $330,907 In 5-or-more-unit structures: $199,081
Here: $199,081 State: $318,887
Total population: 23,030 (All urban)
Houses: 8,945 (8,712 occupied: 6,804 owner occupied, 1,916 renter occupied)
| % of renters here: | 22% |
| State: | 33% |
Housing density: 1,664 houses/condos per square mile
Median price asked for vacant for-sale houses and condos in 2022: $229,674.
Median contract rent in 2022: $1,359 (lower quartile is $1,069, upper quartile is $1,709)
Median rent asked for vacant for-rent units in 2022: $1,684
Median gross rent in Roselle, IL in 2022: $1,411
Housing units in Roselle with a mortgage: 4,849 (518 second mortgage, 0 home equity loan, 328 both second mortgage and home equity loan)
Houses without a mortgage: 127
Median household income for houses/condos with a mortgage: $122,764
Median household income for apartments without a mortgage: $87,240
Median monthly housing costs: $1,641
Compare current foreclosures in Roselle, IL:
| Photo | Address | Area | Beds / Baths | Price | Details |
|---|---|---|---|---|---|

|
#1
Newcastle Dr
Roselle, IL 60172
|
1,743 sq. feet
|
3 baths 3 beds |
show details | |

|
#2
E Granville Ave
Roselle, IL 60172
|
1,368 sq. feet
|
1 baths 3 beds |
show details | |

|
#3
Terry Dr
Roselle, IL 60172
|
3,570 sq. feet
|
4 baths 7 beds |
show details | |

|
#4
Forum Dr
Roselle, IL 60172
|
1,885 sq. feet
|
2 baths 3 beds |
show details | |

|
#5
W Ardmore Ave
Roselle, IL 60172
|
1,985 sq. feet
|
2 baths 4 beds |
show details | |

|
#6
Lawrence Ave Apt 112
Roselle, IL 60172
|
684 sq. feet
|
1 baths 1 beds |
show details | |

|
#7
Locust Ln
Roselle, IL 60172
|
2,036 sq. feet
|
2 baths 4 beds |
show details | |

|
#8
High Ridge Rd
Roselle, IL 60172
|
1,421 sq. feet
|
1 baths 2 beds |
show details | |

|
#9
High Ridge Rd
Roselle, IL 60172
|
1,421 sq. feet
|
1 baths 2 beds |
show details | |

|
#10
Rosemont Ave
Roselle, IL 60172
|
2,006 sq. feet
|
1 baths 3 beds |
show details |
| Photo | Address | Area | Beds / Baths | Price | Details |
|---|---|---|---|---|---|

|
#11
Norfolk Ct Apt 4
Roselle, IL 60172
|
1,064 sq. feet
|
1 baths 2 beds |
show details | |

|
#12
Circle Dr
Roselle, IL 60172
|
1,877 sq. feet
|
2 baths 3 beds |
show details | |

|
#13
Ashbury Ln W Apt 6
Roselle, IL 60172
|
1,311 sq. feet
|
2 baths 2 beds |
show details | |

|
#14
S Roselle Rd
Roselle, IL 60172
|
1,010 sq. feet
|
1 baths 3 beds |
show details | |

|
#15
Dee Ln
Roselle, IL 60172
|
2,551 sq. feet
|
2 baths 4 beds |
show details | |

|
#16
Quincy Dr
Roselle, IL 60172
|
1,138 sq. feet
|
1 baths 3 beds |
show details | |

|
#17
Fall Cir
Roselle, IL 60172
|
1,654 sq. feet
|
1 baths 3 beds |
show details | |

|
#18
Lakeside Dr
Roselle, IL 60172
|
2,560 sq. feet
|
2 baths 4 beds |
show details | |

|
#19
Welland Ct
Roselle, IL 60172
|
2,368 sq. feet
|
2 baths 3 beds |
show details | |

|
#20
Circle Dr
Roselle, IL 60172
|
1,664 sq. feet
|
1 baths 3 beds |
show details |
| Photo | Address | Area | Beds / Baths | Price | Details |
|---|---|---|---|---|---|

|
#21
Rodenburg Rd
Roselle, IL 60172
|
1,530 sq. feet
|
1 baths 3 beds |
show details | |

|
#22
E Devon Ave
Roselle, IL 60172
|
1,664 sq. feet
|
1 baths 3 beds |
show details | |

|
#23
Carlsbad Trl
Roselle, IL 60172
|
1,271 sq. feet
|
1 baths - beds |
show details | |

|
#24
Indian Hill Dr
Roselle, IL 60172
|
1,300 sq. feet
|
1 baths - beds |
show details | |

|
#25
Roslyn Rd
Roselle, IL 60172
|
1,743 sq. feet
|
1 baths - beds |
show details | |

|
#26
Bryce Trl
Roselle, IL 60172
|
1,594 sq. feet
|
2 baths - beds |
show details | |

|
#27
Central Ave Unit 72372
Roselle, IL 60172
|
- sq. feet
|
- baths - beds |
show details | |

|
#28
Thames Ter
Roselle, IL 60172
|
- sq. feet
|
- baths - beds |
show details | |

|
#29
Ashbury Ct Apt 3
Roselle, IL 60172
|
- sq. feet
|
- baths - beds |
show details | |

|
#30
Ardmore Ave
Roselle, IL 60172
|
- sq. feet
|
- baths - beds |
show details |
| Photo | Address | Area | Beds / Baths | Price | Details |
|---|---|---|---|---|---|

|
#31
Gary Ave
Roselle, IL 60172
|
- sq. feet
|
- baths - beds |
show details | |

|
#32
Virginia Rd
Roselle, IL 60172
|
- sq. feet
|
- baths - beds |
show details | |

|
#33
Cross Creek Dr N Apt 1b
Roselle, IL 60172
|
- sq. feet
|
- baths - beds |
show details | |

|
#34
Prescott Dr Apt 104
Roselle, IL 60172
|
- sq. feet
|
- baths - beds |
show details | |

|
#35
Thorn Ave
Roselle, IL 60172
|
- sq. feet
|
- baths - beds |
show details | |

|
#36
E Nerge Rd
Roselle, IL 60172
|
- sq. feet
|
- baths - beds |
show details | |

|
#37
S Prospect P42
Roselle, IL 60172
|
- sq. feet
|
- baths - beds |
show details | |

|
#38
Cross Crk Dr
Roselle, IL 60172
|
- sq. feet
|
- baths - beds |
show details | |

|
#39
N Garden Ave
Roselle, IL 60172
|
- sq. feet
|
- baths - beds |
show details | |

|
#40
S Prospect P17
Roselle, IL 60172
|
- sq. feet
|
- baths - beds |
show details |
| Photo | Address | Area | Beds / Baths | Price | Details |
|---|---|---|---|---|---|

|
#41
Cross Creek Ct Apt 2c
Roselle, IL 60172
|
- sq. feet
|
- baths - beds |
show details | |

|
#42
Westminster Cir
Roselle, IL 60172
|
- sq. feet
|
- baths - beds |
show details | |

|
Check over 1 million property listings on Foreclosure.com!
|
browse all offers | |||

Latest news about housing in Roselle, IL collected exclusively by city-data.com from local newspapers, TV, and radio stations

 | Townhome or different suburb: ~$300k (13 replies) |
| Chicago Suburbs Real Estate (111 replies) |
| Roselle townhouses? (4 replies) |
| Townhome-Condo complexes in Arlington Heights/ Rolling Meadows (10 replies) |
| affordable houses near or in Chicago suburbs (13 replies) |
| Relocating /// NYC to CHICAGO. Safe Suburban Home Commutable to Downtown. (72 replies) |

Median year apartment built: 1978
Household type by relationship:
Households: 22,608- Male householders: 4,265 (956 living alone), Female householders: 4,312 (1,089 living alone)
5,203 spouses (5,179 opposite-sex spouses), 341 unmarried partners, (322 opposite-sex unmarried partners), 6,670 children (6,472 natural, 60 adopted, 137 stepchildren), 392 grandchildren, 207 brothers or sisters, 476 parents, 19 foster children, 296 other relatives, 342 non-relatives
- In group quarters: 79
Size of family households: 2,538 2-persons, 1,595 3-persons, 1,448 4-persons, 450 5-persons, 86 6-persons, 70 7-or-more-persons.
Size of nonfamily households: 2,121 1-person, 357 2-persons, 12 3-persons, 46 4-persons.
3,624 married couples with children.
360 single-parent households (80 men, 280 women).
66.4% of residents of Roselle speak English at home.
4.7% of residents speak Spanish at home (66% speak English very well, 24% speak English well, 11% speak English not well).
22.9% of residents speak other Indo-European language at home (59% speak English very well, 27% speak English well, 12% speak English not well, 2% don't speak English at all).
3.0% of residents speak Asian or Pacific Island language at home (75% speak English very well, 22% speak English well, 4% speak English not well).
1.6% of residents speak other language at home (26% speak English very well, 6% speak English well, 6% speak English not well, 62% don't speak English at all).
Foreign born population: 5,303 (23.5%)
(76.4% of them are naturalized citizens)
| Here: | 6.5 |
| State: | 6.4 |
| Here: | 4.2 |
| State: | 4.1 |

- Bedrooms in owner-occupied houses and condos in Roselle, Illinois
- 0no bedroom
- 301 bedroom
- 1,2492 bedrooms
- 3,4683 bedrooms
- 1,5534 bedrooms
- 5055+ bedrooms

- Bedrooms in renter-occupied apartments in Roselle, Illinois
- 8no bedroom
- 6181 bedroom
- 8402 bedrooms
- 4153 bedrooms
- 264 bedrooms
- 105+ bedrooms

- Cars and other vehicles available in Roselle in owner-occupied houses/condos
- 75no vehicle
- 1,8091 vehicle
- 3,2632 vehicles
- 1,0563 vehicles
- 4844 vehicles
- 1175+ vehicles

- Cars and other vehicles available in Roselle in renter-occupied apartments
- 302no vehicle
- 8901 vehicle
- 4462 vehicles
- 2213 vehicles
- 574 vehicles
- 05+ vehicles

- Rooms in owner-occupied houses in Roselle, Illinois
- 01 room
- 02 rooms
- 893 rooms
- 6544 rooms
- 1,1335 rooms
- 1,3476 rooms
- 1,3717 rooms
- 8288 rooms
- 1,3829+ rooms

- Rooms in renter-occupied apartments in Roselle, Illinois
- 01 room
- 1102 rooms
- 4543 rooms
- 5244 rooms
- 5095 rooms
- 1996 rooms
- 887 rooms
- 08 rooms
- 339+ rooms


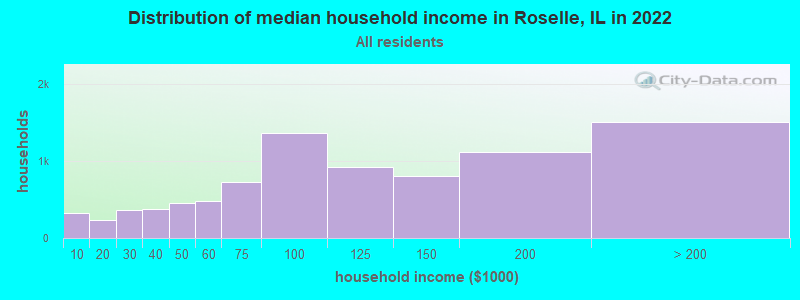
Roselle, IL household income distribution

- 330Less than $10,000
- 237$10,000 to $19,999
- 362$20,000 to $29,999
- 371$30,000 to $39,999
- 460$40,000 to $49,999
- 486$50,000 to $59,999
- 722$60,000 to $74,999
- 1,361$75,000 to $99,999
- 922$100,000 to $124,999
- 806$125,000 to $149,999
- 1,111$150,000 to $199,999
- 1,507$200,000 or more
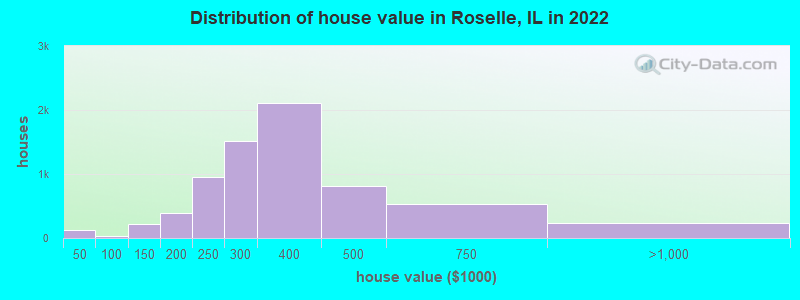
Home value of owner - occupied houses in 2022 in Roselle, IL
-
- 57Less than $10,000
- 9$15,000 to $19,999
- 33$25,000 to $29,999
- 26$30,000 to $34,999
- 17$80,000 to $89,999
- 9$90,000 to $99,999
- 50$100,000 to $124,999
- 162$125,000 to $149,999
- 112$150,000 to $174,999
- 275$175,000 to $199,999
- 957$200,000 to $249,999
- 1,522$250,000 to $299,999
- 2,108$300,000 to $399,999
- 819$400,000 to $499,999
- 531$500,000 to $749,999
- 212$750,000 to $999,999
- 13$1,000,000 to $1,499,999
- 6$1,500,000 to $1,999,999
- 4$2,000,000 or more
Rent paid by renters in 2022 in Roselle, IL
-
- 29Less than $100
- 103$100 to $149
- 38$150 to $199
- 40$200 to $249
- 10$800 to $899
- 91$900 to $999
- 317$1,000 to $1,249
- 428$1,250 to $1,499
- 474$1,500 to $1,999
- 64$2,000 to $2,499
- 54$2,500 to $2,999
- 71No cash rent


Percentage of workers working in this county: 60.2%
Number of people working at home: 2,114 (17.4% of all workers)
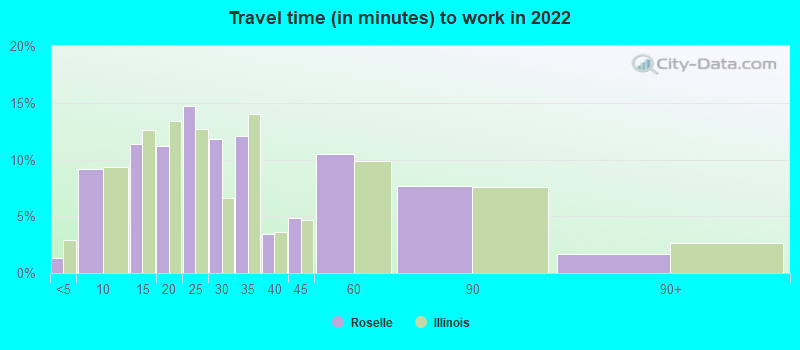
Travel time to work (commute)
- Less than 5 minutes: 288
- 5 to 9 minutes: 814
- 10 to 14 minutes: 985
- 15 to 19 minutes: 1,247
- 20 to 24 minutes: 1,597
- 25 to 29 minutes: 806
- 30 to 34 minutes: 1,411
- 35 to 39 minutes: 279
- 40 to 44 minutes: 520
- 45 to 59 minutes: 936
- 60 to 89 minutes: 716
- 90 or more minutes: 293
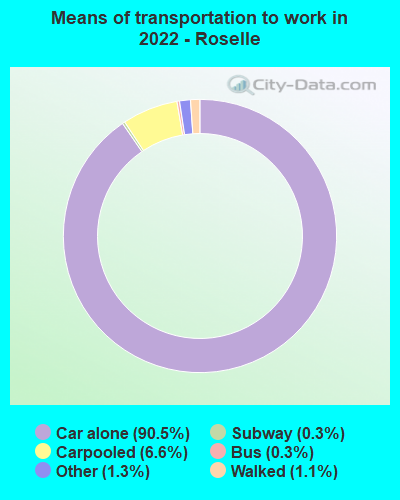
Means of transportation to work:
- Drove a car alone: 6,995 (70.4%)
- Carpooled: 627 (6.3%)
- Bus: 36 (0.4%)
- Long-distance train or commuter rail: 19 (0.2%)
- Taxi: 113 (1.1%)
- Walked: 79 (0.8%)
- Worked at home: 2,114 (21.3%)

- Unemployment by race in 2022
- Unemployment rate for White non-Hispanic residents
- 4.1%Males
- 8.2%Females
- Unemployment rate for Black residents
- 11.2%Males
- 2.5%Females
- Unemployment rate for American Indian and Alaska Native residents
- 19.3%Females
- Unemployment rate for Asian residents
- 1.3%Males
- 6.9%Females
- Unemployment rate for other race residents
- 14.6%Males
- Unemployment rate for two or more race residents
- 3.3%Males
- Unemployment rate for Hispanic or Latino residents
- 5.4%Males
- 2.3%Females

- Year of entry for the foreign-born population in Roselle, Illinois
- 9152010 or later
- 1,0522000 to 2009
- 1,2491990 to 1999
- 1,0041980 to 1989
- 6851970 to 1979
- 720Before 1970

First ancestries reported:
- Polish: 3,550 (32.1%)
- Italian: 967 (8.7%)
- German: 687 (6.2%)
- Irish: 466 (4.2%)
- American: 426 (3.8%)
- Assyrian: 291 (2.6%)
- Bulgarian: 184 (1.7%)
- English: 134 (1.2%)
- Dutch: 129 (1.2%)
- Ukrainian: 119 (1.1%)
- Swedish: 106 (1.0%)
- Canadian: 93 (0.8%)
- Romanian: 86 (0.8%)
- Greek: 76 (0.7%)
- European: 70 (0.6%)
- Hungarian: 69 (0.6%)
- Norwegian: 64 (0.6%)
- Scandinavian: 51 (0.5%)
- Russian: 47 (0.4%)
- French: 44 (0.4%)
- Lebanese: 34 (0.3%)
- Iranian: 33 (0.3%)
- Scottish: 31 (0.3%)
- Albanian: 30 (0.3%)
- Lithuanian: 29 (0.3%)
- Czechoslovakian: 27 (0.2%)
- Belgian: 26 (0.2%)
- Slovak: 26 (0.2%)
- Scotch-Irish: 24 (0.2%)
- Armenian: 22 (0.2%)
- Austrian: 21 (0.2%)
- Portuguese: 20 (0.2%)
- Turkish: 18 (0.2%)
- Nigerian: 17 (0.2%)
- Czech: 15 (0.1%)
- Barbadian: 14 (0.1%)
- Croatian: 13 (0.1%)
- British: 13 (0.1%)
- South African: 11 (0.10%)
- Danish: 10 (0.09%)
- Yugoslavian: 10 (0.09%)
- Finnish: 8 (0.07%)
- French Canadian: 8 (0.07%)
- Slovene: 6 (0.05%)
Most common places of birth for foreign-born residents (%):
| Roselle: | 36.7% (1,957) |
| Illinois: | 6.9% (124,474) |
| Roselle: | 19.7% (1,048) |
| Illinois: | 9.2% (166,409) |
| Roselle: | 7.8% (418) |
| Illinois: | 34.7% (626,958) |
| Roselle: | 5.5% (291) |
| Illinois: | 0.4% (6,781) |
| Roselle: | 4.4% (237) |
| Illinois: | 5.2% (93,003) |
| Roselle: | 3.2% (170) |
| Illinois: | 0.8% (14,165) |
| Roselle: | 2.3% (122) |
| Illinois: | 1.6% (29,316) |
| Roselle: | 1.8% (96) |
| Illinois: | 0.9% (15,679) |
Place of birth for U.S.-born residents:
- This state: 14,440
- Other state: 2,515
- Northeast: 459
- Midwest: 1,533
- South: 374
- West: 172
95.0% of Roselle residents lived in the same house 1 years ago.
Out of people who lived in different houses, 28.3% lived in this county.
Out of people who lived in different counties, 93.1% lived in Illinois.
| Roselle: | 95.0% |
| State average: | 88.3% |
Education attainment for males 25 years and older:
- No schooling: 92
- Nursery to 4th grade: 10
- 5th and 6th grade: 0
- 7th and 8th grade: 58
- 9th grade: 25
- 10th grade: 70
- 11th grade: 37
- 12th grade, no diploma: 269
- High school graduate (or equivalency): 1,819
- Less than 1 year of college: 588
- Some college more than 1 year, no degree: 1,153
- Associate degree: 619
- Bachelor's degree: 1,950
- Master's degree: 828
- Professional school degree: 248
- Doctorate degree: 123

Education attainment for females 25 years and older:
- No schooling: 202
- Nursery to 4th grade: 26
- 5th and 6th grade: 87
- 7th and 8th grade: 0
- 9th grade: 103
- 10th grade: 123
- 11th grade: 67
- 12th grade, no diploma: 135
- High school graduate (or equivalency): 2,063
- Less than 1 year of college: 579
- Some college more than 1 year, no degree: 807
- Associate degree: 658
- Bachelor's degree: 2,117
- Master's degree: 1,097
- Professional school degree: 216
- Doctorate degree: 64


Housing units in structures:
- One, detached: 5,134
- One, attached: 1,388
- Two: 41
- 3 or 4: 1,002
- 5 to 9: 412
- 10 to 19: 344
- 20 to 49: 453
- 50 or more: 148
- Mobile homes: 20
House/condo owner moved in on average 15 years ago
Renter moved in on average 4 years ago

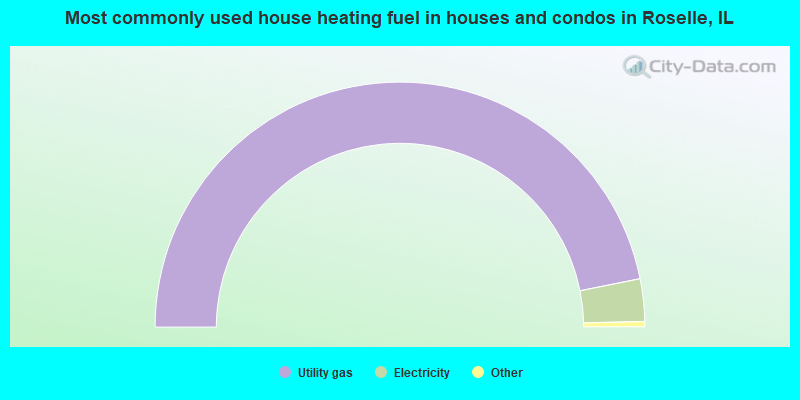
- 93.7%Utility gas
- 5.6%Electricity
- 0.3%Bottled, tank, or LP gas
- 0.3%No fuel used
- 0.1%Other fuel
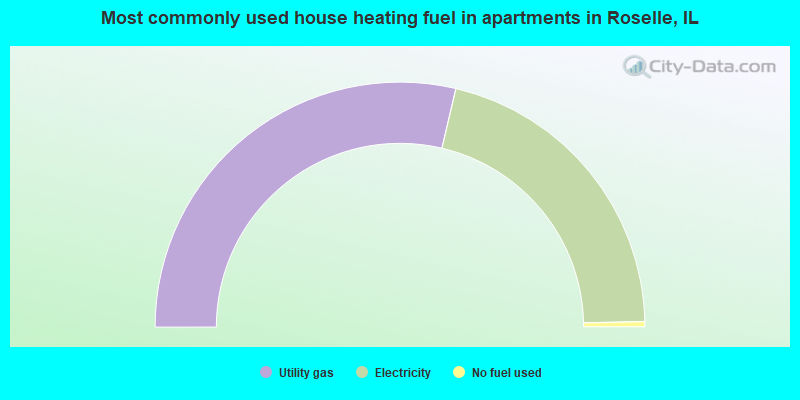
- 57.3%Utility gas
- 41.9%Electricity
- 0.7%No fuel used
Private vs. public school enrollment:
| Here: | 13.5% |
| Illinois: | 13.3% |
| Here: | 2.8% |
| Illinois: | 9.9% |
| Here: | 27.2% |
| Illinois: | 27.4% |


