Roselle Park, NJ (New Jersey) Houses and Residents
Estimated median house or condo value in 2022: $392,123 (it was $158,200 in 2000 )
Roselle Park:
$392,123New Jersey:
$428,900
Lower value quartile - upper value quartile: $335,544 - $447,198Mean price in 2022: Detached houses: $376,253 Here:
$376,253State:
$537,591
Townhouses or other attached units: $352,752 Here:
$352,752State:
$381,113
In 2-unit structures: $427,359 Here:
$427,359State:
$444,476
In 3-to-4-unit structures: $207,754 Here:
$207,754State:
$457,463
In 5-or-more-unit structures: $260,716 Here:
$260,716State:
$368,745
Total population: 13,595 (Urban population: 13,281, Rural population: 0)
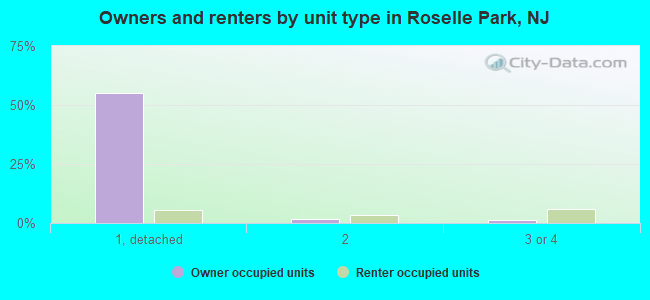
Houses: 5,301 (5,148 occupied: 3,108 owner occupied, 2,057 renter occupied )
% of renters here:
40%State:
35%
Housing density: 4,333 houses/condos per square mile
Median price asked for vacant for-sale houses and condos in 2022: $266,894.
Median contract rent in 2022: $1,411 (lower quartile is $1,181, upper quartile is $1,739)
Median rent asked for vacant for-rent units in 2022: $1,392
Median gross rent in Roselle Park, NJ in 2022: $1,497
Housing units in Roselle Park with a mortgage: 2,048 (201 second mortgage, 0 home equity loan, 189 both second mortgage and home equity loan )Houses without a mortgage: 37
Median household income for houses/condos with a mortgage: $141,496
Median household income for apartments without a mortgage: $111,993
Median monthly housing costs: $1,698
Data:
Median house or condo value ($)
Median house or condo value ($ change since 2000)
Median house or condo value ($) - White
Median house or condo value ($) - Black or African American
Median house or condo value ($) - Asian
Median house or condo value ($) - Hispanic or Latino
Median house or condo value ($) - American Indian and Alaska Native
Median house or condo value ($) - Multirace
Median house or condo value ($) - Other Race
Median price asked for mobile homes ($)
Household density (households per square mile)
Mean house or condo value by units in structure - 1, detached ($)
Mean house or condo value by units in structure - 1, attached ($)
Mean house or condo value by units in structure - 2 ($)
Mean house or condo value by units in structure by units in structure - 3 or 4 ($)
Mean house or condo value by units in structure - 5 or more ($)
Mean house or condo value by units in structure - Boat, RV, van, etc. ($)
Mean house or condo value by units in structure - Mobile home ($)
Median contract rent ($)
Median contract rent - Lower quartile ($)
Median contract rent - Upper quartile ($)
Median gross rent ($)
Urban houses (%)
Rural houses (%)
Houses occupied (%)
Houses occupied (% change since 2000)
Houses owner occupied (%)
Houses owner occupied (% change since 2000)
Houses renter occupied (%)
Houses renter occupied (% change since 2000)
Vacant housing units - For rent (%)
Vacant housing units - For rent (% change since 2000)
Vacant housing units - For sale only (%)
Vacant housing units - For sale only (% change since 2000)
Vacant housing units - Rented or sold, not occupied (%)
Vacant housing units - Rented or sold, not occupied (% change since 2000)
Vacant housing units - For seasonal, recreational, or occasional use (%)
Vacant housing units - For seasonal, recreational, or occasional use (% change since 2000)
Vacant housing units - For migrant workers (%)
Vacant housing units - For migrant workers (% change since 2000)
Vacant housing units - Other vacant (%)
Vacant housing units - Other vacant (% change since 2000)
Median monthly housing costs ($)
Median household income for houses/condos with a mortgage ($)
Median household income for houses/condos without a mortgage ($)
Median household income ($)
Median household income ($) - White
Median household income ($) - Black or African American
Median household income ($) - Asian
Median household income ($) - Hispanic or Latino
Median household income ($) - American Indian and Alaska Native
Median household income ($) - Multirace
Median household income ($) - Other Race
Mortgage status - with mortgage (%)
Mortgage status - with second mortgage (%)
Mortgage status - with home equity loan (%)
Mortgage status - with both second mortgage and home equity loan (%)
Mortgage status - without a mortgage (%)
Median year house/condo built
Median year apartment built
Household type by relationship - Male householder living alone (%)
Household type by relationship - Male householder not living alone (%)
Household type by relationship - Female householder living alone (%)
Household type by relationship - Female householder not living alone (%)
Household type by relationship - Opposite-Sex spouse (%)
Household type by relationship - Same-Sex spouse (%)
Household type by relationship - Opposite-Sex unmarried partner (%)
Household type by relationship - Same-Sex unmarried partner (%)
Household type by relationship - In group quarters (%)
Size of family households - 2-person household (%)
Size of family households - 3-person household (%)
Size of family households - 4-person household (%)
Size of family households - 5-person household (%)
Size of family households - 6-person household (%)
Size of family households - 7-or-more-person household (%)
Size of nonfamily households - 1-person household (%)
Size of nonfamily households - 2-person household (%)
Size of nonfamily households - 3-person household (%)
Size of nonfamily households - 4-person household (%)
Size of nonfamily households - 5-person household (%)
Size of nonfamily households - 6-person household (%)
Size of nonfamily households - 7-or-moreperson household (%)
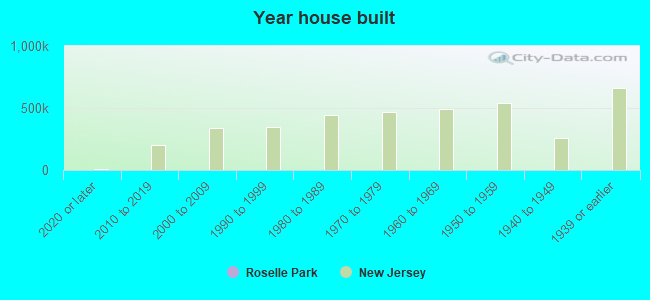
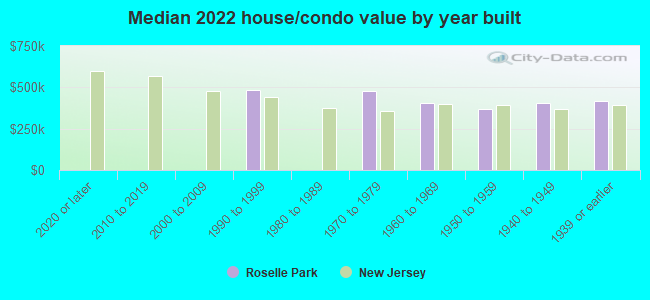
Year house built - Built 2010 or later (%)
Year house built - Built 2000 to 2009 (%)
Year house built - Built 1990 to 1999 (%)
Year house built - Built 1980 to 1989 (%)
Year house built - Built 1970 to 1979 (%)
Year house built - Built 1960 to 1969 (%)
Year house built - Built 1950 to 1959 (%)
Year house built - Built 1940 to 1949 (%)
Year house built - Built 1939 or earlier (%)
Median number of rooms in houses and condos
Median number of rooms in apartments
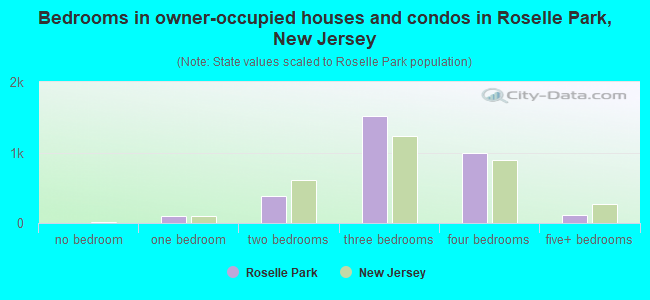
Median number of bedrooms in owner occupied houses
Mean number of bedrooms in owner occupied houses
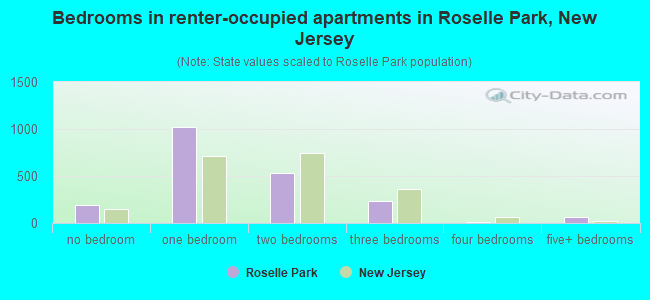
Median number of bedrooms in renter occupied houses
Mean number of bedrooms in renter occupied houses
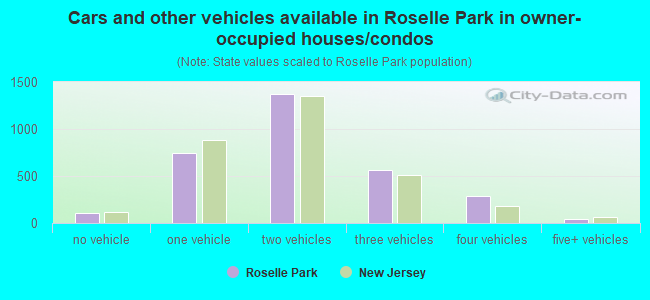
Median number of vehichles in owner occupied houses
Mean number of vehichles in owner occupied houses
Median number of vehichles in renter occupied houses
Mean number of vehichles in renter occupied houses
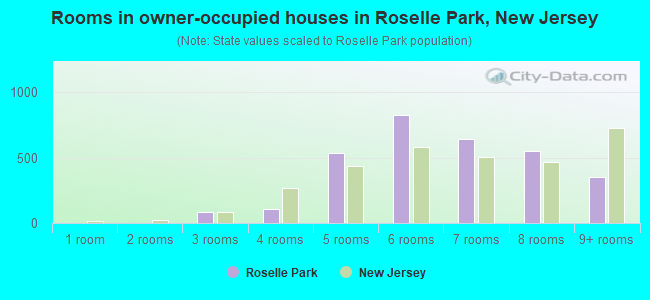
Rooms in owner-occupied houses - 1 room (%)
Rooms in owner-occupied houses - 2 rooms (%)
Rooms in owner-occupied houses - 3 rooms (%)
Rooms in owner-occupied houses - 4 rooms (%)
Rooms in owner-occupied houses - 5 rooms (%)
Rooms in owner-occupied houses - 6 rooms (%)
Rooms in owner-occupied houses - 7 rooms (%)
Rooms in owner-occupied houses - 8 rooms (%)
Rooms in owner-occupied houses - 9+ rooms (%)
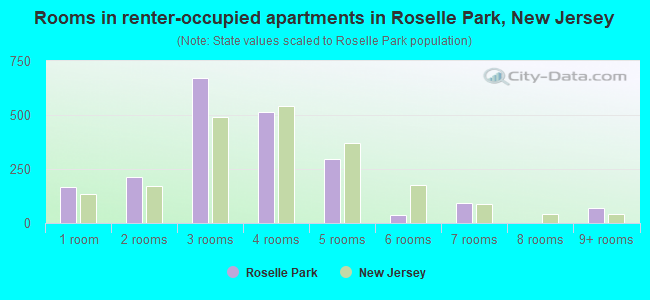
Rooms in renter-occupied houses - 1 room (%)
Rooms in renter-occupied houses - 2 rooms (%)
Rooms in renter-occupied houses - 3 rooms (%)
Rooms in renter-occupied houses - 4 rooms (%)
Rooms in renter-occupied houses - 5 rooms (%)
Rooms in renter-occupied houses - 6 rooms (%)
Rooms in renter-occupied houses - 7 rooms (%)
Rooms in renter-occupied houses - 8 rooms (%)
Rooms in renter-occupied houses - 9+ rooms (%)
Bedrooms in owner-occupied houses - no bedrooms (%)
Bedrooms in owner-occupied houses - 1 bedroom (%)
Bedrooms in owner-occupied houses - 2 bedrooms (%)
Bedrooms in owner-occupied houses - 3 bedrooms (%)
Bedrooms in owner-occupied houses - 4 bedrooms (%)
Bedrooms in owner-occupied houses - 5+ bedrooms (%)
Bedrooms in renter-occupied houses - no bedrooms (%)
Bedrooms in renter-occupied houses - 1 bedroom (%)
Bedrooms in renter-occupied houses - 2 bedrooms (%)
Bedrooms in renter-occupied houses - 3 bedrooms (%)
Bedrooms in renter-occupied houses - 4 bedrooms (%)
Bedrooms in renter-occupied houses - 5+ bedrooms (%)
Vehicles available in owner-occupied houses - no vehicle available (%)
Vehicles available in owner-occupied houses - 1 vehicle available(%)
Vehicles available in owner-occupied houses - 2 Vehicles available (%)
Vehicles available in owner-occupied houses - 3 Vehicles available (%)
Vehicles available in owner-occupied houses - 4 Vehicles available (%)
Vehicles available in owner-occupied houses - 5+ Vehicles available (%)
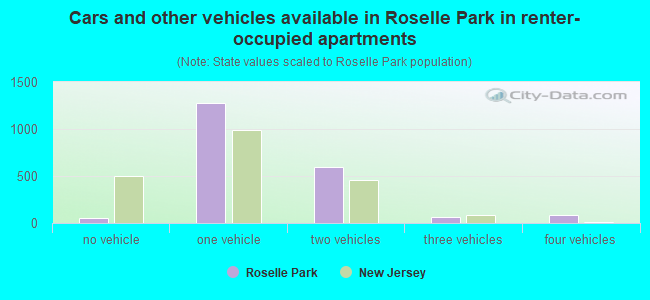
Vehicles available in renter-occupied houses - no vehicle available (%)
Vehicles available in renter-occupied houses - 1 vehicle available (%)
Vehicles available in renter-occupied houses - 2 Vehicles available (%)
Vehicles available in renter-occupied houses - 3 Vehicles available (%)
Vehicles available in renter-occupied houses - 4 Vehicles available (%)
Vehicles available in renter-occupied houses - 5+ Vehicles available (%)
Housing units in structures - 1, detached (%)
Housing units in structures - 1, attached (%)
Housing units in structures - 2 (%)
Housing units in structures - 3 or 4 (%)
Housing units in structures - 5 to 9 (%)
Housing units in structures - 10 to 19 (%)
Housing units in structures - 20 to 49 (%)
Housing units in structures - 50 or more (%)
Housing units in structures - Mobile home (%)
Housing units in structures - Boat, RV, van, etc. (%)
Housing units in structures - Owners - 1, detached (%)
Housing units in structures - Owners - 1, attached (%)
Housing units in structures - Owners - 2 (%)
Housing units in structures - Owners - 3 or 4 (%)
Housing units in structures - Owners - 5 to 9 (%)
Housing units in structures - Owners - 10 to 19 (%)
Housing units in structures - Owners - 20 to 49 (%)
Housing units in structures - Owners - 50 or more (%)
Housing units in structures - Owners - Mobile home (%)
Housing units in structures - Owners - Boat, RV, van, etc. (%)
Housing units in structures - Renters - 1, detached (%)
Housing units in structures - Renters - 1, attached (%)
Housing units in structures - Renters - 2 (%)
Housing units in structures - Renters - 3 or 4 (%)
Housing units in structures - Renters - 5 to 9 (%)
Housing units in structures - Renters - 10 to 19 (%)
Housing units in structures - Renters - 20 to 49 (%)
Housing units in structures - Renters - 50 or more (%)
Housing units in structures - Renters - Mobile home (%)
Housing units in structures - Renters - Boat, RV, van, etc. (%)
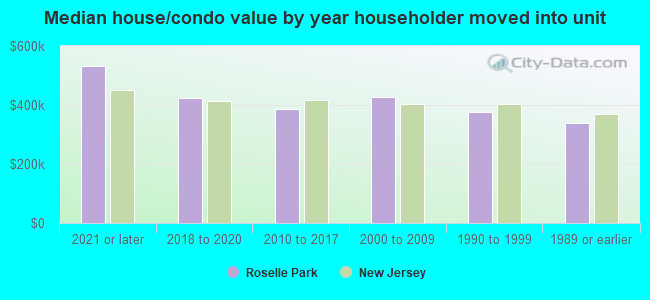
House/condo owner moved in on average (years ago)
Renter moved in on average (years ago)
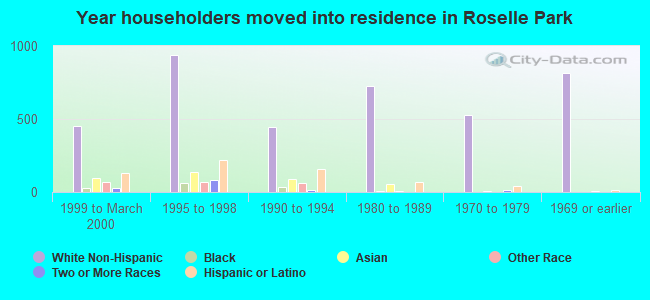
Year householder moved into unit - Moved in 1999 to March 2000 (%)
Year householder moved into unit - Moved in 1999 to March 2000 (%) - White
Year householder moved into unit - Moved in 1999 to March 2000 (%) - Black or African American
Year householder moved into unit - Moved in 1999 to March 2000 (%) - Asian
Year householder moved into unit - Moved in 1999 to March 2000 (%) - Hispanic or Latino
Year householder moved into unit - Moved in 1999 to March 2000 (%) - American Indian and Alaska Native
Year householder moved into unit - Moved in 1999 to March 2000 (%) - Multirace
Year householder moved into unit - Moved in 1999 to March 2000 (%) - Other Race
Year householder moved into unit - Moved in 1995 to 1998 (%)
Year householder moved into unit - Moved in 1995 to 1998 (%) - White
Year householder moved into unit - Moved in 1995 to 1998 (%) - Black or African American
Year householder moved into unit - Moved in 1995 to 1998 (%) - Asian
Year householder moved into unit - Moved in 1995 to 1998 (%) - Hispanic or Latino
Year householder moved into unit - Moved in 1995 to 1998 (%) - American Indian and Alaska Native
Year householder moved into unit - Moved in 1995 to 1998 (%) - Multirace
Year householder moved into unit - Moved in 1995 to 1998 (%) - Other Race
Year householder moved into unit - Moved in 1990 to 1994 (%)
Year householder moved into unit - Moved in 1990 to 1994 (%) - White
Year householder moved into unit - Moved in 1990 to 1994 (%) - Black or African American
Year householder moved into unit - Moved in 1990 to 1994 (%) - Asian
Year householder moved into unit - Moved in 1990 to 1994 (%) - Hispanic or Latino
Year householder moved into unit - Moved in 1990 to 1994 (%) - American Indian and Alaska Native
Year householder moved into unit - Moved in 1990 to 1994 (%) - Multirace
Year householder moved into unit - Moved in 1990 to 1994 (%) - Other Race
Year householder moved into unit - Moved in 1980 to 1989 (%)
Year householder moved into unit - Moved in 1980 to 1989 (%) - White
Year householder moved into unit - Moved in 1980 to 1989 (%) - Black or African American
Year householder moved into unit - Moved in 1980 to 1989 (%) - Asian
Year householder moved into unit - Moved in 1980 to 1989 (%) - Hispanic or Latino
Year householder moved into unit - Moved in 1980 to 1989 (%) - American Indian and Alaska Native
Year householder moved into unit - Moved in 1980 to 1989 (%) - Multirace
Year householder moved into unit - Moved in 1980 to 1989 (%) - Other Race
Year householder moved into unit - Moved in 1970 to 1979 (%)
Year householder moved into unit - Moved in 1970 to 1979 (%) - White
Year householder moved into unit - Moved in 1970 to 1979 (%) - Black or African American
Year householder moved into unit - Moved in 1970 to 1979 (%) - Asian
Year householder moved into unit - Moved in 1970 to 1979 (%) - Hispanic or Latino
Year householder moved into unit - Moved in 1970 to 1979 (%) - American Indian and Alaska Native
Year householder moved into unit - Moved in 1970 to 1979 (%) - Multirace
Year householder moved into unit - Moved in 1970 to 1979 (%) - Other Race
Year householder moved into unit - Moved in 1969 or earlier (%)
Year householder moved into unit - Moved in 1969 or earlier (%) - White
Year householder moved into unit - Moved in 1969 or earlier (%) - Black or African American
Year householder moved into unit - Moved in 1969 or earlier (%) - Asian
Year householder moved into unit - Moved in 1969 or earlier (%) - Hispanic or Latino
Year householder moved into unit - Moved in 1969 or earlier (%) - American Indian and Alaska Native
Year householder moved into unit - Moved in 1969 or earlier (%) - Multirace
Year householder moved into unit - Moved in 1969 or earlier (%) - Other Race
Housing units lacking complete plumbing facilities (%)
Housing units lacking complete kitchen facilities (%)
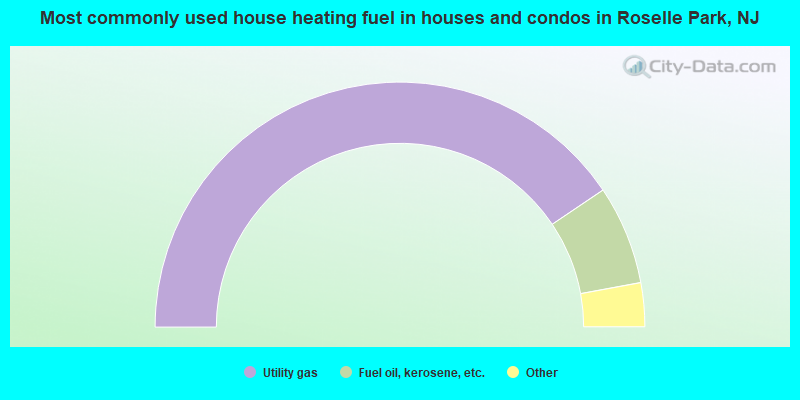
House heating fuel used in houses and condos - Utility gas (%)
House heating fuel used in houses and condos - Bottled, tank, or LP gas (%)
House heating fuel used in houses and condos - Electricity (%)
House heating fuel used in houses and condos - Fuel oil, kerosene, etc. (%)
House heating fuel used in houses and condos - Coal or coke (%)
House heating fuel used in houses and condos - Wood (%)
House heating fuel used in houses and condos - Solar energy (%)
House heating fuel used in houses and condos - Other fuel (%)
House heating fuel used in houses and condos - No fuel used (%)
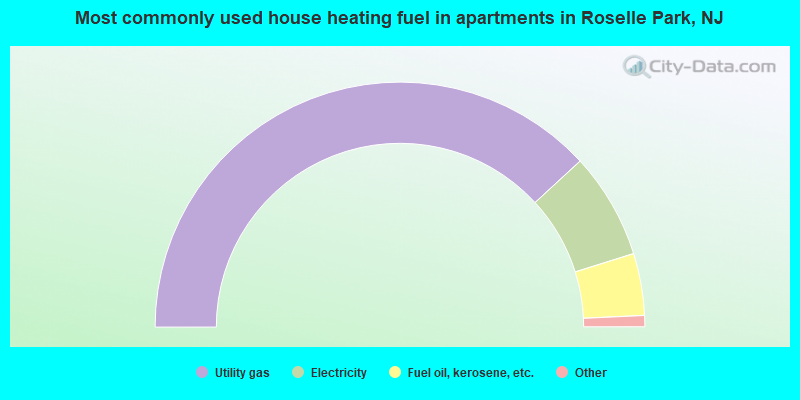
House heating fuel used in apartments - Utility gas (%)
House heating fuel used in apartments - Bottled, tank, or LP gas (%)
House heating fuel used in apartments - Electricity (%)
House heating fuel used in apartments - Fuel oil, kerosene, etc. (%)
House heating fuel used in apartments - Coal or coke (%)
House heating fuel used in apartments - Wood (%)
House heating fuel used in apartments - Solar energy (%)
House heating fuel used in apartments - Other fuel (%)
House heating fuel used in apartments - No fuel used (%)
Median year house/condo built: 1946Median year apartment built: 1968Household type by relationship:
Households: 13,908
Male householders: 2,596 (699 living alone ), Female householders: 2,483 (631 living alone )2,617 spouses (2,586 opposite-sex spouses ), 185 unmarried partners , (175 opposite-sex unmarried partners ), 4,319 children (4,117 natural , 36 adopted , 165 stepchildren ), 334 grandchildren , 203 brothers or sisters , 675 parents , 0 foster children , 168 other relatives , 319 non-relatives In group quarters: 4
Size of family households: 1,118 2-persons , 1,043 3-persons , 773 4-persons , 356 5-persons , 215 6-persons , 83 7-or-more-persons .
Size of nonfamily households: 1,292 1-person , 160 2-persons , 100 3-persons .
2,022 married couples with children. single-parent households (220 men , 355 women ).
54.8% of residents of Roselle Park speak English at home. of residents speak Spanish at home (63% speak English very well , 18% speak English well , 13% speak English not well , 6% don't speak English at all ).of residents speak other Indo-European language at home (59% speak English very well , 20% speak English well , 18% speak English not well , 2% don't speak English at all ).of residents speak Asian or Pacific Island language at home (58% speak English very well , 27% speak English well , 15% speak English not well ).of residents speak other language at home (83% speak English very well , 14% speak English well , 3% don't speak English at all ).
Foreign born population: 4,912 (35.3%)of them are naturalized citizens )
Median number of rooms in houses and condos:
Median number of rooms in apartments
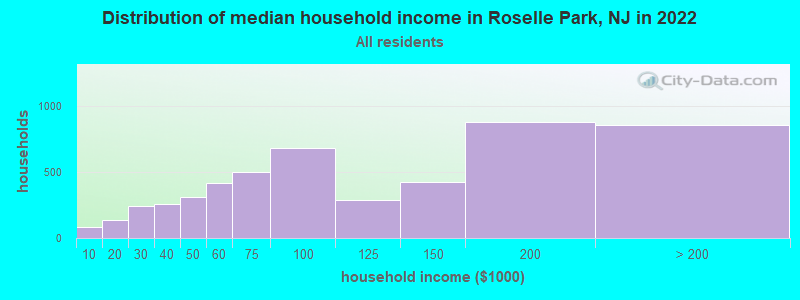
Roselle Park, NJ household income distribution 86 Less than $10,000139 $10,000 to $19,999240 $20,000 to $29,999255 $30,000 to $39,999309 $40,000 to $49,999415 $50,000 to $59,999496 $60,000 to $74,999682 $75,000 to $99,999289 $100,000 to $124,999426 $125,000 to $149,999876 $150,000 to $199,999855 $200,000 or more
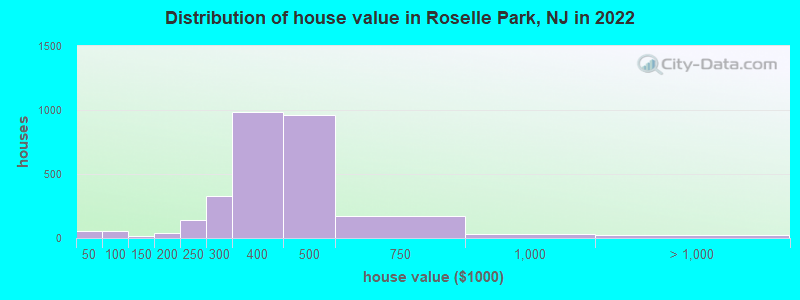
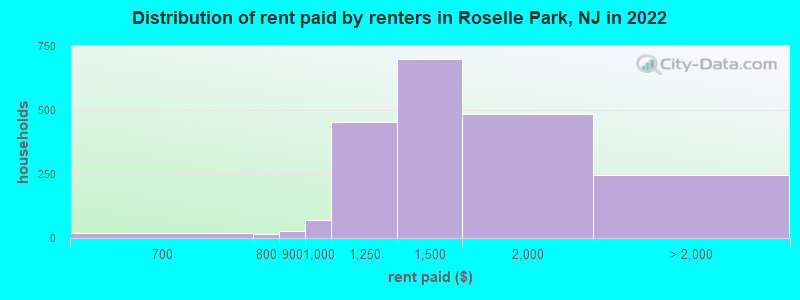
Home value of owner - occupied houses in 2022 in Roselle Park, NJ 37 $35,000 to $39,99913 $40,000 to $49,99913 $60,000 to $69,99929 $90,000 to $99,99914 $125,000 to $149,99923 $150,000 to $174,99916 $175,000 to $199,999137 $200,000 to $249,999330 $250,000 to $299,999983 $300,000 to $399,999958 $400,000 to $499,999168 $500,000 to $749,99929 $750,000 to $999,99920 $1,000,000 to $1,499,999Rent paid by renters in 2022 in Roselle Park, NJ 20 $600 to $64917 $700 to $74929 $800 to $89972 $900 to $999454 $1,000 to $1,249698 $1,250 to $1,499484 $1,500 to $1,999240 $2,000 to $2,4997 $2,500 to $2,999
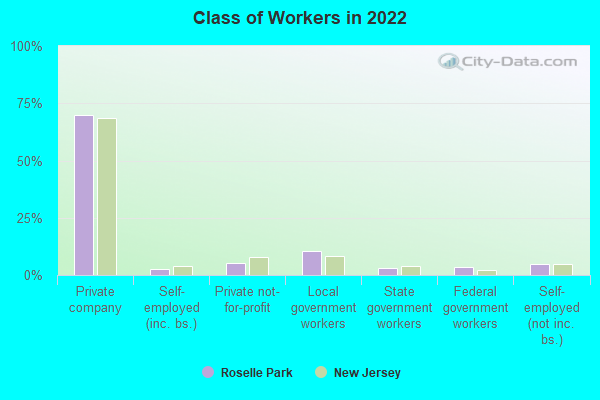
Percentage of workers working in this county: 59.7%Number of people working at home: 848 (10.6% of all workers )
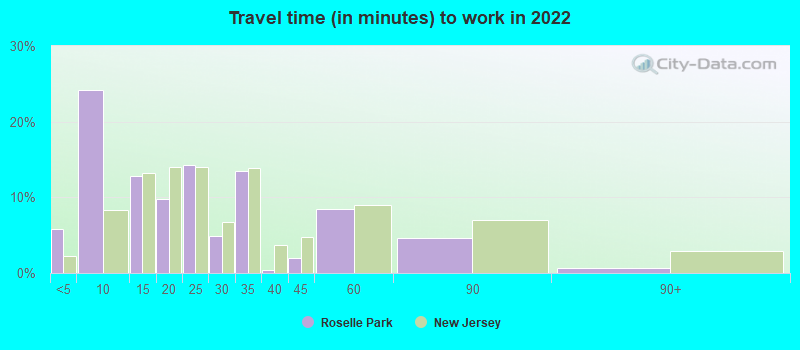
Travel time to work (commute)
Less than 5 minutes: 1525 to 9 minutes: 58010 to 14 minutes: 1,01815 to 19 minutes: 1,11120 to 24 minutes: 1,20425 to 29 minutes: 46630 to 34 minutes: 69635 to 39 minutes: 8340 to 44 minutes: 28545 to 59 minutes: 69360 to 89 minutes: 64590 or more minutes: 118
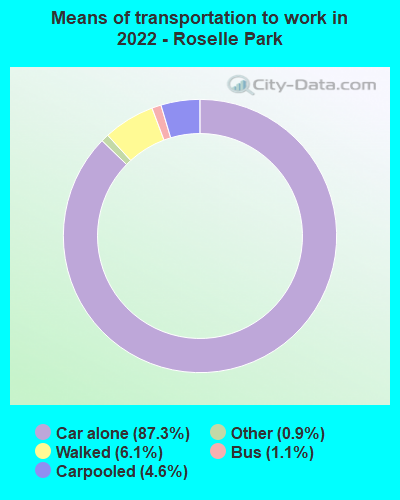
Means of transportation to work:
Drove a car alone: 1,754 (62.3%)Carpooled: 111 (3.9%)Bus : 25 (0.9%)Taxi: 16 (0.6%)Walked: 135 (4.8%)Worked at home: 848 (30.1%)
Unemployment by race in 2022
Unemployment rate for White non-Hispanic residents 2.0% Males3.4% FemalesUnemployment rate for Black residents 7.4% Males4.9% FemalesUnemployment rate for Asian residents 3.1% Males0.9% FemalesUnemployment rate for other race residents 4.2% MalesUnemployment rate for two or more race residents 6.8% Males6.4% FemalesUnemployment rate for Hispanic or Latino residents 6.9% Males2.0% Females
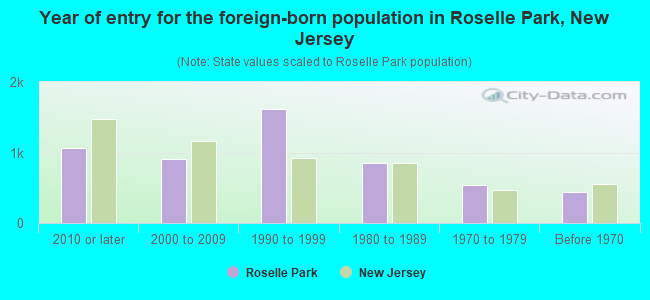
Year of entry for the foreign-born population in Roselle Park, New Jersey
1,066 2010 or later 910 2000 to 2009 1,616 1990 to 1999 849 1980 to 1989 545 1970 to 1979 444 Before 1970
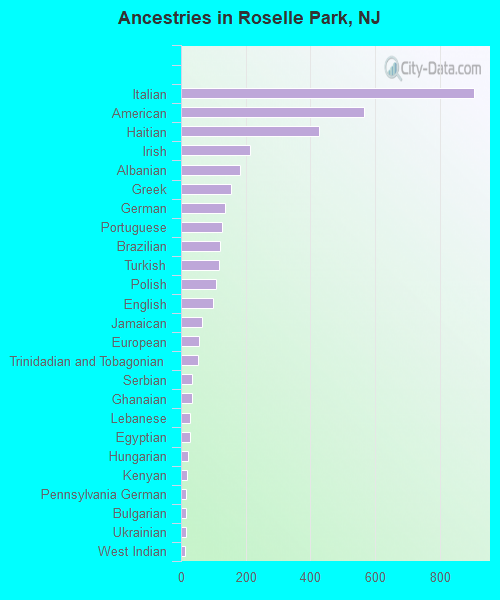
First ancestries reported:
Italian: 907 (11.9%)
American: 567 (7.4%)
Haitian: 427 (5.6%)
Irish: 212 (2.8%)
Albanian: 183 (2.4%)
Greek: 156 (2.0%)
German: 137 (1.8%)
Portuguese: 126 (1.7%)
Brazilian: 121 (1.6%)
Turkish: 117 (1.5%)
Polish: 107 (1.4%)
English: 100 (1.3%)
Jamaican: 66 (0.9%)
European: 55 (0.7%)
Trinidadian and Tobagonian: 53 (0.7%)
Serbian: 33 (0.4%)
Ghanaian: 33 (0.4%)
Lebanese: 29 (0.4%)
Egyptian: 28 (0.4%)
Hungarian: 23 (0.3%)
Kenyan: 20 (0.3%)
Pennsylvania German: 17 (0.2%)
Bulgarian: 14 (0.2%)
Ukrainian: 14 (0.2%)
West Indian: 12 (0.2%)
Iranian: 11 (0.1%)
Slovak: 11 (0.1%)
Russian: 9 (0.1%)
French: 8 (0.1%)
Eastern European: 4 (0.05%) Most common places of birth for foreign-born residents (%): India Roselle Park:
16.0% (766)New Jersey:
12.8% (274,609)
Peru Roselle Park:
12.8% (613)New Jersey:
2.7% (58,563)
Colombia Roselle Park:
11.1% (531)New Jersey:
4.2% (90,817)
Haiti Roselle Park:
5.5% (265)New Jersey:
2.3% (49,491)
Nicaragua Roselle Park:
4.0% (189)New Jersey:
0.3% (5,500)
Philippines Roselle Park:
3.7% (178)New Jersey:
4.0% (85,934)
Brazil Roselle Park:
3.3% (157)New Jersey:
2.1% (46,020)
China, excluding Hong Kong and Taiwan Roselle Park:
3.2% (155)New Jersey:
3.7% (78,969)
El Salvador Roselle Park:
3.2% (151)New Jersey:
2.3% (48,885)
Egypt Roselle Park:
2.8% (136)New Jersey:
1.6% (33,678)
Turkey Roselle Park:
2.6% (125)New Jersey:
0.8% (16,778)
Bolivia Roselle Park:
2.3% (112)New Jersey:
0.2% (3,252)
Panama Roselle Park:
2.2% (106)New Jersey:
0.2% (4,290)
Albania Roselle Park:
2.2% (103)New Jersey:
0.3% (6,130)
Italy Roselle Park:
2.0% (95)New Jersey:
1.5% (33,198)
Ecuador Roselle Park:
1.9% (92)New Jersey:
4.4% (95,275)
Dominican Republic Roselle Park:
1.7% (83)New Jersey:
9.7% (209,055)
West Indies Roselle Park:
1.7% (80)New Jersey:
0.0% (753)
Mexico Roselle Park:
1.6% (78)New Jersey:
4.8% (102,527)
Place of birth for U.S.-born residents:
This state: 6,754Other state: 1,960Northeast: 1,522Midwest: 31South: 317West: 86 86.6% of Roselle Park residents lived in the same house 1 years ago.
Out of people who lived in different houses, 43.4% lived in this county.
Out of people who lived in different counties, 41.3% lived in New Jersey.
Roselle Park:
86.6%State average:
90.4%
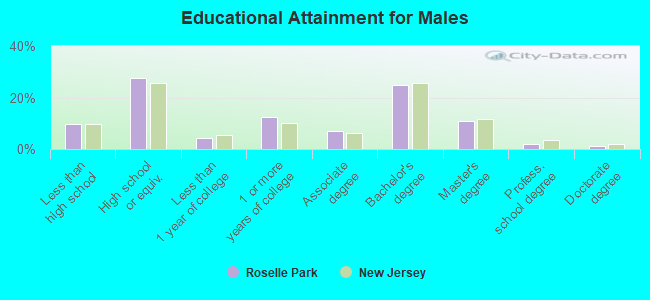
Education attainment for males 25 years and older:
No schooling: 62Nursery to 4th grade: 1265th and 6th grade: 647th and 8th grade: 129th grade: 6010th grade: 1911th grade: 3112th grade, no diploma: 124High school graduate (or equivalency): 1,394Less than 1 year of college: 209Some college more than 1 year, no degree: 633Associate degree: 348Bachelor's degree: 1,250Master's degree: 549Professional school degree: 101Doctorate degree: 55
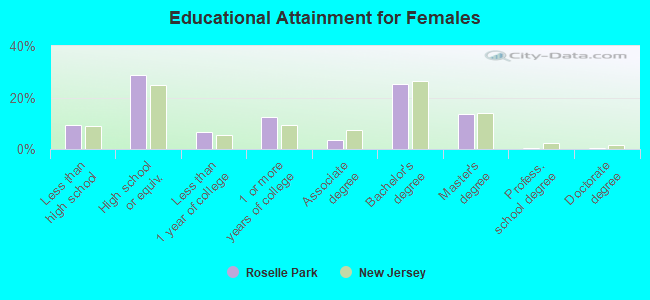
Education attainment for females 25 years and older:
No schooling: 148Nursery to 4th grade: 495th and 6th grade: 537th and 8th grade: 59th grade: 4210th grade: 4211th grade: 712th grade, no diploma: 122High school graduate (or equivalency): 1,416Less than 1 year of college: 327Some college more than 1 year, no degree: 621Associate degree: 180Bachelor's degree: 1,245Master's degree: 666Professional school degree: 15Doctorate degree: 16
Housing units in structures:
One, detached: 3,285One, attached: 70Two: 2583 or 4: 4205 to 9: 12810 to 19: 28820 to 49: 61350 or more: 235Housing units lacking complete plumbing facilities in 2022: 0.5%Housing units lacking complete kitchen facilities in 2022: 1.8%House/condo owner moved in on average 14 years ago
Renter moved in on average 3 years ago
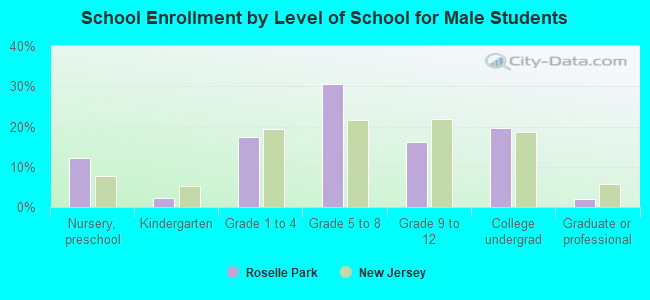
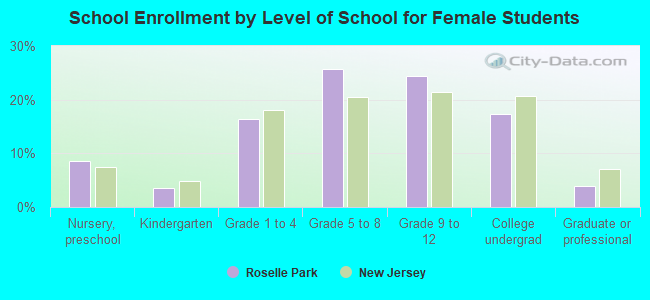
Private vs. public school enrollment:
Students in private schools in grades 1 to 8 (elementary and middle school): 65 Here:
4.7%New Jersey:
12.3%
Students in private schools in grades 9 to 12 (high school): 36 Here:
5.9%New Jersey:
13.1%
Students in private undergraduate colleges: 143 Here:
26.1%New Jersey:
33.2%