Jump to a detailed profile or search site with Google Custom Search

Rossmoor, CA (California) Houses and Residents

Estimated median house or condo value in 2022: $1,304,873 (it was $388,400 in 2000)
Rossmoor:

$1,304,873
California:

$715,900
Lower value quartile - upper value quartile: $1,161,616 - $1,640,781

Mean price in 2022:

Detached houses: $1,542,789
Here:

$1,542,789
State:

$988,808

Townhouses or other attached units: $784,636
Here:

$784,636
State:

$838,546

Total population: 10,244 (All urban)

Houses: 4,116 (4,022 occupied: 3,519 owner occupied, 518 renter occupied)

% of renters here:

13%
State:

44%

Housing density: 2,631 houses/condos per square mile

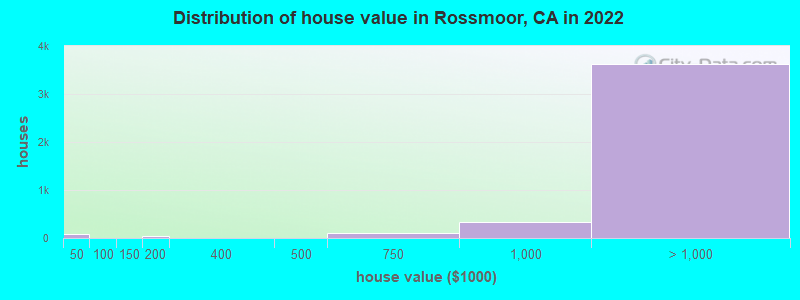
Median price asked for vacant for-sale houses and condos in 2022 in this county: $1,279,555.

Median contract rent in 2022: over $2,000 (lower quartile is over $2,000, upper quartile is over $2,000)


Median rent asked for vacant for-rent units in 2022: $3,713


Median gross rent in Rossmoor, CA in 2022: over $2,000

Housing units in Rossmoor with a mortgage: 2,426 (466 second mortgage, 11 home equity loan, 408 both second mortgage and home equity loan)
Houses without a mortgage: 111

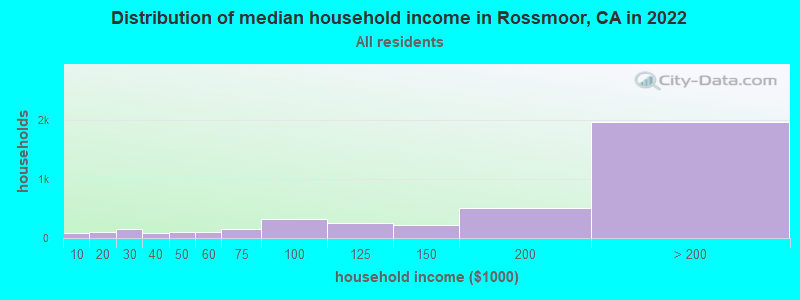
Median household income for houses/condos with a mortgage: $223,544

Median household income for apartments without a mortgage: $140,145

Median monthly housing costs: $3,231

Compare current foreclosures near Rossmoor, CA:

Check out more offers near Rossmoor, CA.
Powered by Foreclosure.com

Settings
X
Data:
Loading data...
Based on 2000-2022 data
Loading data...

123
Hide US histogram

Latest news about housing in Rossmoor, CA collected exclusively by city-data.com from local newspapers, TV, and radio stations

Rossmoor, California Age and Sex of Residents
Median year house/condo built: 1957

Median year apartment built: 1970

Household type by relationship:

Households: 11,653
  • Male householders: 2,056 (191 living alone), Female householders: 1,880 (314 living alone)
  • 2,828 spouses (2,816 opposite-sex spouses), 193 unmarried partners, (189 opposite-sex unmarried partners), 3,978 children (3,882 natural, 11 adopted, 84 stepchildren), 174 grandchildren, 39 brothers or sisters, 315 parents, 1 foster children, 77 other relatives, 89 non-relatives
  • In group quarters: 16

Size of family households: 1,412 2-persons, 615 3-persons, 791 4-persons, 348 5-persons, 149 6-persons, 23 7-or-more-persons.

Size of nonfamily households: 527 1-person, 130 2-persons, 17 3-persons.

2,212 married couples with children.
414 single-parent households (193 men, 221 women).

81.2% of residents of Rossmoor speak English at home.
6.3% of residents speak Spanish at home (85% speak English very well, 5% speak English well, 10% speak English not well).
6.0% of residents speak other Indo-European language at home (89% speak English very well, 1% speak English well, 10% speak English not well).
5.1% of residents speak Asian or Pacific Island language at home (68% speak English very well, 14% speak English well, 13% speak English not well, 5% don't speak English at all).
0.1% of residents speak other language at home (100% speak English very well).

Foreign born population: 1,287 (11.0%)
(85.9% of them are naturalized citizens)

Median number of rooms in houses and condos:
Here:

7.0
State:

6.0

Median number of rooms in apartments
Here:

5.5
State:

3.9

Owner-occupied Renter-occupied
Bedrooms in owner-occupied houses and condos in Rossmoor, California
  • Bedrooms in owner-occupied houses and condos in Rossmoor, California
  • 0no bedroom
  • 111 bedroom
  • 312 bedrooms
  • 1,5373 bedrooms
  • 1,5754 bedrooms
  • 3655+ bedrooms
Bedrooms in renter-occupied apartments in Rossmoor, California
  • Bedrooms in renter-occupied apartments in Rossmoor, California
  • 0no bedroom
  • 481 bedroom
  • 1112 bedrooms
  • 2423 bedrooms
  • 1104 bedrooms
  • 75+ bedrooms
Owner-occupied Renter-occupied
Cars and other vehicles available in Rossmoor in owner-occupied houses/condos
  • Cars and other vehicles available in Rossmoor in owner-occupied houses/condos
  • 14no vehicle
  • 4711 vehicle
  • 1,5562 vehicles
  • 8273 vehicles
  • 4754 vehicles
  • 1755+ vehicles
Cars and other vehicles available in Rossmoor in renter-occupied apartments
  • Cars and other vehicles available in Rossmoor in renter-occupied apartments
  • 19no vehicle
  • 1111 vehicle
  • 2962 vehicles
  • 923 vehicles
  • 04 vehicles
  • 05+ vehicles
Owner-occupied Renter-occupied
Rooms in owner-occupied houses in Rossmoor, California
  • Rooms in owner-occupied houses in Rossmoor, California
  • 01 room
  • 02 rooms
  • 03 rooms
  • 1014 rooms
  • 3915 rooms
  • 6936 rooms
  • 1,1037 rooms
  • 5178 rooms
  • 7149+ rooms
Rooms in renter-occupied apartments in Rossmoor, California
  • Rooms in renter-occupied apartments in Rossmoor, California
  • 01 room
  • 02 rooms
  • 583 rooms
  • 924 rooms
  • 1155 rooms
  • 1456 rooms
  • 487 rooms
  • 368 rooms
  • 259+ rooms
Year house built
Median 2022 house/condo value by year built
Median house/condo value by year householder moved into unit
Breakdown of mean house values by ages of householders
Owners and renters by unit type in Rossmoor, CA
  • Rossmoor, CA household income distribution

  • Distribution of median household income in Rossmoor, CA in 2022
  • 81Less than $10,000
  • 98$10,000 to $19,999
  • 154$20,000 to $29,999
  • 85$30,000 to $39,999
  • 97$40,000 to $49,999
  • 94$50,000 to $59,999
  • 148$60,000 to $74,999
  • 328$75,000 to $99,999
  • 261$100,000 to $124,999
  • 227$125,000 to $149,999
  • 501$150,000 to $199,999
  • 1,961$200,000 or more
  • Home value of owner - occupied houses in 2022 in Rossmoor, CA

  • Distribution of house value in Rossmoor, CA in 2022
  • 74Less than $10,000
  • 7$100,000 to $124,999
  • 47$150,000 to $174,999
  • 6$400,000 to $499,999
  • 108$500,000 to $749,999
  • 338$750,000 to $999,999
  • 2,411$1,000,000 to $1,499,999
  • 872$1,500,000 to $1,999,999
  • 346$2,000,000 or more
Time Leaving Home To Go To Work in 2022

Percentage of workers working in this county: 67.3%
Number of people working at home: 1,467 (27.7% of all workers)

Travel time (in minutes) to work in 2022

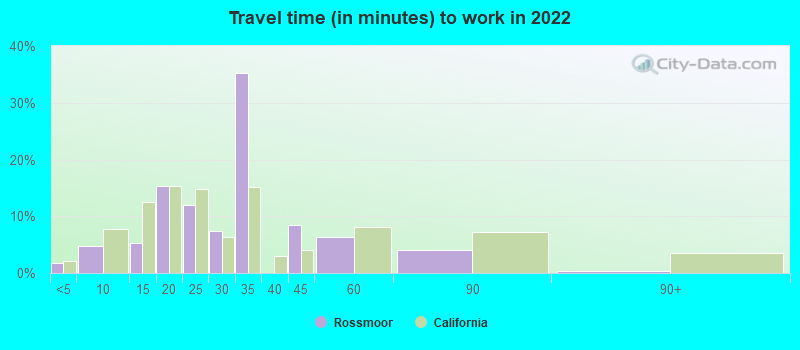
Travel time to work (commute)

  • Less than 5 minutes: 68
  • 5 to 9 minutes: 286
  • 10 to 14 minutes: 439
  • 15 to 19 minutes: 410
  • 20 to 24 minutes: 624
  • 25 to 29 minutes: 349
  • 30 to 34 minutes: 519
  • 35 to 39 minutes: 104
  • 40 to 44 minutes: 151
  • 45 to 59 minutes: 520
  • 60 to 89 minutes: 423
  • 90 or more minutes: 36
Means of transportation to work in 2022 - Rossmoor

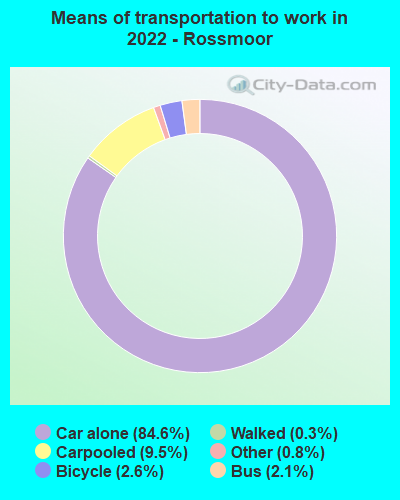
Means of transportation to work:

  • Drove a car alone: 732 (34.7%)
  • Carpooled: 89 (4.2%)
  • Bus: 16 (0.8%)
  • Taxi: 7 (0.3%)
  • Bicycle: 24 (1.1%)
  • Walked: 2 (0.1%)
  • Worked at home: 1,467 (69.6%)
Class of Workers in 2022
  • Unemployment by race in 2022
  • Unemployment rate for White non-Hispanic residents
  • 2.7%Males
  • 3.8%Females
  • Unemployment rate for Black residents
  • 62.2%Females
  • Unemployment rate for Asian residents
  • 5.1%Females
  • Unemployment rate for other race residents
  • 3.4%Males
  • Unemployment rate for two or more race residents
  • 0.5%Males
  • Unemployment rate for Hispanic or Latino residents
  • 4.2%Males
  • 5.7%Females
Year of entry for the foreign-born population in Rossmoor, California
  • Year of entry for the foreign-born population in Rossmoor, California
  • 1572010 or later
  • 2452000 to 2009
  • 1521990 to 1999
  • 1501980 to 1989
  • 1381970 to 1979
  • 386Before 1970
Ancestries in Rossmoor, CA

First ancestries reported:

  • English: 323 (6.6%)
  • German: 256 (5.3%)
  • Italian: 216 (4.4%)
  • American: 174 (3.6%)
  • Irish: 169 (3.5%)
  • European: 151 (3.1%)
  • Eastern European: 85 (1.7%)
  • Norwegian: 76 (1.6%)
  • Polish: 71 (1.5%)
  • Northern European: 60 (1.2%)
  • Armenian: 57 (1.2%)
  • Swedish: 50 (1.0%)
  • Scottish: 48 (1.0%)
  • Ukrainian: 45 (0.9%)
  • Hungarian: 37 (0.8%)
  • Dutch: 33 (0.7%)
  • Iranian: 30 (0.6%)
  • Czech: 29 (0.6%)
  • Greek: 28 (0.6%)
  • Bulgarian: 26 (0.5%)
  • Swiss: 21 (0.4%)
  • Croatian: 20 (0.4%)
  • British: 19 (0.4%)
  • Egyptian: 17 (0.3%)
  • Scandinavian: 15 (0.3%)
  • French: 14 (0.3%)
  • Israeli: 13 (0.3%)
  • Scotch-Irish: 12 (0.2%)
  • Slovak: 12 (0.2%)
  • Ethiopian: 12 (0.2%)
  • Belgian: 10 (0.2%)
  • Lebanese: 9 (0.2%)
  • Austrian: 9 (0.2%)
  • New Zealander: 8 (0.2%)
  • Romanian: 8 (0.2%)
  • Welsh: 8 (0.2%)
  • Russian: 7 (0.1%)
  • Lithuanian: 6 (0.1%)
  • Haitian: 6 (0.1%)

Most common places of birth for foreign-born residents (%):

Vietnam
Rossmoor:

12.2% (157)
California:

4.9% (512,335)

Philippines
Rossmoor:

8.7% (112)
California:

7.8% (818,297)

Korea
Rossmoor:

7.1% (92)
California:

3.0% (315,248)

Turkey
Rossmoor:

6.4% (83)
California:

0.2% (20,474)

Costa Rica
Rossmoor:

5.9% (76)
California:

0.1% (12,623)

Colombia
Rossmoor:

5.0% (64)
California:

0.5% (55,249)

Mexico
Rossmoor:

4.6% (59)
California:

37.2% (3,881,193)

England
Rossmoor:

3.9% (50)
California:

0.6% (57,953)

China, excluding Hong Kong and Taiwan
Rossmoor:

3.2% (41)
California:

6.6% (684,672)

Japan
Rossmoor:

3.2% (41)
California:

1.0% (103,575)

India
Rossmoor:

3.1% (40)
California:

5.2% (539,184)

Israel
Rossmoor:

2.1% (27)
California:

0.3% (33,029)

Bulgaria
Rossmoor:

1.9% (24)
California:

0.1% (9,442)

Iran
Rossmoor:

1.8% (23)
California:

2.0% (206,004)

Croatia
Rossmoor:

1.8% (23)
California:

0.0% (4,947)

Australia
Rossmoor:

1.8% (23)
California:

0.2% (23,338)

Cambodia
Rossmoor:

1.7% (22)
California:

0.5% (51,974)

Italy
Rossmoor:

1.7% (22)
California:

0.3% (31,439)

Uzbekistan
Rossmoor:

1.6% (21)
California:

0.1% (5,897)

Place of birth for U.S.-born residents:

  • This state: 7,563
  • Other state: 2,528
  • Northeast: 655
  • Midwest: 1,000
  • South: 405
  • West: 459

92.0% of Rossmoor residents lived in the same house 1 years ago.
   Out of people who lived in different houses, 28.8% lived in this county.
   Out of people who lived in different counties, 88.3% lived in California.


Rossmoor:

92.0%
State average:

88.9%

Education attainment for males 25 years and older:

  • No schooling: 42
  • Nursery to 4th grade: 24
  • 5th and 6th grade: 16
  • 7th and 8th grade: 19
  • 9th grade: 0
  • 10th grade: 0
  • 11th grade: 0
  • 12th grade, no diploma: 25
  • High school graduate (or equivalency): 347
  • Less than 1 year of college: 221
  • Some college more than 1 year, no degree: 389
  • Associate degree: 187
  • Bachelor's degree: 1,519
  • Master's degree: 483
  • Professional school degree: 354
  • Doctorate degree: 185
Educational Attainment for Males

Education attainment for females 25 years and older:

  • No schooling: 23
  • Nursery to 4th grade: 0
  • 5th and 6th grade: 0
  • 7th and 8th grade: 6
  • 9th grade: 24
  • 10th grade: 0
  • 11th grade: 14
  • 12th grade, no diploma: 20
  • High school graduate (or equivalency): 592
  • Less than 1 year of college: 175
  • Some college more than 1 year, no degree: 542
  • Associate degree: 360
  • Bachelor's degree: 1,401
  • Master's degree: 734
  • Professional school degree: 236
  • Doctorate degree: 64
Educational Attainment for Females
Rossmoor marital status for males
Rossmoor marital status for females

Housing units in structures:

  • One, detached: 3,687
  • One, attached: 201
  • 3 or 4: 29
  • 20 to 49: 73
  • 50 or more: 124
Housing units lacking complete kitchen facilities in 2022: 1.2%

House/condo owner moved in on average 19 years ago

Renter moved in on average 1 years ago

Year householders moved into residence in Rossmoor
Houses and condos Apartments
Most commonly used house heating fuel in houses and condos in Rossmoor, CA
  • 82.1%Utility gas
  • 13.3%Electricity
  • 4.0%Solar energy
  • 0.6%Bottled, tank, or LP gas
Most commonly used house heating fuel in apartments in Rossmoor, CA
  • 53.6%Electricity
  • 38.3%Utility gas
  • 8.1%No fuel used

Private vs. public school enrollment:

Students in private schools in grades 1 to 8 (elementary and middle school): 281
Here:

17.8%
California:

10.5%

Students in private schools in grades 9 to 12 (high school): 23
Here:

2.7%
California:

8.5%

Students in private undergraduate colleges: 89
Here:

15.6%
California:

15.9%
School Enrollment by Level of School for Male Students
School Enrollment by Level of School for Female Students
Age and Sex of Sensory-Disabled Noninstitutionalized Residents
Age and Sex of Physically-Disabled Noninstitutionalized Residents
Age and Sex of Mentally-Disabled Noninstitutionalized Residents
Age and Sex of Self-Care Disabled Noninstitutionalized Residents
Age and Sex of Go-Outside-Home Disabled Noninstitutionalized Residents
Age and Sex of Noninstitutionalized Residents with Employment Disability