Rossville, IN (Indiana) Houses and Residents
| Rossville: | $189,262 |
| Indiana: | $208,700 |
Mean price in 2022:
Detached houses: $203,601
Here: $203,601 State: $257,916 Mobile homes: $20,112
Here: $20,112 State: $67,116
Total population: 1,637 (Urban population: 0, Rural population: 1,562 (all nonfarm))
Houses: 644 (604 occupied: 446 owner occupied, 164 renter occupied)
| % of renters here: | 27% |
| State: | 29% |
Housing density: 1,247 houses/condos per square mile
Median price asked for vacant for-sale houses and condos in 2022: $618,807.
Median contract rent in 2022: $724 (lower quartile is $657, upper quartile is $798)
Median rent asked for vacant for-rent units in 2022: $434
Median gross rent in Rossville, IN in 2022: $1,014
Housing units in Rossville with a mortgage: 305 (17 second mortgage, 0 home equity loan, 13 both second mortgage and home equity loan)
Houses without a mortgage: 11
Median household income for houses/condos with a mortgage: $76,582
Median household income for apartments without a mortgage: $55,498
Median monthly housing costs: $919
Compare current foreclosures near Rossville, IN:
| Photo | Address | Area | Beds / Baths | Price | Details |
|---|---|---|---|---|---|

|
#1
W South St
Rossville, IN 46065
|
1,651 sq. feet
|
2 baths 3 beds |
show details | |

|
#2
W Ramey St
Rossville, IN 46065
|
1,263 sq. feet
|
3 baths 3 beds |
show details | |

|
#3
N State Road 39
Rossville, IN 46065
|
2,130 sq. feet
|
2 baths 5 beds |
show details | |

|
#4
N Plank St
Rossville, IN 46065
|
2,320 sq. feet
|
1 baths 3 beds |
show details | |

|
#5
N Plank St
Rossville, IN 46065
|
1,374 sq. feet
|
1 baths 2 beds |
show details | |

|
#6
E Main St
Rossville, IN 46065
|
1,880 sq. feet
|
2 baths 3 beds |
show details | |

|
#7
N 250 W
Rossville, IN 46065
|
- sq. feet
|
- baths - beds |
show details | |

|
#8
Sims St
Frankfort, IN 46041
|
1,092 sq. feet
|
2 baths 2 beds |
$159,900
|
show details |

|
#9
N County Road 400 W
Frankfort, IN 46041
|
1,512 sq. feet
|
1 baths 3 beds |
$147,000
|
show details |

|
#10
Center St
Mulberry, IN 46058
|
1,949 sq. feet
|
3 baths 4 beds |
$258,900
|
show details |
| Photo | Address | Area | Beds / Baths | Price | Details |
|---|---|---|---|---|---|

|
#11
E Little St
Flora, IN 46929
|
1,680 sq. feet
|
1 baths 3 beds |
$205,000
|
show details |

|
#12
W Vine St
Flora, IN 46929
|
- sq. feet
|
2 baths 3 beds |
$126,000
|
show details |

|
#13
Center Dr
Frankfort, IN 46041
|
1,450 sq. feet
|
1 baths 3 beds |
show details | |

|
#14
Beard St
Frankfort, IN 46041
|
1,233 sq. feet
|
1 baths 3 beds |
show details | |

|
#15
W Mcclurg St
Frankfort, IN 46041
|
822 sq. feet
|
1 baths 2 beds |
show details | |

|
#16
W Boone St
Frankfort, IN 46041
|
264 sq. feet
|
1 baths 2 beds |
show details | |

|
#17
E Ohio St
Frankfort, IN 46041
|
1,240 sq. feet
|
1 baths 3 beds |
show details | |

|
#18
E County Road 550 N
Frankfort, IN 46041
|
1,779 sq. feet
|
1 baths 4 beds |
show details | |

|
#19
W Mcclurg St
Frankfort, IN 46041
|
782 sq. feet
|
1 baths 2 beds |
show details | |

|
#20
W Barner St
Frankfort, IN 46041
|
1,056 sq. feet
|
1 baths 3 beds |
show details |
| Photo | Address | Area | Beds / Baths | Price | Details |
|---|---|---|---|---|---|

|
#21
S Jackson St
Frankfort, IN 46041
|
1,316 sq. feet
|
1 baths 3 beds |
show details | |

|
#22
W 100 S
Russiaville, IN 46979
|
1,212 sq. feet
|
2 baths 3 beds |
show details | |

|
#23
S County Road 900 W
Frankfort, IN 46041
|
2,240 sq. feet
|
2 baths 4 beds |
show details | |

|
#24
E Kelley Rd
Frankfort, IN 46041
|
2,560 sq. feet
|
2 baths 3 beds |
show details | |

|
#25
Stair Rd
Lafayette, IN 47905
|
1,178 sq. feet
|
2 baths 3 beds |
show details | |

|
#26
Main St
Michigantown, IN 46057
|
1,592 sq. feet
|
2 baths 3 beds |
show details | |

|
#27
S 30th St
Lafayette, IN 47904
|
624 sq. feet
|
1 baths 2 beds |
show details | |

|
#28
N County Road 930 E
Forest, IN 46039
|
2,038 sq. feet
|
2 baths 3 beds |
show details | |

|
#29
S County Road 50 W
Frankfort, IN 46041
|
1,512 sq. feet
|
1 baths 3 beds |
show details | |

|
#30
E Park St
Colfax, IN 46035
|
900 sq. feet
|
1 baths 2 beds |
show details |
| Photo | Address | Area | Beds / Baths | Price | Details |
|---|---|---|---|---|---|

|
#31
Royce Dr
Lafayette, IN 47909
|
1,057 sq. feet
|
2 baths 3 beds |
show details | |

|
#32
W Franklin St
Colfax, IN 46035
|
2,428 sq. feet
|
1 baths 4 beds |
show details | |

|
#33
W Midway St
Colfax, IN 46035
|
2,090 sq. feet
|
1 baths 3 beds |
show details | |

|
#34
Delphi Ave
Frankfort, IN 46041
|
998 sq. feet
|
1 baths 3 beds |
show details | |

|
#35
S State Road 39
Frankfort, IN 46041
|
2,845 sq. feet
|
2 baths 4 beds |
show details | |

|
#36
Milroy St
Frankfort, IN 46041
|
1,220 sq. feet
|
1 baths 3 beds |
show details | |

|
#37
Milroy St
Frankfort, IN 46041
|
2,080 sq. feet
|
1 baths 2 beds |
show details | |

|
#38
W Jackson St
Frankfort, IN 46041
|
810 sq. feet
|
1 baths 2 beds |
show details | |

|
#39
N Glick St
Mulberry, IN 46058
|
2,016 sq. feet
|
1 baths 3 beds |
show details | |

|
#40
Woodruff Pl
Mulberry, IN 46058
|
2,101 sq. feet
|
2 baths 3 beds |
show details |
| Photo | Address | Area | Beds / Baths | Price | Details |
|---|---|---|---|---|---|

|
#41
N Main St
Mulberry, IN 46058
|
1,910 sq. feet
|
2 baths 4 beds |
show details | |

|
#42
Short Columbia St
Frankfort, IN 46041
|
1,996 sq. feet
|
1 baths 3 beds |
show details | |

|
#43
E County Road 250 N
Frankfort, IN 46041
|
2,029 sq. feet
|
2 baths 2 beds |
show details | |

|
#44
S Maish Rd
Frankfort, IN 46041
|
2,392 sq. feet
|
1 baths 3 beds |
show details | |

|
#45
S Williams Rd
Frankfort, IN 46041
|
1,943 sq. feet
|
2 baths 3 beds |
show details | |

|
#46
E Michigantown Rd
Frankfort, IN 46041
|
1,668 sq. feet
|
1 baths 3 beds |
show details | |

|
#47
Faxon Dr
Lafayette, IN 47905
|
- sq. feet
|
2 baths 3 beds |
show details | |

|
#48
W 132 N
Delphi, IN 46923
|
1,540 sq. feet
|
2 baths 3 beds |
show details | |

|
#49
W Mulberry Jefferson Rd
Mulberry, IN 46058
|
1,302 sq. feet
|
2 baths 3 beds |
show details | |

|
Check over 1 million property listings on Foreclosure.com!
|
browse all offers | |||

Latest news about housing in Rossville, IN collected exclusively by city-data.com from local newspapers, TV, and radio stations

 | From Chicago to Lafayette (8 replies) |

Median year apartment built: 1988
Household type by relationship:
Households: 1,761- Male householders: 276 (55 living alone), Female householders: 322 (67 living alone)
273 spouses (273 opposite-sex spouses), 116 unmarried partners, (105 opposite-sex unmarried partners), 644 children (590 natural, 8 adopted, 46 stepchildren), 35 grandchildren, 9 brothers or sisters, 14 parents, 0 foster children, 14 other relatives, 46 non-relatives
- In group quarters: 8
Size of family households: 148 2-persons, 87 3-persons, 83 4-persons, 41 5-persons, 18 6-persons, 5 7-or-more-persons.
Size of nonfamily households: 125 1-person, 98 2-persons.
328 married couples with children.
107 single-parent households (33 men, 74 women).
97.4% of residents of Rossville speak English at home.
0.2% of residents speak Spanish at home (100% speak English very well).
1.2% of residents speak other Indo-European language at home (100% speak English very well).
Foreign born population: 31 (1.8%)
(41.9% of them are naturalized citizens)
| Here: | 6.6 |
| State: | 6.6 |
| Here: | 5.4 |
| State: | 4.3 |

- Bedrooms in owner-occupied houses and condos in Rossville, Indiana
- 0no bedroom
- 21 bedroom
- 712 bedrooms
- 2953 bedrooms
- 684 bedrooms
- 115+ bedrooms

- Bedrooms in renter-occupied apartments in Rossville, Indiana
- 0no bedroom
- 201 bedroom
- 482 bedrooms
- 813 bedrooms
- 134 bedrooms
- 25+ bedrooms

- Cars and other vehicles available in Rossville in owner-occupied houses/condos
- 0no vehicle
- 1131 vehicle
- 2412 vehicles
- 453 vehicles
- 394 vehicles
- 85+ vehicles

- Cars and other vehicles available in Rossville in renter-occupied apartments
- 9no vehicle
- 681 vehicle
- 582 vehicles
- 03 vehicles
- 04 vehicles
- 305+ vehicles

- Rooms in owner-occupied houses in Rossville, Indiana
- 01 room
- 02 rooms
- 03 rooms
- 104 rooms
- 795 rooms
- 1226 rooms
- 1157 rooms
- 318 rooms
- 899+ rooms

- Rooms in renter-occupied apartments in Rossville, Indiana
- 01 room
- 02 rooms
- 93 rooms
- 274 rooms
- 475 rooms
- 526 rooms
- 97 rooms
- 08 rooms
- 209+ rooms


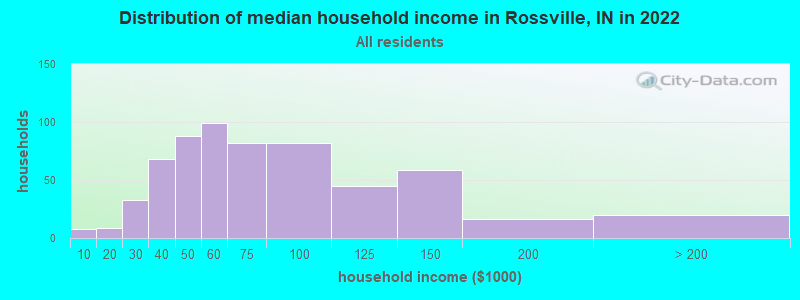
Rossville, IN household income distribution

- 8Less than $10,000
- 9$10,000 to $19,999
- 33$20,000 to $29,999
- 68$30,000 to $39,999
- 88$40,000 to $49,999
- 99$50,000 to $59,999
- 82$60,000 to $74,999
- 82$75,000 to $99,999
- 45$100,000 to $124,999
- 59$125,000 to $149,999
- 16$150,000 to $199,999
- 20$200,000 or more
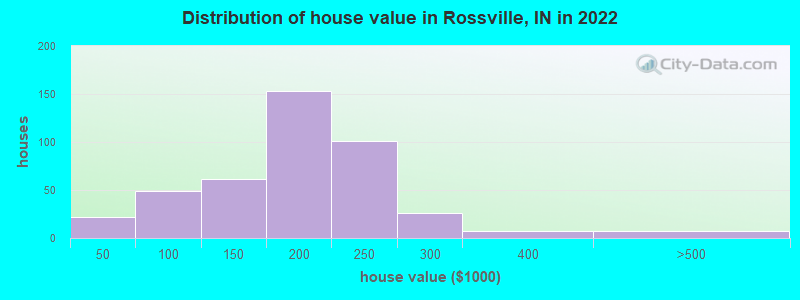
Home value of owner - occupied houses in 2022 in Rossville, IN
-
- 19Less than $10,000
- 1$15,000 to $19,999
- 1$40,000 to $49,999
- 1$50,000 to $59,999
- 7$60,000 to $69,999
- 3$70,000 to $79,999
- 19$80,000 to $89,999
- 15$90,000 to $99,999
- 34$100,000 to $124,999
- 26$125,000 to $149,999
- 101$150,000 to $174,999
- 50$175,000 to $199,999
- 100$200,000 to $249,999
- 26$250,000 to $299,999
- 6$300,000 to $399,999
- 5$400,000 to $499,999
- 2$750,000 to $999,999
Rent paid by renters in 2022 in Rossville, IN
-
- 1$350 to $399
- 1$400 to $449
- 23$550 to $599
- 9$600 to $649
- 21$650 to $699
- 51$700 to $749
- 16$750 to $799
- 12$800 to $899
- 9$900 to $999
- 3$1,250 to $1,499
- 3No cash rent


Percentage of workers working in this county: 25.6%
Number of people working at home: 46 (5.5% of all workers)
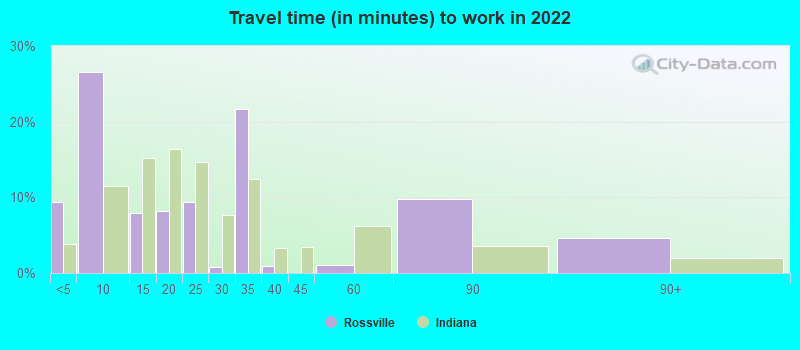
Travel time to work (commute)
- Less than 5 minutes: 32
- 5 to 9 minutes: 51
- 10 to 14 minutes: 12
- 15 to 19 minutes: 76
- 20 to 24 minutes: 225
- 25 to 29 minutes: 213
- 30 to 34 minutes: 82
- 35 to 39 minutes: 30
- 40 to 44 minutes: 19
- 45 to 59 minutes: 30
- 60 to 89 minutes: 12
- 90 or more minutes: 1
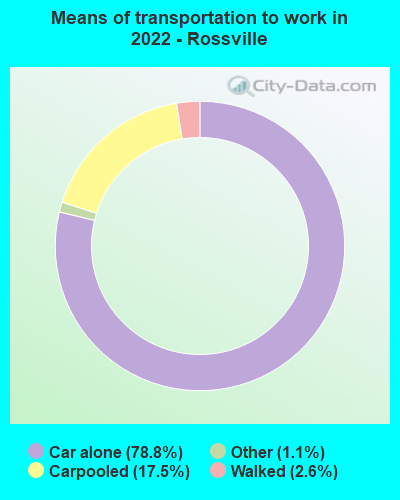
Means of transportation to work:
- Drove a car alone: 292 (69.2%)
- Carpooled: 71 (16.8%)
- Taxi: 4 (0.9%)
- Walked: 9 (2.1%)
- Worked at home: 46 (10.9%)

- Unemployment by race in 2022
- Unemployment rate for White non-Hispanic residents
- 6.7%Males
- 1.0%Females

- Year of entry for the foreign-born population in Rossville, Indiana
- 202010 or later
- 72000 to 2009
- 51990 to 1999
- 01980 to 1989
- 21970 to 1979
- 0Before 1970

First ancestries reported:
- German: 247 (31.0%)
- English: 150 (18.8%)
- American: 149 (18.7%)
- Norwegian: 30 (3.8%)
- Scottish: 19 (2.4%)
- Irish: 12 (1.5%)
- Romanian: 11 (1.4%)
- Polish: 8 (1.0%)
- Eastern European: 4 (0.5%)
- Welsh: 3 (0.4%)
- European: 2 (0.3%)
- Scotch-Irish: 2 (0.3%)
- Italian: 1 (0.1%)
Most common places of birth for foreign-born residents (%):
| Rossville: | 54.8% (17) |
| Indiana: | 8.5% (32,127) |
| Rossville: | 22.6% (7) |
| Indiana: | 5.3% (19,877) |
| Rossville: | 6.5% (2) |
| Indiana: | 27.0% (101,996) |
| Rossville: | 6.5% (2) |
| Indiana: | 0.3% (977) |
| Rossville: | 3.2% (1) |
| Indiana: | 2.2% (8,253) |
Place of birth for U.S.-born residents:
- This state: 1,391
- Other state: 317
- Northeast: 17
- Midwest: 101
- South: 127
- West: 71
88.9% of Rossville residents lived in the same house 1 years ago.
Out of people who lived in different houses, 33.1% lived in this county.
Out of people who lived in different counties, 80.0% lived in Indiana.
| Rossville: | 88.9% |
| State average: | 87.1% |
Education attainment for males 25 years and older:
- No schooling: 0
- Nursery to 4th grade: 0
- 5th and 6th grade: 0
- 7th and 8th grade: 0
- 9th grade: 0
- 10th grade: 25
- 11th grade: 1
- 12th grade, no diploma: 7
- High school graduate (or equivalency): 152
- Less than 1 year of college: 37
- Some college more than 1 year, no degree: 61
- Associate degree: 45
- Bachelor's degree: 105
- Master's degree: 20
- Professional school degree: 0
- Doctorate degree: 0

Education attainment for females 25 years and older:
- No schooling: 0
- Nursery to 4th grade: 12
- 5th and 6th grade: 0
- 7th and 8th grade: 0
- 9th grade: 0
- 10th grade: 13
- 11th grade: 2
- 12th grade, no diploma: 0
- High school graduate (or equivalency): 195
- Less than 1 year of college: 64
- Some college more than 1 year, no degree: 56
- Associate degree: 96
- Bachelor's degree: 107
- Master's degree: 27
- Professional school degree: 0
- Doctorate degree: 0


Housing units in structures:
- One, detached: 487
- One, attached: 7
- Two: 36
- 3 or 4: 14
- 10 to 19: 16
- Mobile homes: 83
Median worth of mobile homes: $11,413
Housing units lacking complete kitchen facilities in 2022: 1.3%
House/condo owner moved in on average 8 years ago
Renter moved in on average 3 years ago

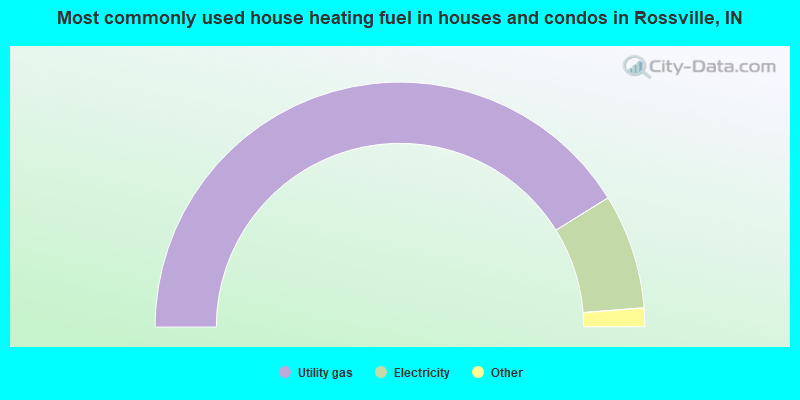
- 82.5%Utility gas
- 15.2%Electricity
- 1.4%No fuel used
- 0.5%Bottled, tank, or LP gas
- 0.5%Wood
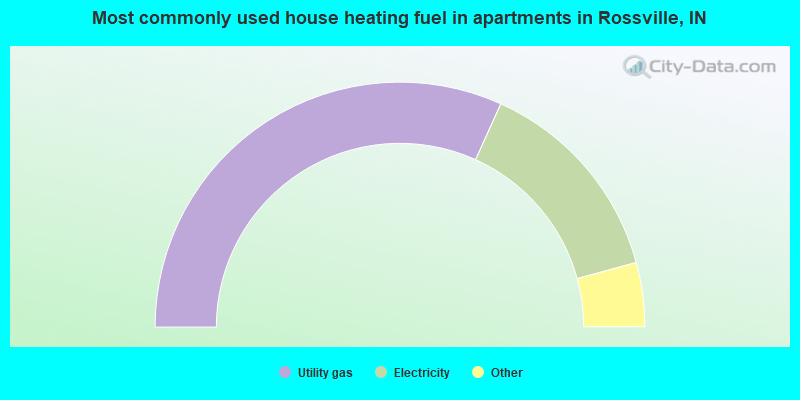
- 63.7%Utility gas
- 28.1%Electricity
- 3.8%Bottled, tank, or LP gas
- 3.1%Other fuel
- 1.2%No fuel used
Private vs. public school enrollment:
| Here: | 7.5% |
| Indiana: | 14.9% |
| Here: | 7.9% |
| Indiana: | 11.4% |
| Here: | 8.8% |
| Indiana: | 22.3% |


