Rowland, NC (North Carolina) Houses and Residents
| Rowland: | $92,069 |
| North Carolina: | $280,600 |
Mean price in 2022:
Detached houses: $163,642
Here: $163,642 State: $375,326 Mobile homes: $39,222
Here: $39,222 State: $124,933
Total population: 1,052 (Urban population: 0, Rural population: 1,190 (all nonfarm))
Houses: 556 (470 occupied: 302 owner occupied, 178 renter occupied)
| % of renters here: | 37% |
| State: | 33% |
Housing density: 524 houses/condos per square mile
Median price asked for vacant for-sale houses and condos in 2022: $114,051.
Median contract rent in 2022: $353 (lower quartile is $180, upper quartile is $504)
Median rent asked for vacant for-rent units in 2022: $817
Median gross rent in Rowland, NC in 2022: $628
Housing units in Rowland with a mortgage: 117 (0 second mortgage, 0 home equity loan, 0 both second mortgage and home equity loan)
Houses without a mortgage: 0
Median household income for houses/condos with a mortgage: $42,823
Median household income for apartments without a mortgage: $19,118
Median monthly housing costs: $636
Compare current foreclosures near Rowland, NC:
| Photo | Address | Area | Beds / Baths | Price | Details |
|---|---|---|---|---|---|

|
#1
Brayboy Rd
Rowland, NC 28383
|
- sq. feet
|
2 baths 3 beds |
show details | |

|
#2
Boardwalk Dr
Rowland, NC 28383
|
1,904 sq. feet
|
1 baths 3 beds |
show details | |

|
#3
N Martin Luther King Jr St
Rowland, NC 28383
|
1,848 sq. feet
|
2 baths 3 beds |
show details | |

|
#4
S Chicken Rd
Rowland, NC 28383
|
999 sq. feet
|
1 baths 3 beds |
show details | |

|
#5
Cabinet Shop Rd
Rowland, NC 28383
|
- sq. feet
|
- baths - beds |
show details | |

|
#6
Justin Rd
Rowland, NC 28383
|
- sq. feet
|
- baths - beds |
show details | |

|
#7
Kitchen Street Rd
Rowland, NC 28383
|
- sq. feet
|
- baths - beds |
show details | |

|
#8
Carolina St
Maxton, NC 28364
|
- sq. feet
|
1 baths 3 beds |
$69,900
|
show details |

|
#9
Turkey Branch Rd
Fairmont, NC 28340
|
972 sq. feet
|
1 baths 2 beds |
$17,900
|
show details |

|
#10
Fairway Dr
Laurinburg, NC 28352
|
3,352 sq. feet
|
3 baths 4 beds |
show details |
| Photo | Address | Area | Beds / Baths | Price | Details |
|---|---|---|---|---|---|

|
#11
Jackson St
Fairmont, NC 28340
|
- sq. feet
|
1 baths 3 beds |
show details | |

|
#12
N Main St
Fairmont, NC 28340
|
1,763 sq. feet
|
2 baths 3 beds |
show details | |

|
#13
Baltimore Church Rd
Fairmont, NC 28340
|
1,620 sq. feet
|
2 baths 3 beds |
show details | |

|
#14
Sonny Dr
Dillon, SC 29536
|
- sq. feet
|
2 baths 4 beds |
show details | |

|
#15
Progressive Farm Rd
Fairmont, NC 28340
|
1,950 sq. feet
|
3 baths 5 beds |
show details | |

|
#16
Tobacco Rd
Orrum, NC 28369
|
1,792 sq. feet
|
2 baths 3 beds |
show details | |

|
#17
Nc Highway 130 W
Maxton, NC 28364
|
480 sq. feet
|
1 baths 2 beds |
show details | |

|
#18
Old Johns Rd
Laurinburg, NC 28352
|
1,152 sq. feet
|
2 baths 3 beds |
show details | |

|
#19
Pleasant Hope Rd
Fairmont, NC 28340
|
2,128 sq. feet
|
2 baths 3 beds |
show details | |

|
#20
Deep Branch Rd
Lumberton, NC 28360
|
2,764 sq. feet
|
2 baths 3 beds |
show details |
| Photo | Address | Area | Beds / Baths | Price | Details |
|---|---|---|---|---|---|

|
#21
Deep Branch Rd
Pembroke, NC 28372
|
1,680 sq. feet
|
2 baths 3 beds |
show details | |

|
#22
Lombard St
Maxton, NC 28364
|
1,248 sq. feet
|
1 baths 3 beds |
show details | |

|
#23
Coward Dr
Fairmont, NC 28340
|
1,248 sq. feet
|
2 baths 3 beds |
show details | |

|
#24
Jenkins St
Fairmont, NC 28340
|
1,577 sq. feet
|
1 baths 2 beds |
show details | |

|
#25
Church St
Fairmont, NC 28340
|
1,280 sq. feet
|
1 baths 2 beds |
show details | |

|
#26
Straightway Dr
Fairmont, NC 28340
|
1,944 sq. feet
|
2 baths 3 beds |
show details | |

|
#27
Nc Highway 71 N
Maxton, NC 28364
|
1,649 sq. feet
|
2 baths 3 beds |
show details | |

|
#28
Fairway Dr
Laurinburg, NC 28352
|
2,108 sq. feet
|
3 baths 4 beds |
show details | |

|
#29
W Carthage Rd
Lumberton, NC 28360
|
1,107 sq. feet
|
1 baths 3 beds |
show details | |

|
#30
Boone Rd
Lumberton, NC 28360
|
1,053 sq. feet
|
1 baths 3 beds |
show details |
| Photo | Address | Area | Beds / Baths | Price | Details |
|---|---|---|---|---|---|

|
#31
Front St
Lumberton, NC 28358
|
1,260 sq. feet
|
1 baths 2 beds |
show details | |

|
#32
Bryants Cir
Maxton, NC 28364
|
1,581 sq. feet
|
2 baths 3 beds |
show details | |

|
#33
Road
Dillon, SC 29536
|
- sq. feet
|
- baths - beds |
$109,900
|
show details |

|
#34
Summer Ln
Laurinburg, NC 28352
|
1,406 sq. feet
|
2 baths 3 beds |
show details | |

|
#35
Jigsaw Ln
Maxton, NC 28364
|
- sq. feet
|
- baths - beds |
show details | |

|
#36
Pea Bridge Rd
Laurinburg, NC 28352
|
- sq. feet
|
- baths - beds |
show details | |

|
#37
Elijah Rd
Orrum, NC 28369
|
- sq. feet
|
- baths - beds |
show details | |

|
#38
Elkins Rd
Hamer, SC 29547
|
- sq. feet
|
- baths - beds |
show details | |

|
#39
Johnny Johnson St
Lumberton, NC 28360
|
- sq. feet
|
- baths - beds |
show details | |

|
#40
Bascus St
Lake View, SC 29563
|
- sq. feet
|
- baths - beds |
show details |
| Photo | Address | Area | Beds / Baths | Price | Details |
|---|---|---|---|---|---|

|
#41
W 12th Ave
Lake View, SC 29563
|
- sq. feet
|
- baths - beds |
show details | |

|
#42
E Dr M L King Jr Dr
Maxton, NC 28364
|
- sq. feet
|
- baths - beds |
show details | |

|
#43
N. C. Hwy 72 West
Lumberton, NC 28360
|
- sq. feet
|
- baths - beds |
show details | |

|
#44
Sanbryer Ln
Maxton, NC 28364
|
- sq. feet
|
- baths - beds |
show details | |

|
#45
Cy Williams Blvd # A
Lumberton, NC 28360
|
- sq. feet
|
- baths - beds |
show details | |

|
#46
Burnells Lane
Marietta, NC 28362
|
- sq. feet
|
- baths - beds |
show details | |

|
#47
Pine St
Latta, SC 29565
|
- sq. feet
|
- baths - beds |
show details | |

|
#48
Holly St
Latta, SC 29565
|
- sq. feet
|
- baths - beds |
show details | |

|
#49
Etta Dr
Latta, SC 29565
|
- sq. feet
|
- baths - beds |
show details | |

|
Check over 1 million property listings on Foreclosure.com!
|
browse all offers | |||

Latest news about housing in Rowland, NC collected exclusively by city-data.com from local newspapers, TV, and radio stations

 | Currently Visiting in Charlotte Area (13 replies) |
| Worst towns in North Carolina? (775 replies) |
| House Cleaning? (9 replies) |
| Fairmont NC (3 replies) |
| Moving to Fuquay Varina (6 replies) |

Median year apartment built: 1972
Household type by relationship:
Households: 995- Male householders: 230 (58 living alone), Female householders: 234 (126 living alone)
98 spouses (98 opposite-sex spouses), 13 unmarried partners, (13 opposite-sex unmarried partners), 253 children (230 natural, 3 adopted, 18 stepchildren), 33 grandchildren, 43 brothers or sisters, 11 parents, 0 foster children, 31 other relatives, 44 non-relatives
Size of family households: 82 2-persons, 140 3-persons, 26 4-persons, 20 5-persons, 4 6-persons.
Size of nonfamily households: 185 1-person, 14 2-persons.
41 married couples with children.
74 single-parent households (22 men, 52 women).
100.2% of residents of Rowland speak English at home.
| Here: | 5.9 |
| State: | 6.4 |
| Here: | 4.7 |
| State: | 4.4 |

- Bedrooms in owner-occupied houses and condos in Rowland, North Carolina
- 0no bedroom
- 01 bedroom
- 482 bedrooms
- 1583 bedrooms
- 154 bedrooms
- 805+ bedrooms

- Bedrooms in renter-occupied apartments in Rowland, North Carolina
- 28no bedroom
- 211 bedroom
- 432 bedrooms
- 753 bedrooms
- 94 bedrooms
- 35+ bedrooms

- Cars and other vehicles available in Rowland in owner-occupied houses/condos
- 24no vehicle
- 961 vehicle
- 712 vehicles
- 313 vehicles
- 34 vehicles
- 785+ vehicles

- Cars and other vehicles available in Rowland in renter-occupied apartments
- 50no vehicle
- 861 vehicle
- 242 vehicles
- 193 vehicles
- 04 vehicles
- 05+ vehicles

- Rooms in owner-occupied houses in Rowland, North Carolina
- 01 room
- 02 rooms
- 03 rooms
- 434 rooms
- 945 rooms
- 416 rooms
- 947 rooms
- 58 rooms
- 269+ rooms

- Rooms in renter-occupied apartments in Rowland, North Carolina
- 281 room
- 32 rooms
- 163 rooms
- 284 rooms
- 735 rooms
- 156 rooms
- 67 rooms
- 68 rooms
- 39+ rooms


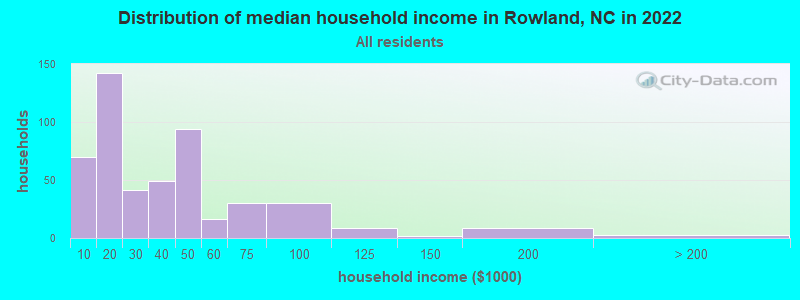
Rowland, NC household income distribution

- 70Less than $10,000
- 142$10,000 to $19,999
- 41$20,000 to $29,999
- 49$30,000 to $39,999
- 94$40,000 to $49,999
- 16$50,000 to $59,999
- 30$60,000 to $74,999
- 30$75,000 to $99,999
- 9$100,000 to $124,999
- 2$125,000 to $149,999
- 9$150,000 to $199,999
- 3$200,000 or more
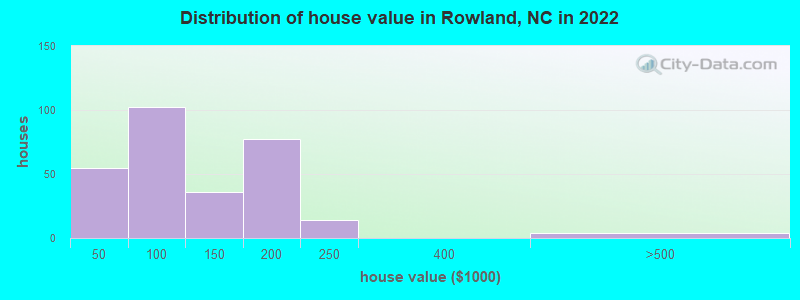
Home value of owner - occupied houses in 2022 in Rowland, NC
-
- 3Less than $10,000
- 12$10,000 to $14,999
- 10$15,000 to $19,999
- 2$20,000 to $24,999
- 6$25,000 to $29,999
- 13$30,000 to $34,999
- 3$35,000 to $39,999
- 3$40,000 to $49,999
- 10$50,000 to $59,999
- 16$60,000 to $69,999
- 58$70,000 to $79,999
- 5$80,000 to $89,999
- 8$90,000 to $99,999
- 25$100,000 to $124,999
- 10$125,000 to $149,999
- 10$150,000 to $174,999
- 66$175,000 to $199,999
- 13$200,000 to $249,999
- 4$400,000 to $499,999
Rent paid by renters in 2022 in Rowland, NC
-
- 9Less than $100
- 13$100 to $149
- 11$150 to $199
- 21$200 to $249
- 13$250 to $299
- 19$300 to $349
- 9$350 to $399
- 11$400 to $449
- 10$450 to $499
- 16$500 to $549
- 3$550 to $599
- 10$650 to $699
- 4$750 to $799
- 27No cash rent


Percentage of workers working in this county: 68.9%
Number of people working at home: 0 (0.0% of all workers)
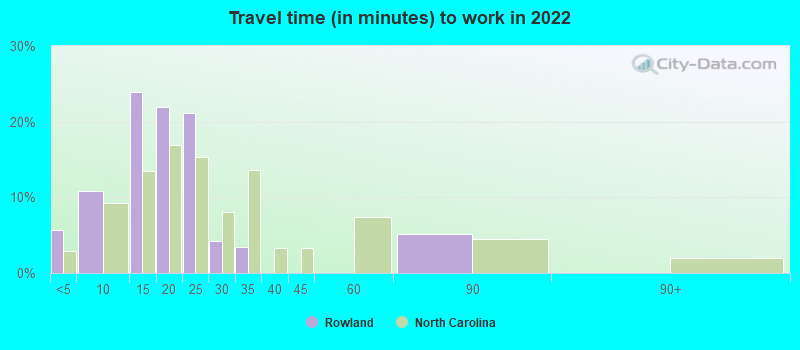
Travel time to work (commute)
- Less than 5 minutes: 28
- 5 to 9 minutes: 28
- 10 to 14 minutes: 11
- 15 to 19 minutes: 27
- 20 to 24 minutes: 54
- 25 to 29 minutes: 2
- 30 to 34 minutes: 45
- 35 to 39 minutes: 6
- 40 to 44 minutes: 0
- 45 to 59 minutes: 4
- 60 to 89 minutes: 50
- 90 or more minutes: 4
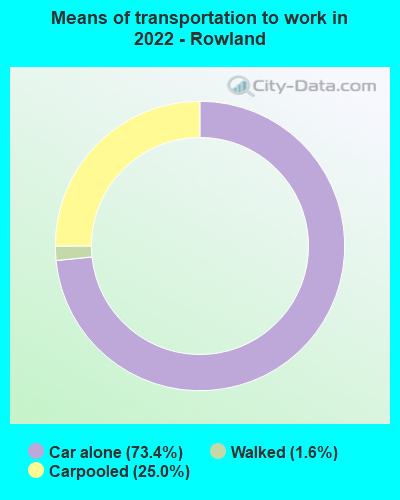
Means of transportation to work:
- Drove a car alone: 349 (67.6%)
- Carpooled: 107 (20.7%)
- Walked: 7 (1.4%)
- Worked at home: 12 (2.3%)

- Unemployment by race in 2022
- Unemployment rate for Black residents
- 11.2%Males
- 6.4%Females
- Unemployment rate for American Indian and Alaska Native residents
- 32.3%Males

- Year of entry for the foreign-born population in Rowland, North Carolina
- 01995 to March 2000
- 01990 to 1994
- 21985 to 1989
- 01980 to 1984
- 21975 to 1979
- 01970 to 1974
- 01965 to 1969
- 1Before 1965

First ancestries reported:
- American: 71 (7.4%)
- Irish: 3 (0.3%)
- European: 2 (0.2%)
- Scotch-Irish: 2 (0.2%)
- Scottish: 2 (0.2%)
- Welsh: 2 (0.2%)
Most common places of birth for foreign-born residents (%):
| Rowland: | 80.0% (4) |
| North Carolina: | 3.8% (16,264) |
Place of birth for U.S.-born residents:
- This state: 752
- Other state: 258
- Northeast: 27
- Midwest: 4
- South: 212
- West: 0
97.3% of Rowland residents lived in the same house 1 years ago.
Out of people who lived in different houses, 28.6% lived in this county.
Out of people who lived in different counties, 85.7% lived in North Carolina.
| Rowland: | 97.3% |
| State average: | 87.3% |
Education attainment for males 25 years and older:
- No schooling: 0
- Nursery to 4th grade: 0
- 5th and 6th grade: 1
- 7th and 8th grade: 3
- 9th grade: 4
- 10th grade: 7
- 11th grade: 6
- 12th grade, no diploma: 0
- High school graduate (or equivalency): 136
- Less than 1 year of college: 5
- Some college more than 1 year, no degree: 105
- Associate degree: 14
- Bachelor's degree: 21
- Master's degree: 8
- Professional school degree: 0
- Doctorate degree: 0

Education attainment for females 25 years and older:
- No schooling: 0
- Nursery to 4th grade: 0
- 5th and 6th grade: 0
- 7th and 8th grade: 8
- 9th grade: 6
- 10th grade: 16
- 11th grade: 19
- 12th grade, no diploma: 0
- High school graduate (or equivalency): 128
- Less than 1 year of college: 20
- Some college more than 1 year, no degree: 92
- Associate degree: 22
- Bachelor's degree: 53
- Master's degree: 14
- Professional school degree: 0
- Doctorate degree: 0


Housing units in structures:
- One, detached: 461
- Two: 26
- 3 or 4: 11
- 5 to 9: 6
- 20 to 49: 3
- 50 or more: 2
- Mobile homes: 47
Median worth of mobile homes: $30,083
Housing units lacking complete kitchen facilities in 2022: 8.7%
House/condo owner moved in on average 29 years ago
Renter moved in on average 6 years ago

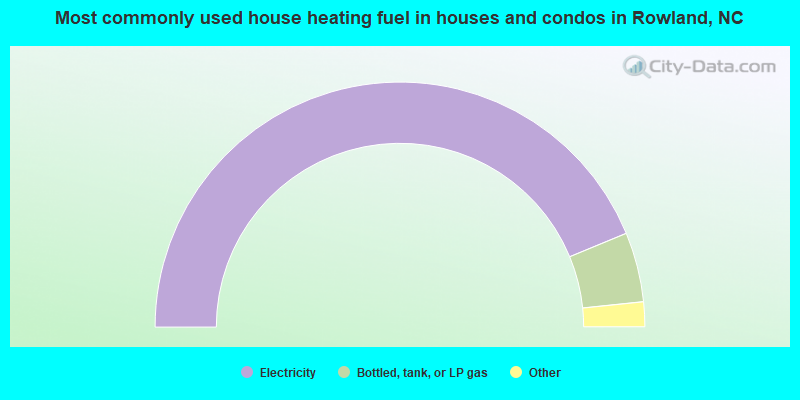
- 87.8%Electricity
- 9.2%Bottled, tank, or LP gas
- 2.0%Wood
- 1.0%Fuel oil, kerosene, etc.
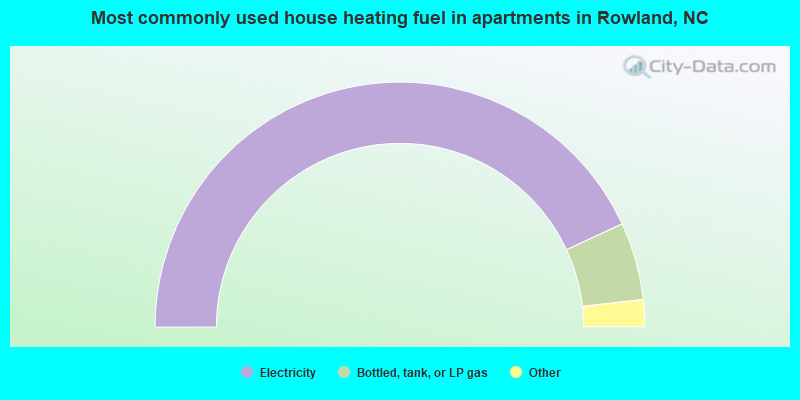
- 86.8%Electricity
- 10.3%Bottled, tank, or LP gas
- 1.7%Wood
- 1.1%Fuel oil, kerosene, etc.
Private vs. public school enrollment:
| Here: | 3.7% |
| North Carolina: | 13.8% |
| Here: | 0.0% |
| North Carolina: | 11.9% |
| Here: | 0.0% |
| North Carolina: | 19.3% |


