Runaway Bay, TX (Texas) Houses and Residents
| Runaway Bay: | $285,050 |
| Texas: | $275,400 |
Total population: 1,381 (Urban population: 0, Rural population: 1,110 (all nonfarm))
Houses: 831 (732 occupied: 611 owner occupied, 143 renter occupied)
| % of renters here: | 19% |
| State: | 38% |
Housing density: 360 houses/condos per square mile
Median price asked for vacant for-sale houses and condos in 2022: $178,802.
Median contract rent in 2022: $1,163 (lower quartile is $827, upper quartile is $1,228)
Median rent asked for vacant for-rent units in 2022: $1,011
Median gross rent in Runaway Bay, TX in 2022: $1,451
Housing units in Runaway Bay with a mortgage: 297 (8 second mortgage, 0 home equity loan, 4 both second mortgage and home equity loan)
Houses without a mortgage: 0
Median household income for houses/condos with a mortgage: $92,035
Median household income for apartments without a mortgage: $102,698
Median monthly housing costs: $1,202
Compare current foreclosures near Runaway Bay, TX:
| Photo | Address | Area | Beds / Baths | Price | Details |
|---|---|---|---|---|---|

|
#1
N Trappier St
Alvord, TX 76225
|
- sq. feet
|
1 baths 2 beds |
show details | |

|
#2
Newby Ave
Bridgeport, TX 76426
|
1,362 sq. feet
|
2 baths 3 beds |
show details | |

|
#3
Oakridge Trl
Bridgeport, TX 76426
|
3,116 sq. feet
|
2 baths 3 beds |
show details | |

|
#4
Maple St
Paradise, TX 76073
|
1,758 sq. feet
|
2 baths 4 beds |
show details | |

|
#5
Eagles Way
Springtown, TX 76082
|
1,453 sq. feet
|
2 baths 3 beds |
show details | |

|
#6
West Hwy 199
Springtown, TX 76082
|
- sq. feet
|
3 baths 3 beds |
show details | |

|
#7
Ballard Rd
Weatherford, TX 76088
|
2,611 sq. feet
|
- baths - beds |
show details | |

|
#8
Us Highway 380
Decatur, TX 76234
|
- sq. feet
|
- baths - beds |
show details | |

|
#9
County Road 1348
Chico, TX 76431
|
2,101 sq. feet
|
- baths - beds |
show details | |

|
#10
Jordan Rd
Poolville, TX 76487
|
- sq. feet
|
- baths - beds |
show details |
| Photo | Address | Area | Beds / Baths | Price | Details |
|---|---|---|---|---|---|

|
#11
Agnes N
Springtown, TX 76082
|
2,010 sq. feet
|
- baths - beds |
show details | |

|
#12
Agnes N
Springtown, TX 76082
|
1,120 sq. feet
|
- baths - beds |
show details | |

|
#13
County Road 1180
Decatur, TX 76234
|
- sq. feet
|
- baths - beds |
show details | |

|
#14
Brown Loop
Poolville, TX 76487
|
- sq. feet
|
- baths - beds |
show details | |

|
#15
Decatur St
Alvord, TX 76225
|
1,360 sq. feet
|
- baths - beds |
show details | |

|
#16
Fortenberry Rd
Decatur, TX 76234
|
2,304 sq. feet
|
- baths - beds |
show details | |

|
#17
Private Road 1176
Alvord, TX 76225
|
- sq. feet
|
- baths - beds |
show details | |

|
#18
County Road 3699
Springtown, TX 76082
|
1,770 sq. feet
|
- baths - beds |
show details | |

|
#19
Paradise Pkwy
Poolville, TX 76487
|
- sq. feet
|
- baths - beds |
show details | |

|
#20
Allison Rd
Springtown, TX 76082
|
1,400 sq. feet
|
- baths - beds |
show details |
| Photo | Address | Area | Beds / Baths | Price | Details |
|---|---|---|---|---|---|

|
#21
Deer Creek Dr
Alvord, TX 76225
|
1,849 sq. feet
|
- baths - beds |
show details | |

|
#22
County Road 1557
Chico, TX 76431
|
2,192 sq. feet
|
- baths - beds |
show details | |

|
#23
Lakeshore Dr
Bridgeport, TX 76426
|
1,644 sq. feet
|
- baths - beds |
show details | |

|
#24
Gordon Cir
Bridgeport, TX 76426
|
- sq. feet
|
- baths - beds |
show details | |

|
#25
County Road 1635
Chico, TX 76431
|
- sq. feet
|
- baths - beds |
show details | |

|
#26
Meadow Pond Ct
Bridgeport, TX 76426
|
1,726 sq. feet
|
- baths - beds |
show details | |

|
#27
N Main St
Bridgeport, TX 76426
|
- sq. feet
|
- baths - beds |
show details | |

|
#28
Hunter Trl
Bridgeport, TX 76426
|
- sq. feet
|
- baths - beds |
show details | |

|
#29
Cobb St
Bridgeport, TX 76426
|
- sq. feet
|
- baths - beds |
show details | |

|
#30
County Road 3336
Bridgeport, TX 76426
|
- sq. feet
|
- baths - beds |
show details |
| Photo | Address | Area | Beds / Baths | Price | Details |
|---|---|---|---|---|---|

|
#31
Private Road 3337
Bridgeport, TX 76426
|
672 sq. feet
|
- baths - beds |
show details | |

|
#32
Hovey St
Bridgeport, TX 76426
|
1,579 sq. feet
|
- baths - beds |
show details | |

|
#33
Cates St
Bridgeport, TX 76426
|
- sq. feet
|
- baths - beds |
show details | |

|
#34
Private Road 1322
Bridgeport, TX 76426
|
- sq. feet
|
- baths - beds |
show details | |

|
#35
Stevens St
Bridgeport, TX 76426
|
- sq. feet
|
- baths - beds |
show details | |

|
#36
Private Road 3870
Poolville, TX 76487
|
- sq. feet
|
- baths - beds |
show details | |

|
#37
County Road 3673
Paradise, TX 76073
|
1,929 sq. feet
|
- baths - beds |
show details | |

|
#38
County Road 3673
Paradise, TX 76073
|
1,570 sq. feet
|
- baths - beds |
show details | |

|
#39
Alvord St Apt 102
Chico, TX 76431
|
- sq. feet
|
- baths - beds |
show details | |

|
#40
County Road 3657
Springtown, TX 76082
|
- sq. feet
|
- baths - beds |
show details |
| Photo | Address | Area | Beds / Baths | Price | Details |
|---|---|---|---|---|---|

|
#41
County Road 3341
Paradise, TX 76073
|
1,836 sq. feet
|
- baths - beds |
show details | |

|
#42
W Highway 114
Paradise, TX 76073
|
2,424 sq. feet
|
- baths - beds |
show details | |

|
#43
Poolville Cut Off Rd
Poolville, TX 76487
|
- sq. feet
|
- baths - beds |
show details | |

|
Check over 1 million property listings on Foreclosure.com!
|
browse all offers | |||


 | It's official. Moving to the Bridgeport area. (6 replies) |
| Requesting Decatur, TX information (20 replies) |

Median year apartment built: 1976
Household type by relationship:
Households: 1,761- Male householders: 443 (116 living alone), Female householders: 320 (75 living alone)
457 spouses (455 opposite-sex spouses), 29 unmarried partners, (29 opposite-sex unmarried partners), 377 children (355 natural, 9 adopted, 11 stepchildren), 37 grandchildren, 23 brothers or sisters, 24 parents, 6 foster children, 10 other relatives, 29 non-relatives
Size of family households: 279 2-persons, 96 3-persons, 44 4-persons, 70 5-persons, 1 6-persons, 11 7-or-more-persons.
Size of nonfamily households: 198 1-person, 48 2-persons.
232 married couples with children.
11 single-parent households (0 men, 11 women).
94.4% of residents of Runaway Bay speak English at home.
3.3% of residents speak Spanish at home (85% speak English very well, 15% speak English well).
2.9% of residents speak other Indo-European language at home (90% speak English very well, 10% speak English well).
0.1% of residents speak Asian or Pacific Island language at home (100% speak English very well).
Foreign born population: 56 (3.2%)
(64.3% of them are naturalized citizens)
| Here: | 6.1 |
| State: | 6.3 |
| Here: | 4.0 |
| State: | 4.0 |

- Bedrooms in owner-occupied houses and condos in Runaway Bay, Texas
- 0no bedroom
- 261 bedroom
- 742 bedrooms
- 3903 bedrooms
- 1214 bedrooms
- 05+ bedrooms

- Bedrooms in renter-occupied apartments in Runaway Bay, Texas
- 0no bedroom
- 491 bedroom
- 342 bedrooms
- 573 bedrooms
- 44 bedrooms
- 05+ bedrooms

- Cars and other vehicles available in Runaway Bay in owner-occupied houses/condos
- 0no vehicle
- 1491 vehicle
- 2712 vehicles
- 1003 vehicles
- 824 vehicles
- 85+ vehicles

- Cars and other vehicles available in Runaway Bay in renter-occupied apartments
- 0no vehicle
- 651 vehicle
- 352 vehicles
- 433 vehicles
- 04 vehicles
- 05+ vehicles

- Rooms in owner-occupied houses in Runaway Bay, Texas
- 01 room
- 42 rooms
- 243 rooms
- 534 rooms
- 1315 rooms
- 1756 rooms
- 1247 rooms
- 618 rooms
- 399+ rooms

- Rooms in renter-occupied apartments in Runaway Bay, Texas
- 01 room
- 182 rooms
- 313 rooms
- 344 rooms
- 455 rooms
- 36 rooms
- 27 rooms
- 88 rooms
- 29+ rooms


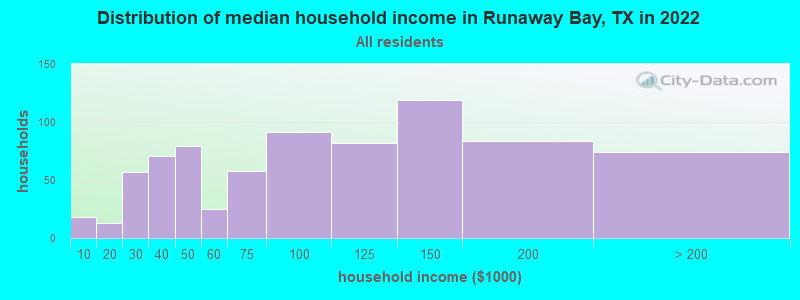
Runaway Bay, TX household income distribution

- 18Less than $10,000
- 13$10,000 to $19,999
- 57$20,000 to $29,999
- 71$30,000 to $39,999
- 79$40,000 to $49,999
- 25$50,000 to $59,999
- 58$60,000 to $74,999
- 91$75,000 to $99,999
- 82$100,000 to $124,999
- 119$125,000 to $149,999
- 84$150,000 to $199,999
- 74$200,000 or more
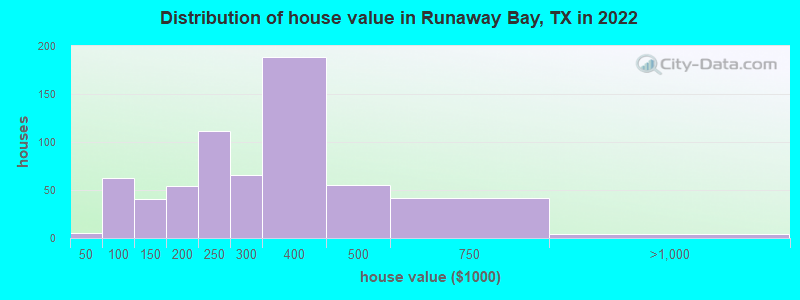
Home value of owner - occupied houses in 2022 in Runaway Bay, TX
-
- 5Less than $10,000
- 14$50,000 to $59,999
- 6$60,000 to $69,999
- 16$70,000 to $79,999
- 21$80,000 to $89,999
- 3$90,000 to $99,999
- 25$100,000 to $124,999
- 15$125,000 to $149,999
- 34$150,000 to $174,999
- 19$175,000 to $199,999
- 110$200,000 to $249,999
- 65$250,000 to $299,999
- 188$300,000 to $399,999
- 54$400,000 to $499,999
- 42$500,000 to $749,999
- 4$750,000 to $999,999
Rent paid by renters in 2022 in Runaway Bay, TX
-
- 1$350 to $399
- 2$500 to $549
- 2$550 to $599
- 5$700 to $749
- 19$750 to $799
- 23$800 to $899
- 40$1,000 to $1,249
- 10$1,250 to $1,499
- 15$1,500 to $1,999
- 5$2,000 to $2,499
- 14No cash rent


Percentage of workers working in this county: 75.9%
Number of people working at home: 167 (20.8% of all workers)
Travel time to work (commute)
- Less than 5 minutes: 11
- 5 to 9 minutes: 20
- 10 to 14 minutes: 51
- 15 to 19 minutes: 161
- 20 to 24 minutes: 63
- 25 to 29 minutes: 52
- 30 to 34 minutes: 135
- 35 to 39 minutes: 8
- 40 to 44 minutes: 3
- 45 to 59 minutes: 49
- 60 to 89 minutes: 70
- 90 or more minutes: 74
Means of transportation to work:
- Drove a car alone: 430 (82.4%)
- Carpooled: 77 (14.8%)
- Other means: 3 (0.6%)
- Worked at home: 12 (2.3%)

- Unemployment by race in 2022
- Unemployment rate for White non-Hispanic residents
- 3.4%Males
- 4.9%Females
- Unemployment rate for Hispanic or Latino residents
- 9.8%Males

- Year of entry for the foreign-born population in Runaway Bay, Texas
- 102010 or later
- 292000 to 2009
- 01990 to 1999
- 01980 to 1989
- 21970 to 1979
- 1Before 1970

First ancestries reported:
- English: 163 (21.6%)
- American: 133 (17.6%)
- German: 100 (13.2%)
- Irish: 90 (11.9%)
- Scottish: 31 (4.1%)
- Scotch-Irish: 16 (2.1%)
- Welsh: 11 (1.5%)
- European: 8 (1.1%)
- Scandinavian: 8 (1.1%)
- Dutch: 4 (0.5%)
- Italian: 3 (0.4%)
- Swedish: 3 (0.4%)
- Greek: 2 (0.3%)
- Northern European: 2 (0.3%)
- Polish: 2 (0.3%)
- Danish: 1 (0.1%)
Most common places of birth for foreign-born residents (%):
| Runaway Bay: | 51.0% (26) |
| Texas: | 0.6% (27,480) |
| Runaway Bay: | 33.3% (17) |
| Texas: | 3.7% (184,770) |
| Runaway Bay: | 9.8% (5) |
| Texas: | 48.4% (2,411,723) |
| Runaway Bay: | 2.0% (1) |
| Texas: | 0.4% (17,796) |
| Runaway Bay: | 2.0% (1) |
| Texas: | 0.1% (2,687) |
Place of birth for U.S.-born residents:
- This state: 1,113
- Other state: 544
- Northeast: 38
- Midwest: 211
- South: 100
- West: 182
89.7% of Runaway Bay residents lived in the same house 1 years ago.
Out of people who lived in different houses, 25.4% lived in this county.
Out of people who lived in different counties, 64.2% lived in Texas.
| Runaway Bay: | 89.7% |
| State average: | 85.7% |
Education attainment for males 25 years and older:
- No schooling: 0
- Nursery to 4th grade: 0
- 5th and 6th grade: 2
- 7th and 8th grade: 6
- 9th grade: 0
- 10th grade: 10
- 11th grade: 0
- 12th grade, no diploma: 12
- High school graduate (or equivalency): 220
- Less than 1 year of college: 66
- Some college more than 1 year, no degree: 58
- Associate degree: 76
- Bachelor's degree: 133
- Master's degree: 95
- Professional school degree: 52
- Doctorate degree: 27

Education attainment for females 25 years and older:
- No schooling: 15
- Nursery to 4th grade: 0
- 5th and 6th grade: 0
- 7th and 8th grade: 0
- 9th grade: 10
- 10th grade: 22
- 11th grade: 4
- 12th grade, no diploma: 10
- High school graduate (or equivalency): 120
- Less than 1 year of college: 55
- Some college more than 1 year, no degree: 81
- Associate degree: 84
- Bachelor's degree: 243
- Master's degree: 39
- Professional school degree: 4
- Doctorate degree: 0


Housing units in structures:
- One, detached: 654
- One, attached: 14
- Two: 16
- 3 or 4: 68
- 5 to 9: 80
- 10 to 19: 9
Housing units lacking complete kitchen facilities in 2022: 0.4%
House/condo owner moved in on average 6 years ago
Renter moved in on average 0 years ago

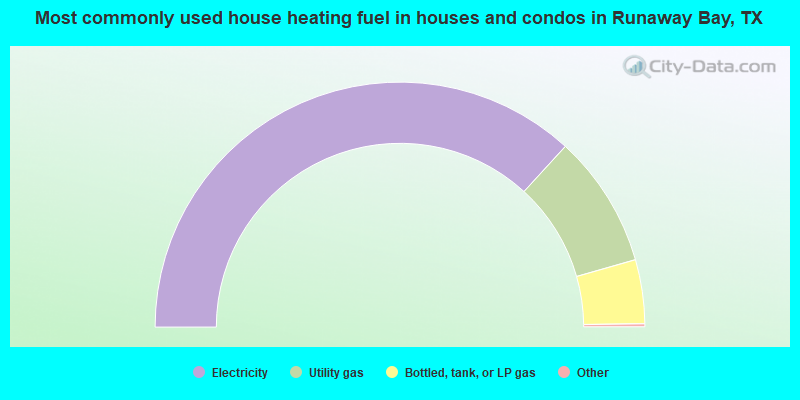
- 73.9%Electricity
- 17.6%Utility gas
- 8.5%Bottled, tank, or LP gas
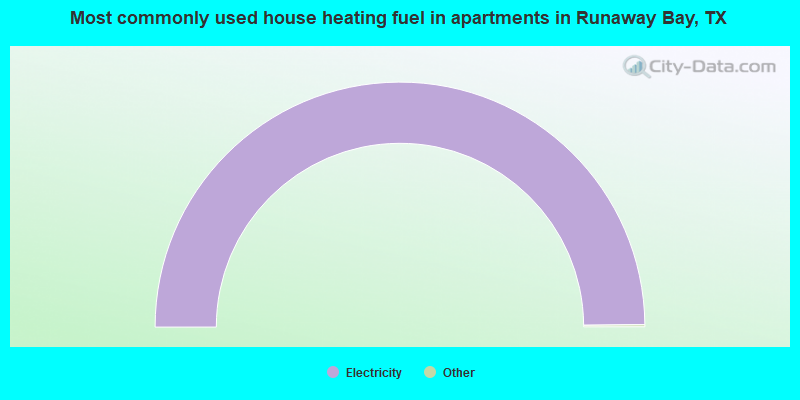
- 100.0%Electricity
Private vs. public school enrollment:
| Here: | 31.6% |
| Texas: | 8.8% |
| Here: | 20.5% |
| Texas: | 8.0% |
| Here: | 39.4% |
| Texas: | 16.2% |


